Top KPIs for lead generation

Not sure which lead generation KPIs you should use to accurately measure the success of your inbound and outbound marketing campaigns? This guide’s got you covered.
- The Best Lead Generation KPIs
- - Number of Leads
- - Number of Sessions
- - Engagement
- - Conversion Rate
- - Total Lead Value
- - Customer Acquisition Cost
- - Customer Lifetime Value
- - Attribution Channels
- How to Measure the Lead Generation KPIs
- Track these lead generation KPIs on DashThis today!
The Best Lead Generation KPIs
According to HubSpot’s 2021 State of Marketing Report, nearly 35% of marketers said that lead generation is their biggest priority.
And no wonder.
Our lead generation metrics determine the next move in our top-of-the-funnel campaign. These key performance indicators show how effective your strategies are at attracting the awareness and interest of your target audience.
The better the KPIs perform, the more sales opportunities you'll have.
True, it takes hours to track and analyze your KPI reporting, but the number of high-quality leads you get makes everything worth it.
Here are eight B2C and B2B lead generation KPIs that should be at the top of your list.
Number of Leads
If there’s one metric involving both the marketing and sales team, it's the number of quality leads.
Typically, marketing focuses more on marketing qualified leads (MQLs). To turn these new leads into qualified leads, marketers would nurture them with targeted marketing efforts.
Once these leads show interest, they become sales qualified leads (SQLs) and the marketing team will hand them over to the salesperson.
Number of Sessions
Number of sessions refers to the total number of new and repeat visits to your website within a period.
We can’t talk about number of sessions without mentioning other key metrics like bounce rate and average session duration. All three KPIs identify issues in the website visitor’s journey.
Here’s a Google Analytics report to illustrate what we mean.
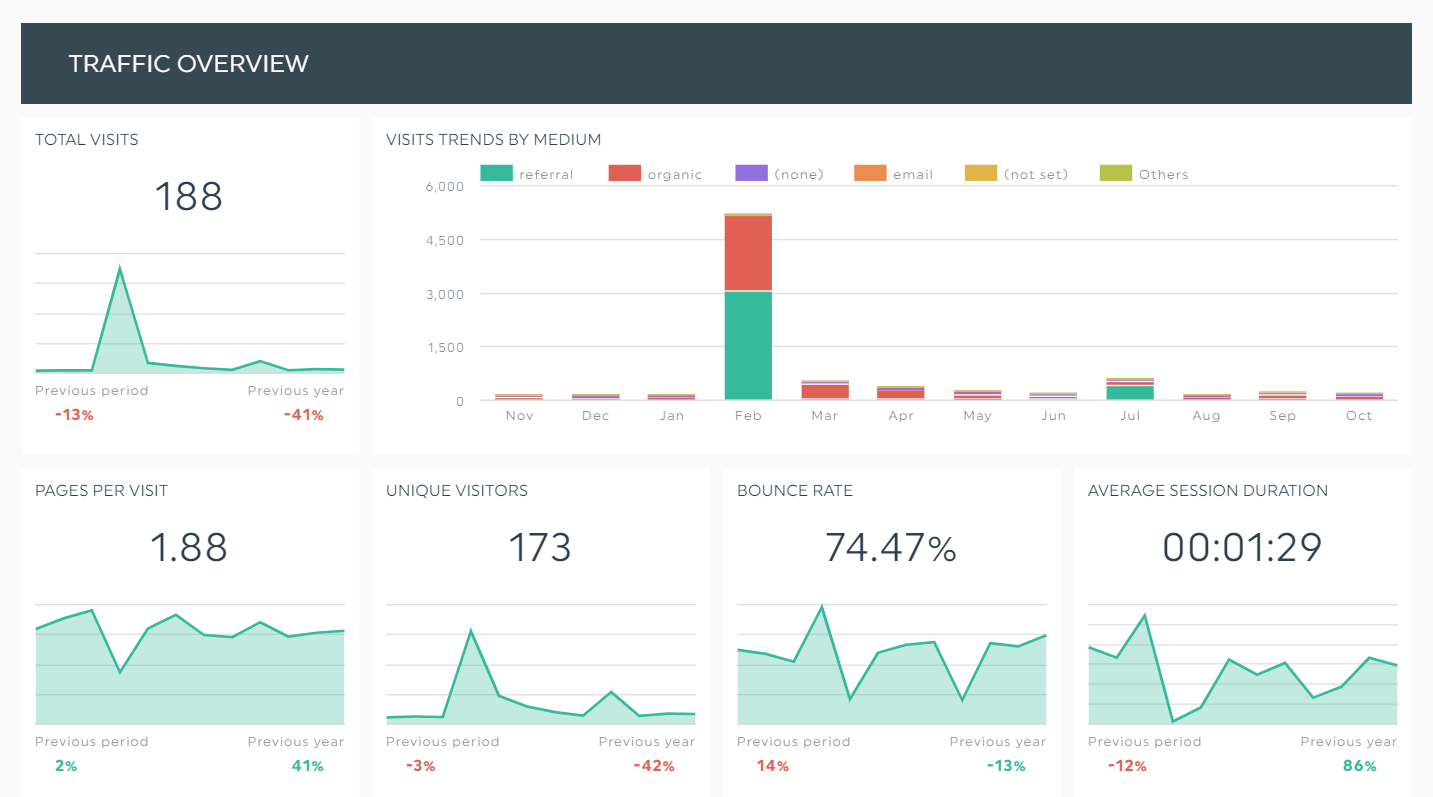
Grab this Google Analytics report with your own data!
A website traffic report like this invites a lot of questions, doesn’t it? All the more reason to keep reading this post to learn more about the remaining lead generation KPIs!
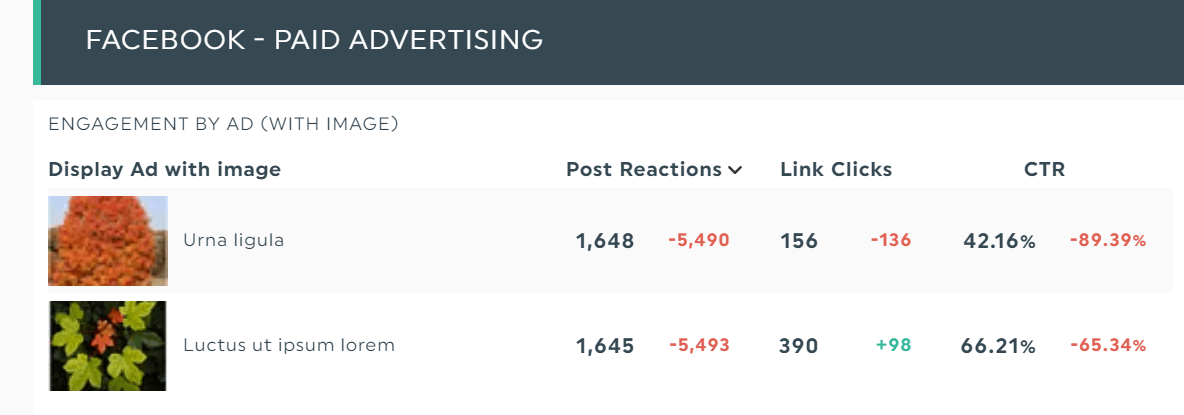
Engagement
The engagement metric measures your potential customer's engagement with your content (e.g., likes, shares, comments). It’s often used in social media marketing campaigns.
It’s also widely touted as a vanity metric (spoiler: it’s not as it ultimately depends on context). Here’s a LinkedIn business report to show you what we mean.
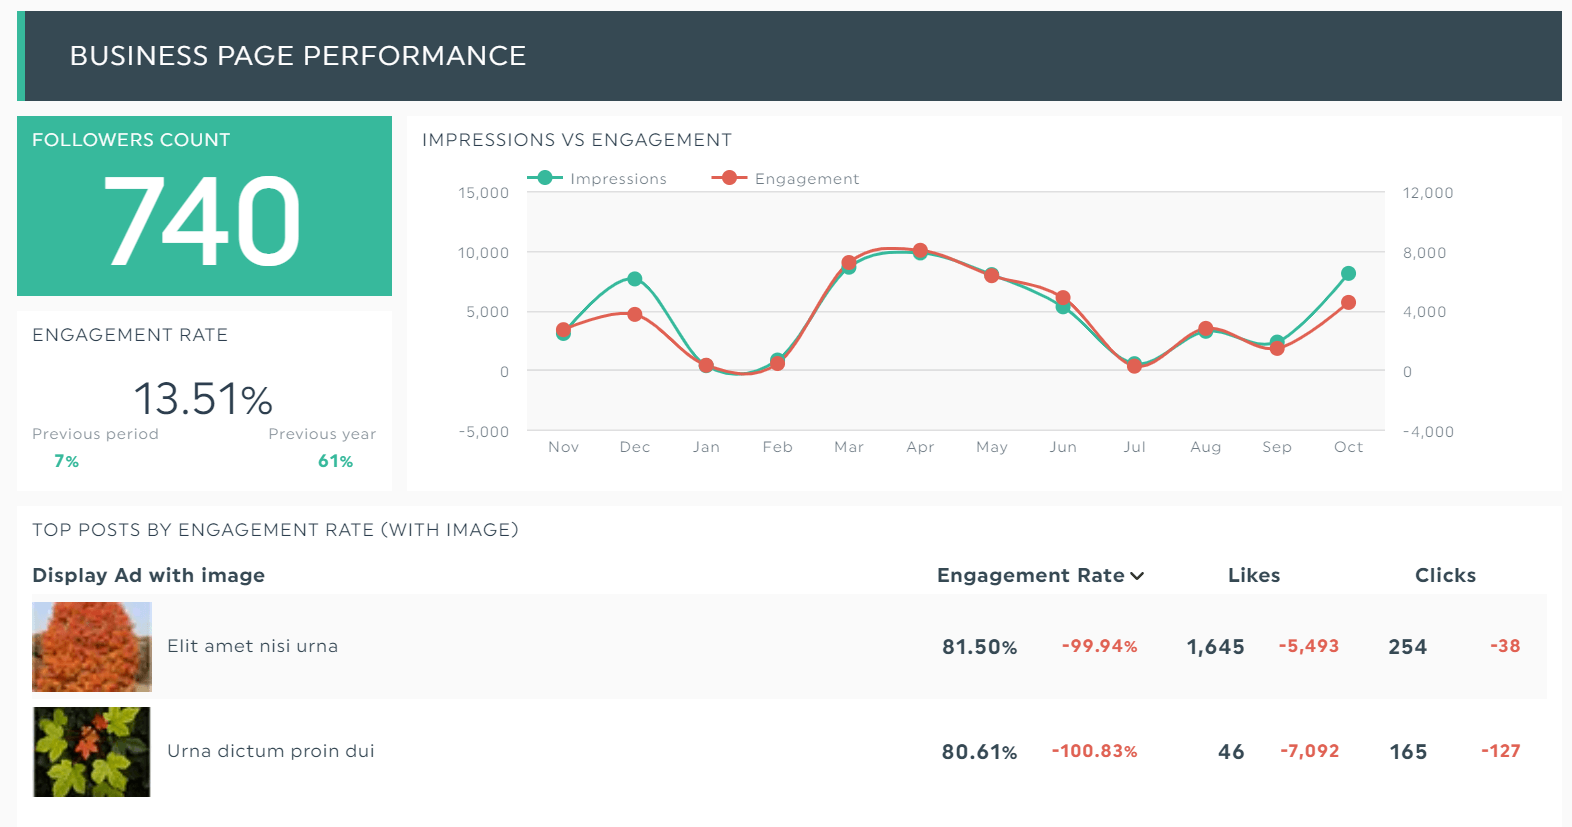
Grab this LinkedIn business report template with your own data!
Did you see the top posts by engagement rate?
The number of likes and clicks help you determine if your content is resonating with prospective customers.
Conversion Rate
Conversion rate is the percentage of visitors that complete an action. Similarly, lead conversion rate refers to the percentage of visitors captured as leads.
It’s calculated using the formula: Number of conversions / Total number of visitors
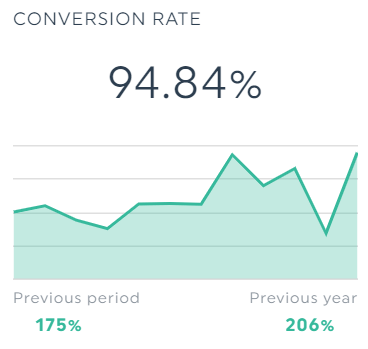
The higher the conversion rate in a lead generation campaign, the better it is. This indicates that your marketing strategy is working.
Tip: If you’re seeing a low conversion rate and high bounce rate from paid ads, it probably means there’s a disconnect between your ad and landing page copy. On the other hand, a low click-through rate and conversion rate could mean your ad copy (e.g., caption, call-to-action) needs work.
Note: Conversion rate is different from click-through rate (CTR), which is the percentage of visitors who click your post to visit your website or landing page.
Total Lead Value
Total lead value tells you how much your leads are worth to your business.
Use this formula to calculate it: Total sales value / Total leads
Since this KPI predicts your incoming sales, you can make informed decisions on generating more leads.
Customer Acquisition Cost
Customer acquisition cost (CAC) is the total amount of money spent to acquire a new customer.
It helps you stay on track on your marketing budget, and it’s calculated using the formula: Total marketing spend / Total number of new customers
The lower the CAC, the better. This means you’re not spending on acquiring paying customers at the cost of profitability. You want to make sure you’re getting a high return on investment (ROI)!
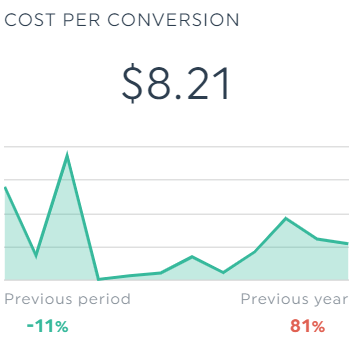
Note: CAC is different from cost per lead (CPL), which is the total amount of money spent to acquire a new lead. There’s also another similar metric: Cost per conversion (pictured above), which refers to the total cost to spend on an action (e.g., submit a form, download a lead magnet).
Customer Lifetime Value
Customer lifetime value (CLV or CLTV) is the total amount of revenue a business can expect to earn from a customer during the span of their relationship.
To calculate it, use this formula: Lifetime value* x Profit margin
* Average value of sales x Number of transactions x Retention time
CLTV identifies your best customers. We dare say that it’s one of the most important metrics that impact revenue.
There are multiple ways to boost CLTV. If you’re a B2B marketing agency, you could upgrade your CRM to improve customer service or create a content marketing strategy for post-purchase loyalty.
Attribution Channels
Attribution channels identify your best-performing marketing channels.
And by “best-performing,” we’re talking about things like increasing your sales funnel conversions and closing sales faster in a sales process.
Chances are, you won’t experience success in all channels—and that’s okay! Focus more on those that work and increase your budget.
How to Measure the Lead Generation KPIs
In this section, you’ll learn how to measure your important KPIs for your lead gen campaign in a few quick clicks.
After signing up for an account (your first 15 days are on us, btw!), complete the following steps:
- Connect your data sources
- Create a report (either from scratch or choose from 40+ templates)
- Click Preset Widgets to select your lead generation KPIs
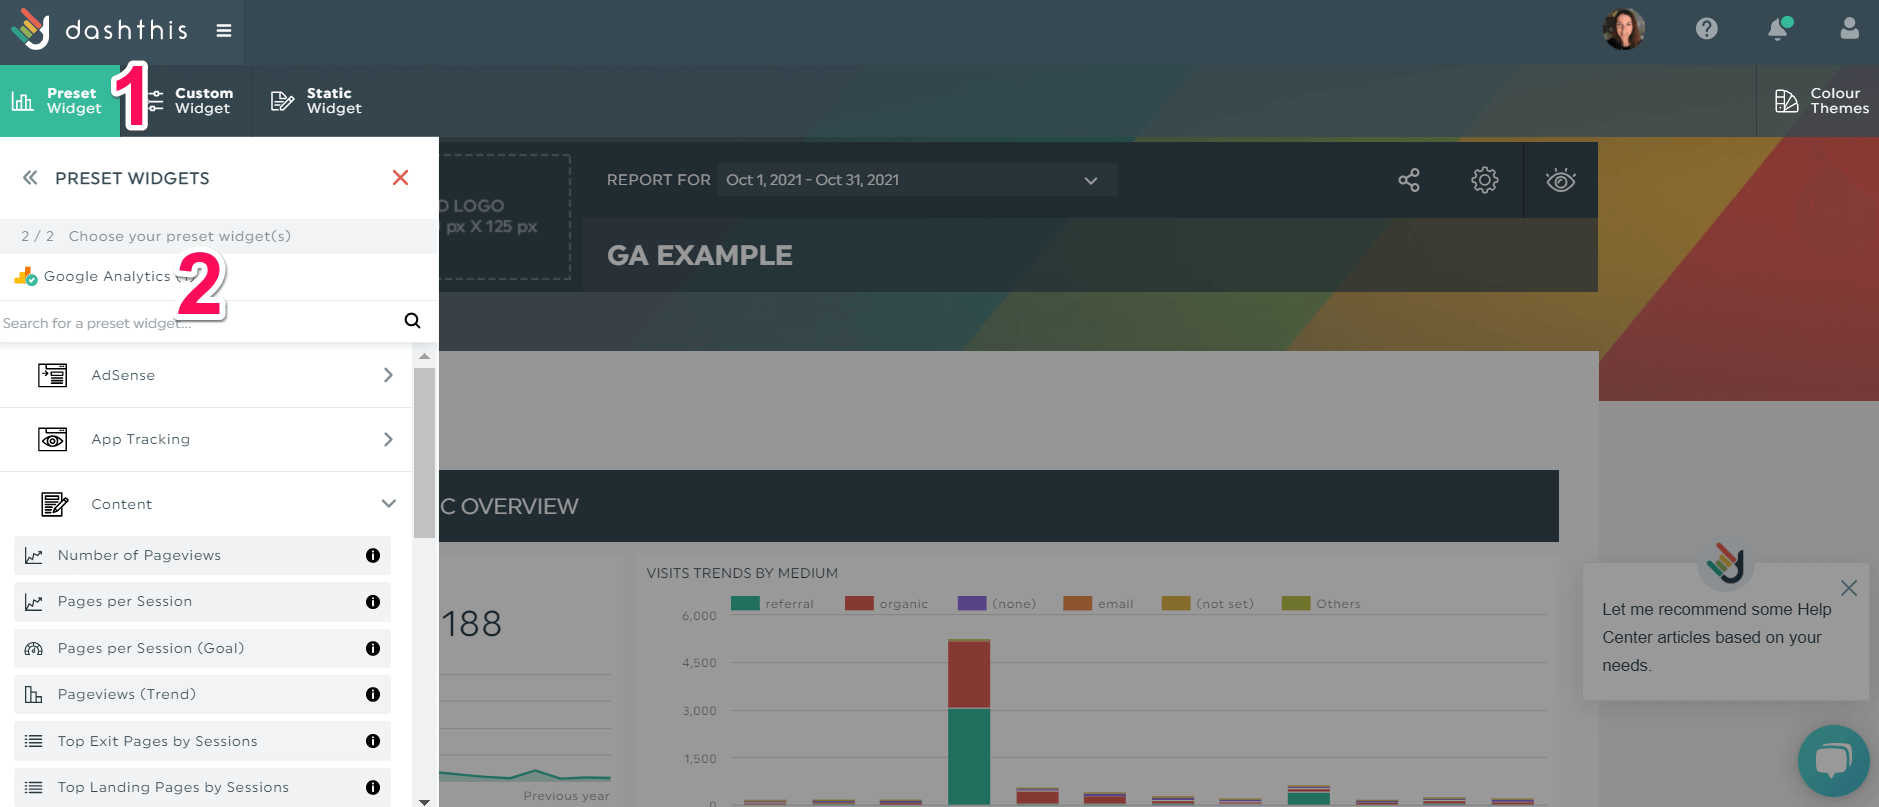
In the Google Analytics report, all KPIs from sales to marketing metrics are grouped according to categories
Take back your time with KPI reporting. Once clicked, DashThis automatically pulls the data of your choosing.
You no longer need to comb through hundreds of data and weed out the metrics you’re looking for across multiple tabs. With DashThis, everything is automated.
You can even customize marketing templates further.
Click:
- Static Widgets > Comments to share your high-level recommendations within the same interface
- Edit Widget > Data Display to change the style of your KPI
- Add Note to explain what the results mean
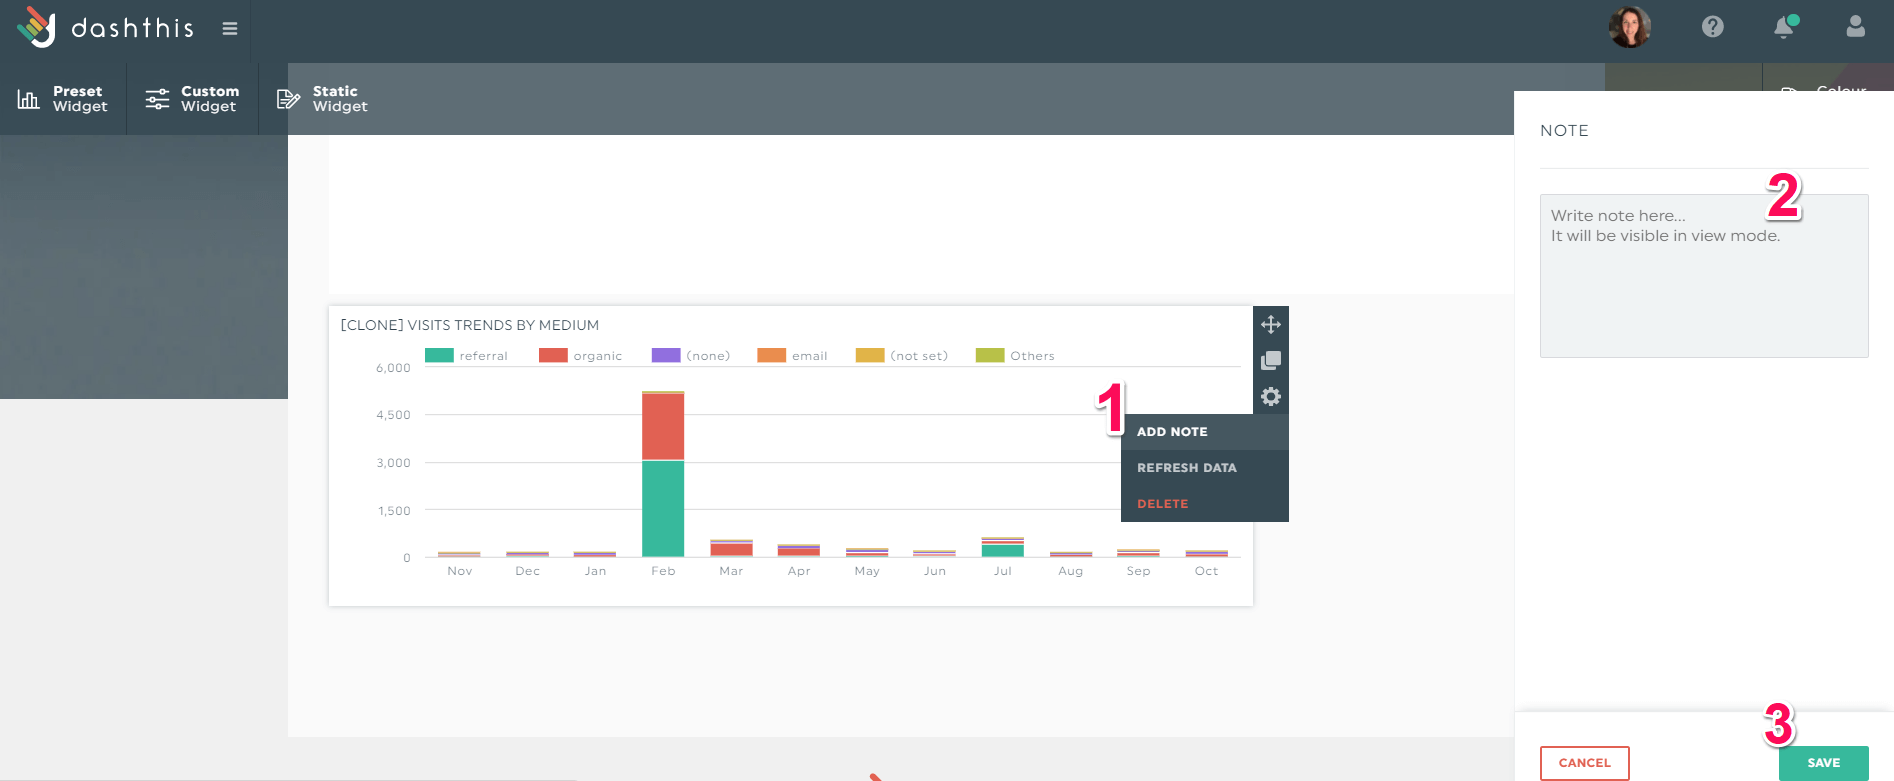
Context matters. Add notes next to a KPI to explain your strategy to clients without expertise.
Once you’re happy with everything you got, click Sharing Options to share it via email or a URL link or download it as a PDF.
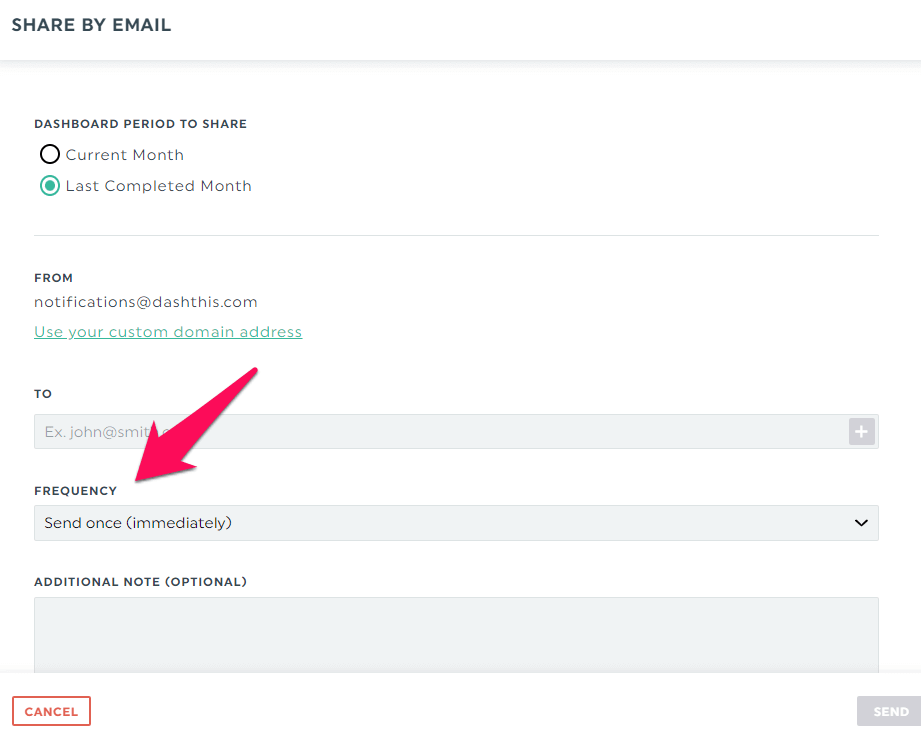
You can even schedule your report!
Now that you know how to track your KPIs and automate your reporting, let’s look at some of the KPI dashboards you can create on DashThis.
First up, we have the digital marketing report. Get a load of these digital marketing KPIs that give you an overview of the traffic, SEO, and PPC performance.
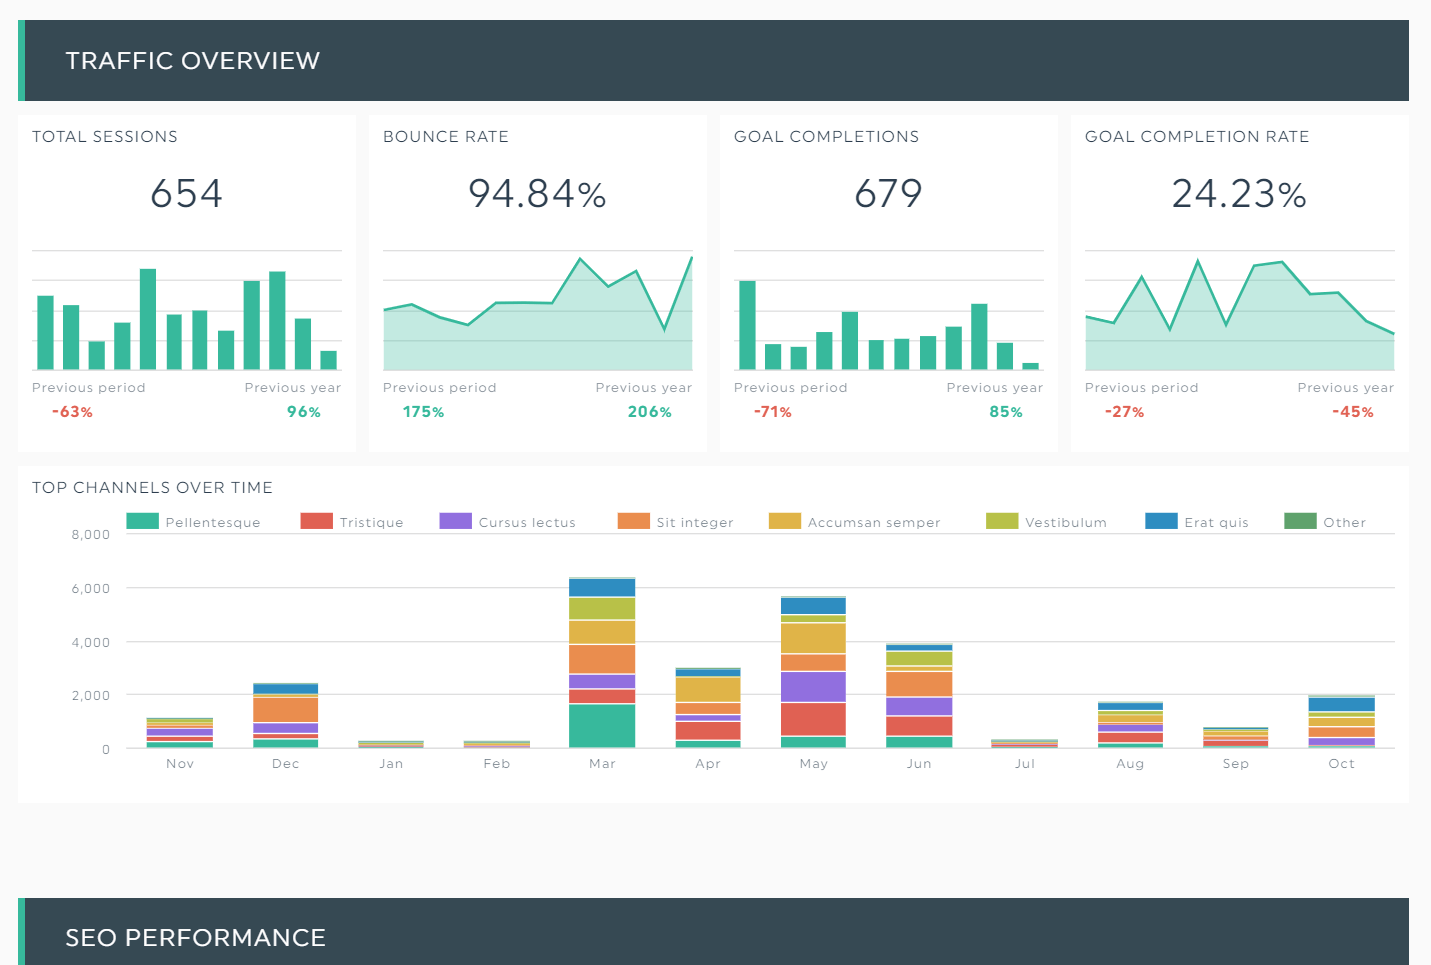
Grab this digital marketing report with your own data!
Here’s another lead generation dashboard template. This time around, it’s an email analytics report that shows how engaged email subscribers are with your email newsletters.
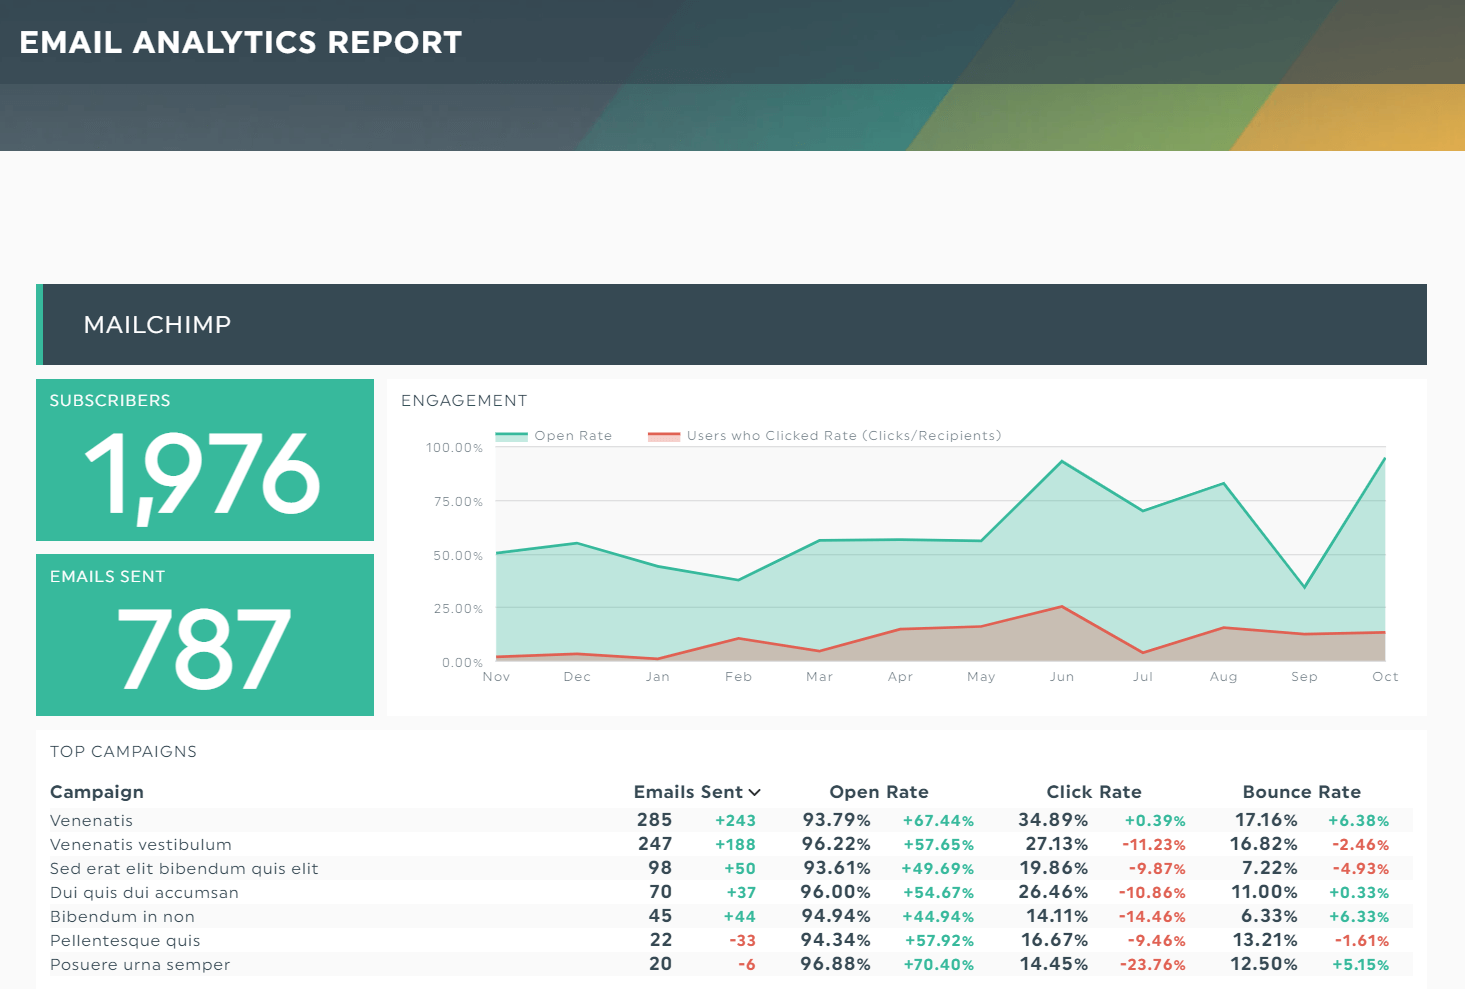
Grab this email analytics report with your own data!
And finally (for now!), we have the ecommerce report. As you scroll down, you can see how the lead generation KPIs brought about these sales.
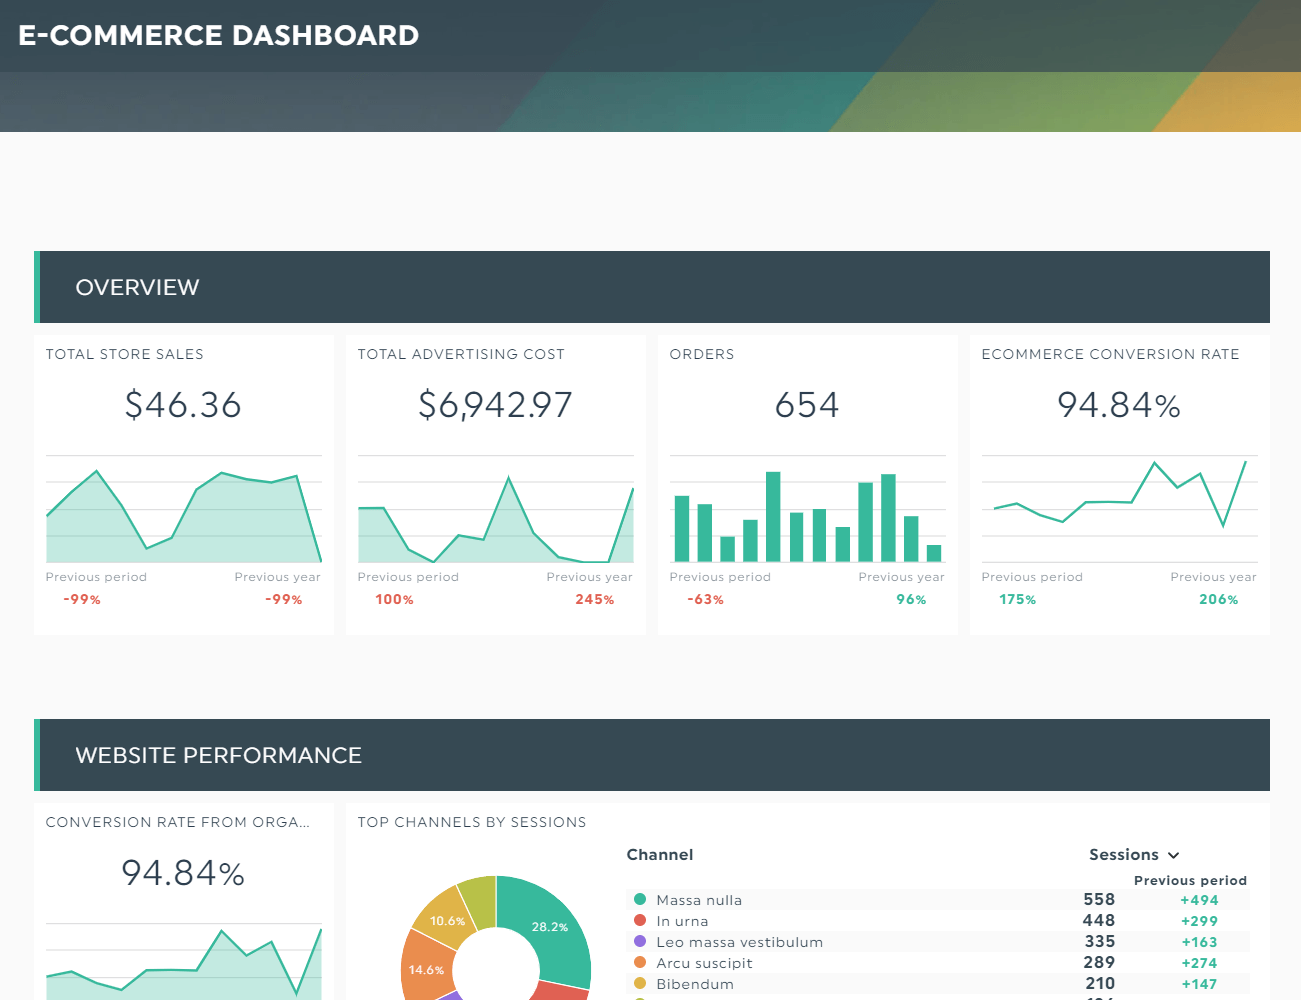
Grab this ecommerce report with your own data!
These insights help make better-informed decisions in your lead generation strategy.
For example, top channels by session indicate which channels attract the most engaged traffic. With this info, you can modify your budget accordingly and focus more on cost-effective channels.
Track these lead generation KPIs on DashThis today!
It’s hard to categorize these KPIs in order of importance, as each plays a significant role in your lead generation efforts.
Now that you know which KPIs you should use to measure the success of your campaigns accurately, start your 15-day FREE trial with DashThis today.
Track and measure your lead gen KPIs automatically. Long gone are the days where you have to wade through hundreds of data and painstakingly pick out each metric across multiple tabs.
It’s time to take back your time from reporting.
Start your 15-day FREE trial today.

Ready to automate your reporting?
Read More

Don’t miss out!
Follow us on social media to stay tuned!
Automate your reports!
Bring all your marketing data into one automated report.
Try dashthis for free