There are a lot of options and functionalities to discover, but how about you start by creating your very first dashboard? That’s why you’re here, isn’t it? So let’s dash your data!
Before starting with the dashboard creator, make sure you’ve connected your data sources, so your report is full of meaningful numbers! You can learn here how to connect your data sources. Your data sources are already connected? Nice! You’re ready to create your first dashboard!
Let's start creating dashboards!
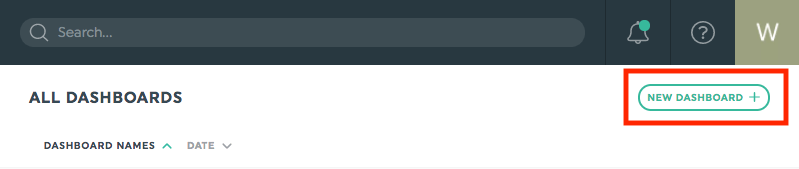
In the top-right corner of the screen, there is a button called New dashboard. Click it.
1 – Types of dashboards
The first step is to choose which type of dashboard or template you want.
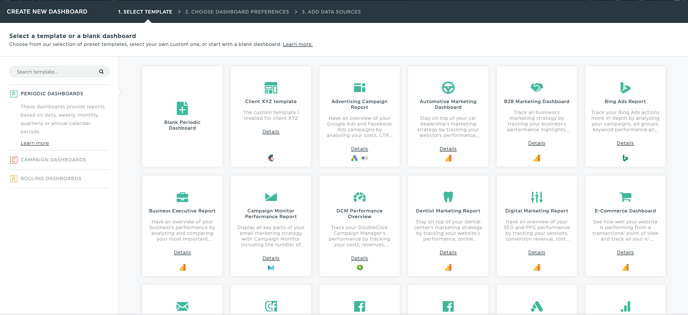
We offer three types; these should cover all your needs:
- The periodic dashboard follows the standard calendar periods (daily, weekly, monthly, quarterly, and annually). It also allows you to browse through past periods.
- The rolling dashboard is designed to track your performance on an ongoing basis. This dashboard takes the present day as a starting point and displays data over a particular period of time (last 7, 15, and 30 days for example).
- The campaign dashboard shows the performance of an advertising campaign with flexible dates. If you want, you can also compare your current campaign to a previous one (of the same duration).
If you want, you can choose one of our preset templates designed by our experts. You can also start from scratch and choose a blank dashboard, your choice!
Click on the dashboard or template you want to use.
2 – Period, language, and currency
Once you’ve chosen your dashboard type, you can set your dashboard preferences!
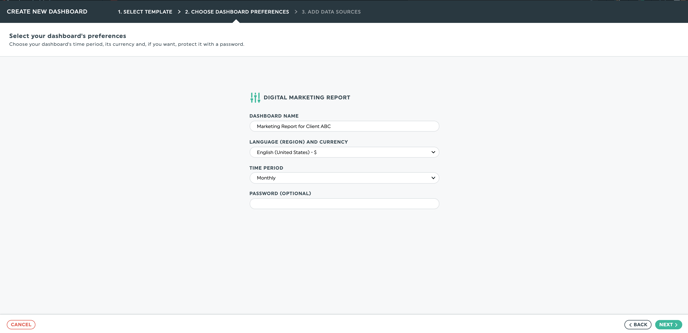
You can choose your dashboard’s name, time period, language, and currency.
The time period is the length of time shown in your dashboard. Depending on the type of dashboard you’ve chosen, your time period options will be different.
You can then choose the language according to your selected region.
Please note the language you choose won’t apply to the entire dashboard.
In the Editor mode, the Previous period and the Previous year buttons in each widget, as well as the menu in the top right corner of the widgets, will be in the language you’ve selected. The titles of the dashboard, widgets, and headers automatically appear in English, but these fields are fully editable. Just click on the field you want to change and write the title you need.
In the Viewer, the periods will appear in the language you’ve selected and following the format of the region.
If you want to have a complete translation, contact us!
The currency will be determined depending on the language and region you’ve chosen.
You can also include a password in order to protect your dashboard.
3 – Data sources
The next step is to connect your integration(s).
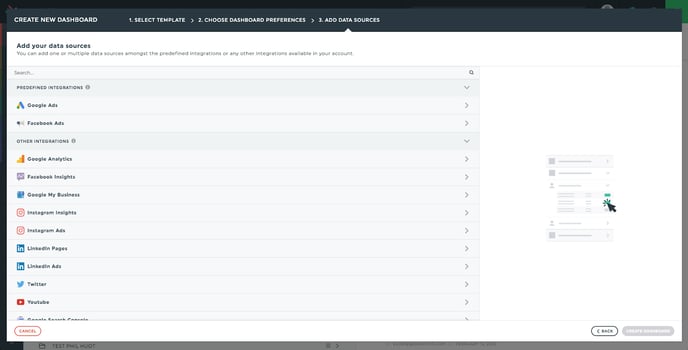
Simply connect all the integrations and data sources you want to add to your dashboard. You can use the search bar to find your data sources either by the name of the integration, name of your source, or even its ID.
If you selected a template, you can choose to connect one or multiple integrations from the ones available in the template (predefined integrations), you can also add new integrations that are already connected in your account (other integrations), or connect new integrations.
Now all you have to do is click "create dashboard" and you're all done!
If you’ve chosen a preset template, your dashboard will appear.
If you’ve chosen an empty dashboard, your next step is to add your first widget!
Have fun!
Go back to your account, and create your first dashboard!