The Pie widget in DashThis is the most versatile widget since it allows you to customize its layout in order to show your data from all different views.
So you’ve looked over our “Which types of widgets should you choose” article, and you’ve decided that the pie, list, or bar chart is the one for you? Great!
Here's how you can build a Pie/List widget and benefit from all its layout options.
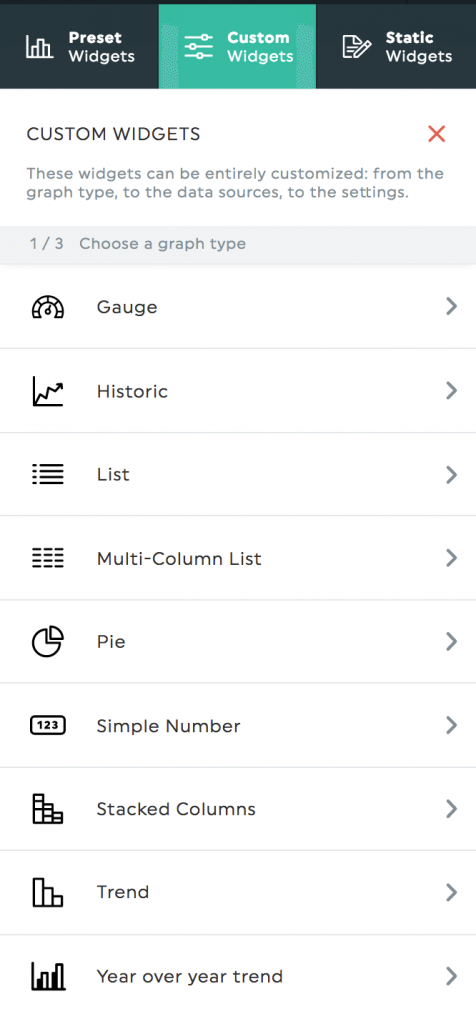
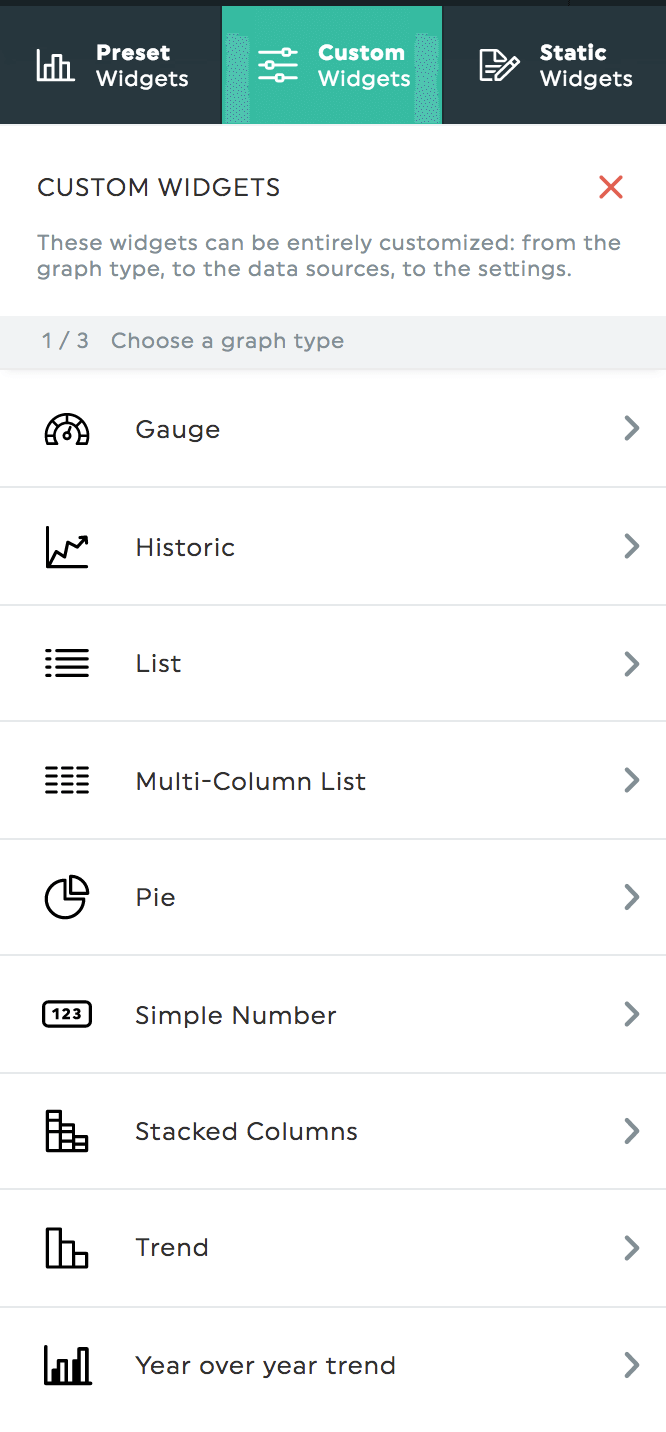
- Open the Custom Widgets panel
- Choose the Pie or the List widget. They actually result in the same widget frame.
- Create your widget by choosing the metric and dimension.
- Once created, open the "Edit Widget" panel.
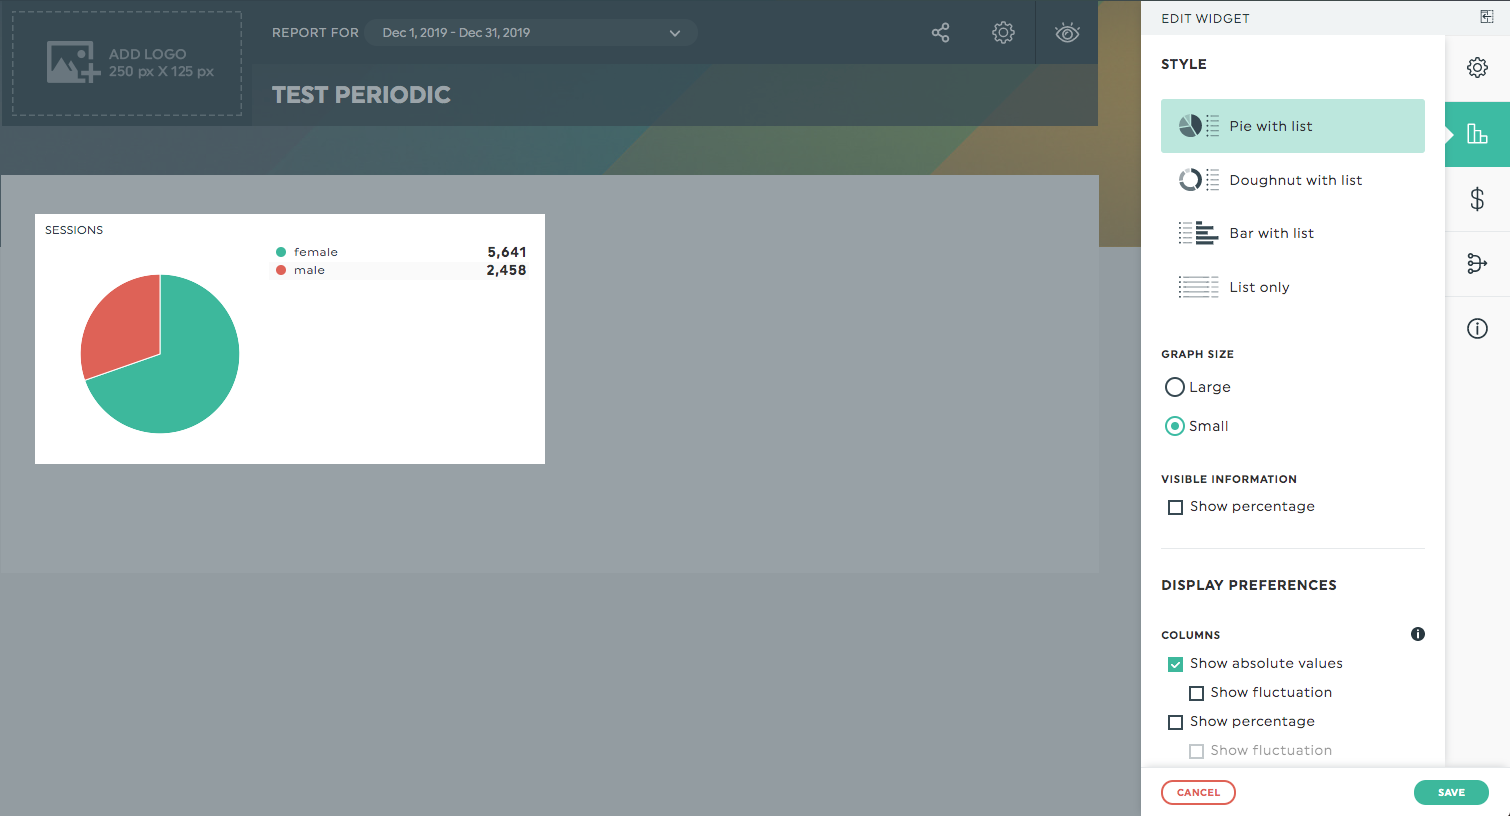
This is where the magic happens!
- You can transform the layout of your widget into a Pie, a Doughnut, a Bar with a List, or only a List ; and you can change the size of the associated graph.
- You can display the percentage numbers on the graph if applicable.
- When it comes to the List displayed to the right side, you can add fluctuation columns and choose the period you want to compare your data to (previous period or previous year). You can also rearrange the order of your widget, either by alphabetical order or by value.
In the end, you can easily get a customized widget by creating many variations of a widget in the same.