Customer Insights AI for Better Marketing Decisions

How do you find out what your client’s customers think about your business and marketing efforts?
Short of sitting down for a coffee chat, the best way to understand them is through the data they leave behind. Every click, page visit, and customer engagement metric reveals their interests and buying intent
All these digital fingerprints produce lots of user behavior data. You're probably wondering, how do you track it and pull out the data-driven insights that sharpen your marketing? That's where customer insights AI comes in.
FullStory reports that 87% of companies collect customer data, but only 25% say they use it well. If you can turn raw numbers into clear, useful takeaways, you'll be in the top quarter—ahead of 75% of businesses.
These are the use cases for artificial intelligence and machine learning technologies to streamline tedious work so you can focus on the parts of your data that matter. You’ll learn a clear, repeatable way to analyze your data and pull out customer findings you can use to improve your marketing strategies and support decision-making.
Table of contents
- What are customer insights (and why they matter)
- How using AI technologies to understand your customers can help your business.
- How to Track Customer Insight KPIs with DashThis
- Translate your KPIs into actionable insights with AI
What are customer insights (and why they matter)
Customer insights are what we learn from data about how people act and how they make and why they choose what they do.
This applies to both real-world qualitative data, like sentiment analysis on call logs and support tickets, and quantitative data like engagement metrics from the sales process. Here, we’ll focus on quantitative data and how to draw customer insights from your marketing data.
Using customer insights, you’ll be able to answer digital marketing questions like:
- What does the higher engagement time on our product pages from LinkedIn campaign visitors mean for our ability to meet customer needs through our copy?
- An email A/B test that included customer testimonials drove 40% more conversions. How can we apply this insight across other customer journey touchpoints?
- Is there an emerging trend in our recent customer interactions that we can use to personalize our marketing workflows towards a specific customer segment?
OK, but where does generative AI fit into this?
As Katie Robbert, CEO of Trust Insights, says on the Marketing Over Coffee podcast, the biggest problem with most data set analysis is that it doesn’t answer the “so what” question by giving the next steps people can act on. She says, "I get really frustrated when people talk about something and then don't tell me what to do about it.
Tools that analyze customer data solve this. Instead of staring at marketing reports and guessing, they find patterns, explain what's happening, and suggest next steps. You're moving from tracking data to understanding it to make informed decisions.
Here's how it works:
Say you're analyzing social media results and you see LinkedIn brings in leads who spend three times longer on product pages. The AI flags the pattern and links it to people doing deeper research. It then recommends publishing detailed product pages and guides for these leads.
Bingo! You've just turned raw data into a defined action plan.
How using AI technologies to understand your customers can help your business.
By analyzing customer behavior and using AI to streamline data analysis, you can spot patterns and improve your marketing performance.
Identify conversion barriers
Let's say you've spent days refining your landing page. You've tried all the usual conversion tactics. The headline is clear and the CTA stands out. Still, your Google Ads traffic isn't converting.
It’s a frustrating experience. But it doesn’t have to be this way.
Instead of guessing what's wrong, AI might flag that Google Ads traffic has 60% lower form completion than other channels, yet its click-through rate is 40% higher.
Why, do you ask? Further checks might reveal that the landing page was solid, but the Google Ads copy wasn't updated to match.
Manually analyzing this means switching between tools and testing scenarios one by one, checking for ad-to-page mismatches, slow load times, form friction, and mobile glitches. You won’t know what’s wrong until you run the tests.
What if you could skip straight to the answer? That's where AI-powered analysis comes in. It works across all your marketing metrics, spotting patterns you might miss and cutting down guesswork. With revenue growth still a top priority for CMOs in 2026, quickly identify conversion blockers and report them to your client or marketing team.
AI helps you detect performance issues early. By spotting them and taking action early, its easier to stay ahead, keep clients informed about campaign issues, and show you own your campaign, which clients appreciate.
Identify opportunities for campaign optimization
Beyond spotting roadblocks, AI can also help you optimize your campaign performance.
For instance, DashThis's Opportunity lens might flag that your Pinterest campaigns have a 40% higher conversion rate than other channels, suggesting an opportunity to reallocate budget. Your judgment still matters. AI can spot patterns, but you choose if Pinterest fits your client's quarterly goals and brand, given the budget.
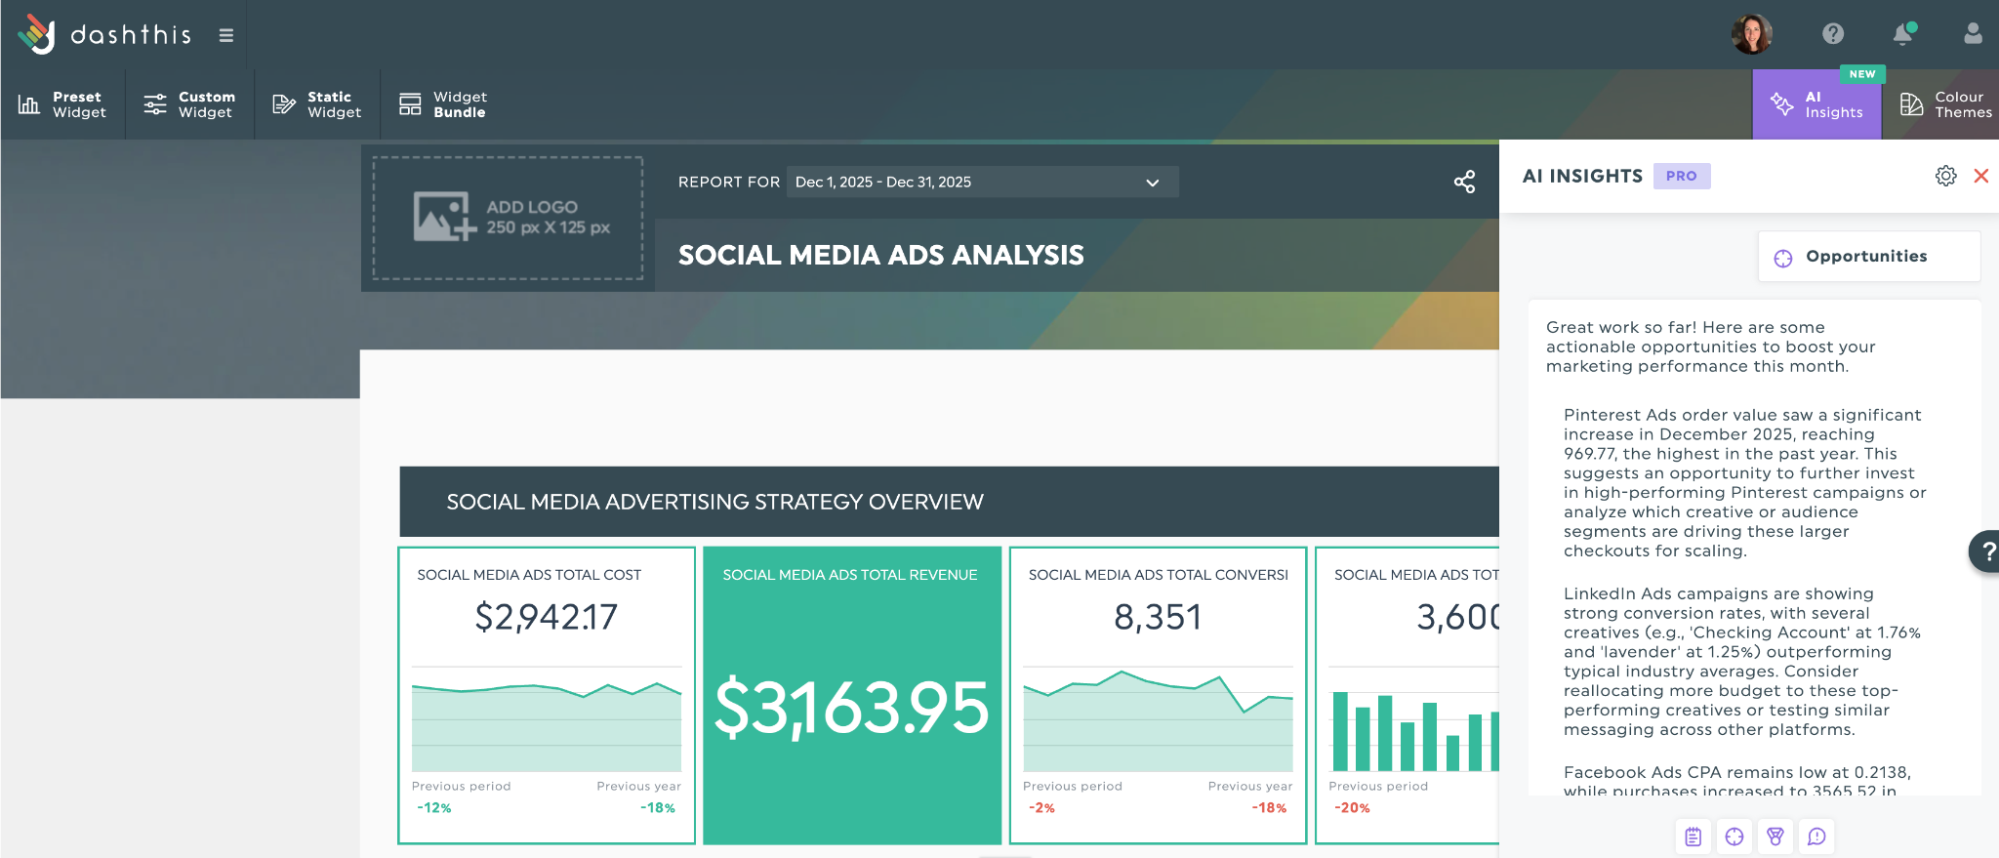
Get these AI insights with your own data!
This is AI at its best. It surfaces opportunities you’d likely miss by hand, and you bring the strategic judgment to act on them wisely. Apply the same method across all your channels at once and you’ll spend less time hunting for subtle links in the data, freeing you to decide whether they matter to your client and what to tackle next.
Find omnichannel insights
Different channels attract different customer behaviors, and understanding these patterns helps you allocate budget more effectively while delivering more personalized customer experiences.
AI models automatically compare results across channels and spot important behavior differences you might miss.
Returning to the previous LinkedIn campaign example, an AI tool might suggest increasing LinkedIn ad spend and publishing more targeted product content to guide high-quality leads through their decision-making, rather than putting more budget into Facebook as the main ad channel.
Without AI-driven analysis, you'd need to manually export data from multiple platforms, cross-reference engagement metrics in real-time, and calculate averages yourself On top of that, you’ll still have to figure out what it means and how to explain it to your client.
Even if you’re a seasoned data analyst, there’s a likely better use of your time.
How to Track Customer Insight KPIs with DashThis
How do you put this into practice? Follow these steps.
Step 1: Identify relevant customer KPIs
Start with a clear business objective
Before reviewing metrics, ask yourself: What specific question am I trying to answer about my customers?
Your KPIs work best when they connect directly to one of these business questions.
| Objective | Key question | Top 3 KPIs to track |
|---|---|---|
| Acquisition | How do we attract customers? | Customer acquisition cost (CAC) Landing page conversion rate Lead-to-customer conversion rate |
| Engagement | How do customers interact with our content? | Session duration Email and ad click-through rate |
| Retention | Are customers coming back? | Customer retention rate (CRR) Customer churn rate Repeat purchase rate |
| Satisfaction | How happy are customers? | Net Promoter Score (NPS) Customer Satisfaction Score (CSAT) Support ticket resolution time |
| Revenue | What’s each customer worth? | Customer Lifetime Value (CLV) Average Order Value (AOV) CLV:CAC ratio |
It’s tempting to stop here. But, also consider who will use this dashboard and tailor it to their needs so the content stays relevant for your clients. Some examples include:
- Marketing teams: channel-specific performance
- Sales team: focus on lead quality and sales pipeline health
- Executive team: key trends in revenue and growth
- Customer operations team: metrics like customer satisfaction score and ticket resolution time.
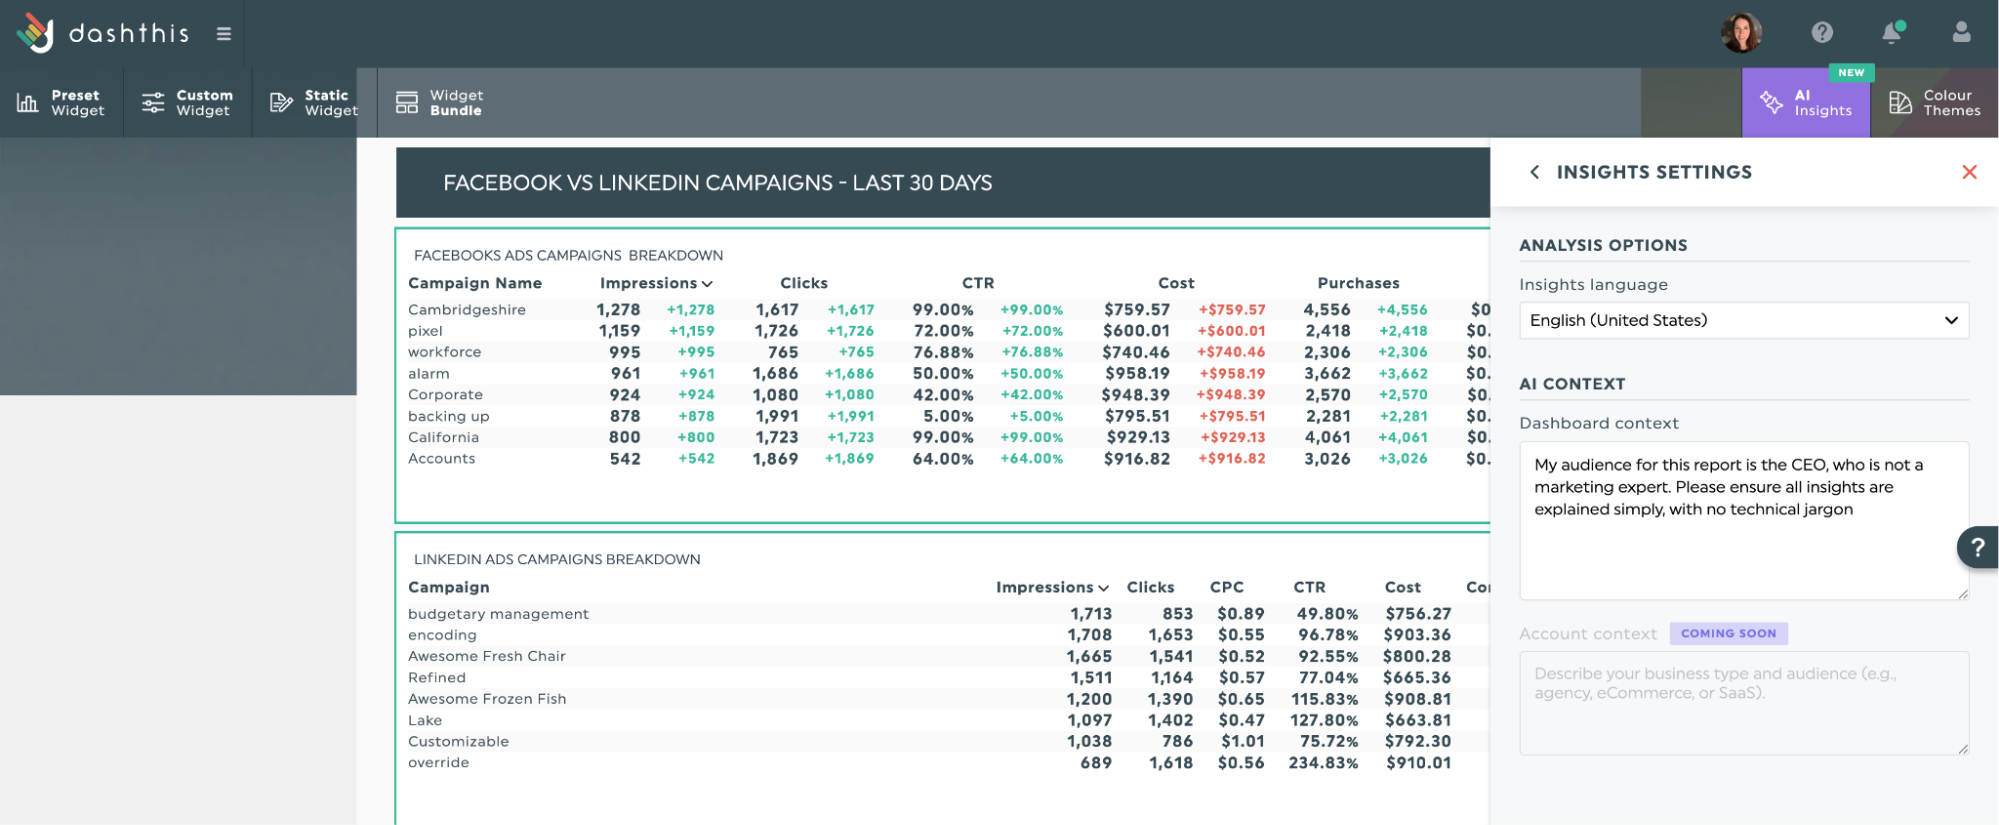
DashThis’s AI tailors insights in your dashboard to your specific needs. With AI Insights Pro, you can describe your audience and what they care about, and that information shapes the analysis. This helps produce clear takeaways for non-technical readers.
Step 2: Consolidate data across marketing channels
With a clear objective marked out, it’s time to consolidate your data across your marketing channels. Normally, you’ll import your data manually by exporting from each platform and checking that everything matches. But with a reporting tool like DashThis, you can import data straight from your marketing tools into your dashboard in minutes.
Getting your data into DashThis is easy with report automation. Connect your marketing tools once and approve access; your metrics will appear in ready-to-present dashboards automatically. Have data stuck in a custom CRM or a tool we don't integrate with yet? Just upload it as a CSV file and you're good to go.
Step 3: Build a dashboard to visualize performance
Now that you've identified your relevant KPIs and who needs to see them, it's time to visualize that data in a way that drives action.
Most dashboards become ineffective when they turn into data dumps. Stats back this up. In a 2025 survey of SaaS users and product management teams by product analytics platform Luzmo, 40% said dashboards don’t help them make better data-driven decisions, and 43% bypass them to analyze data elsewhere, often in spreadsheets.
Which makes sense. When you're tracking 30+ data points, none of them stand out, and your team stops checking the dashboard altogether.
So how do you make a useful dashboard? Start with a focused set of KPIs that tie to your goal and your audience's needs. This way, every metric has a clear job, so decisions come easier.
DashThis makes this step simpler. Instead of building a dashboard from scratch, start with one of our 50+ reporting templates with KPIs grouped by objective. Each template keeps your dashboard focused on the metrics that matter, so you don't keep adding "just one more metric" and overcrowd it.
Our PPC reporting template lets you visualize performance by showing Google Ads metrics next to Bing Ads data and landing page results:
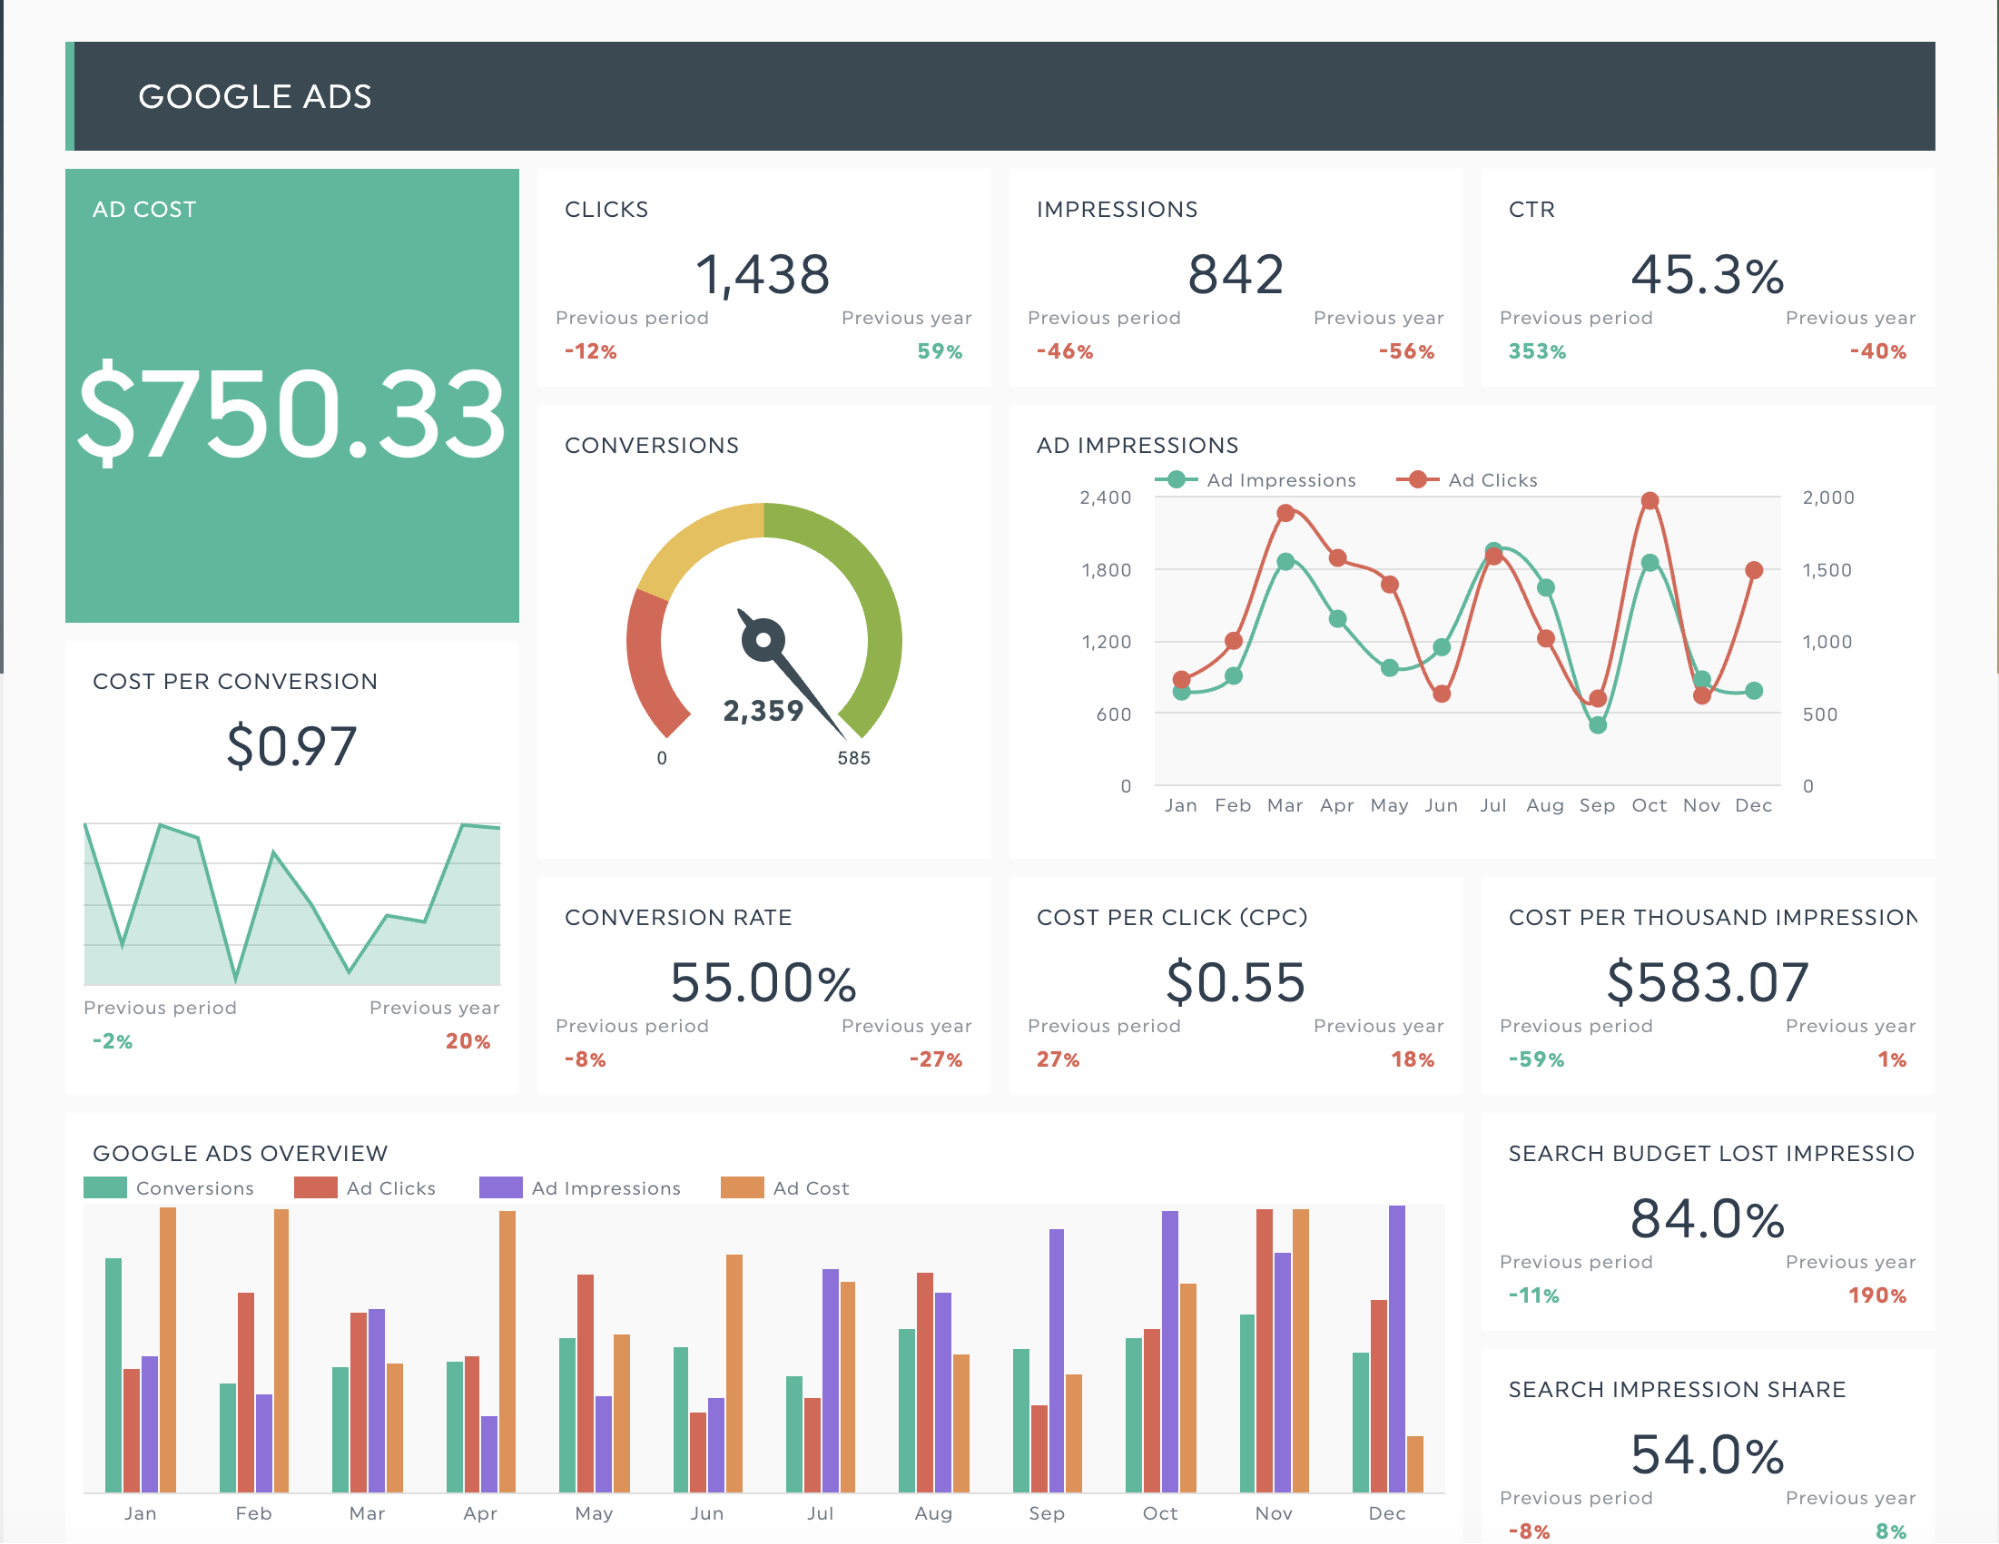
Get this PPC reporting template with your own data!
Step 4: Use AI Insights to automatically analyze your data
With your dashboard built and data flowing, it’s time to find useful patterns with AI. You don’t need to export and upload anything to other AI platforms like ChatGPT or Claude; DashThis has AI built in to surface findings and explain your data, right inside your dashboard.
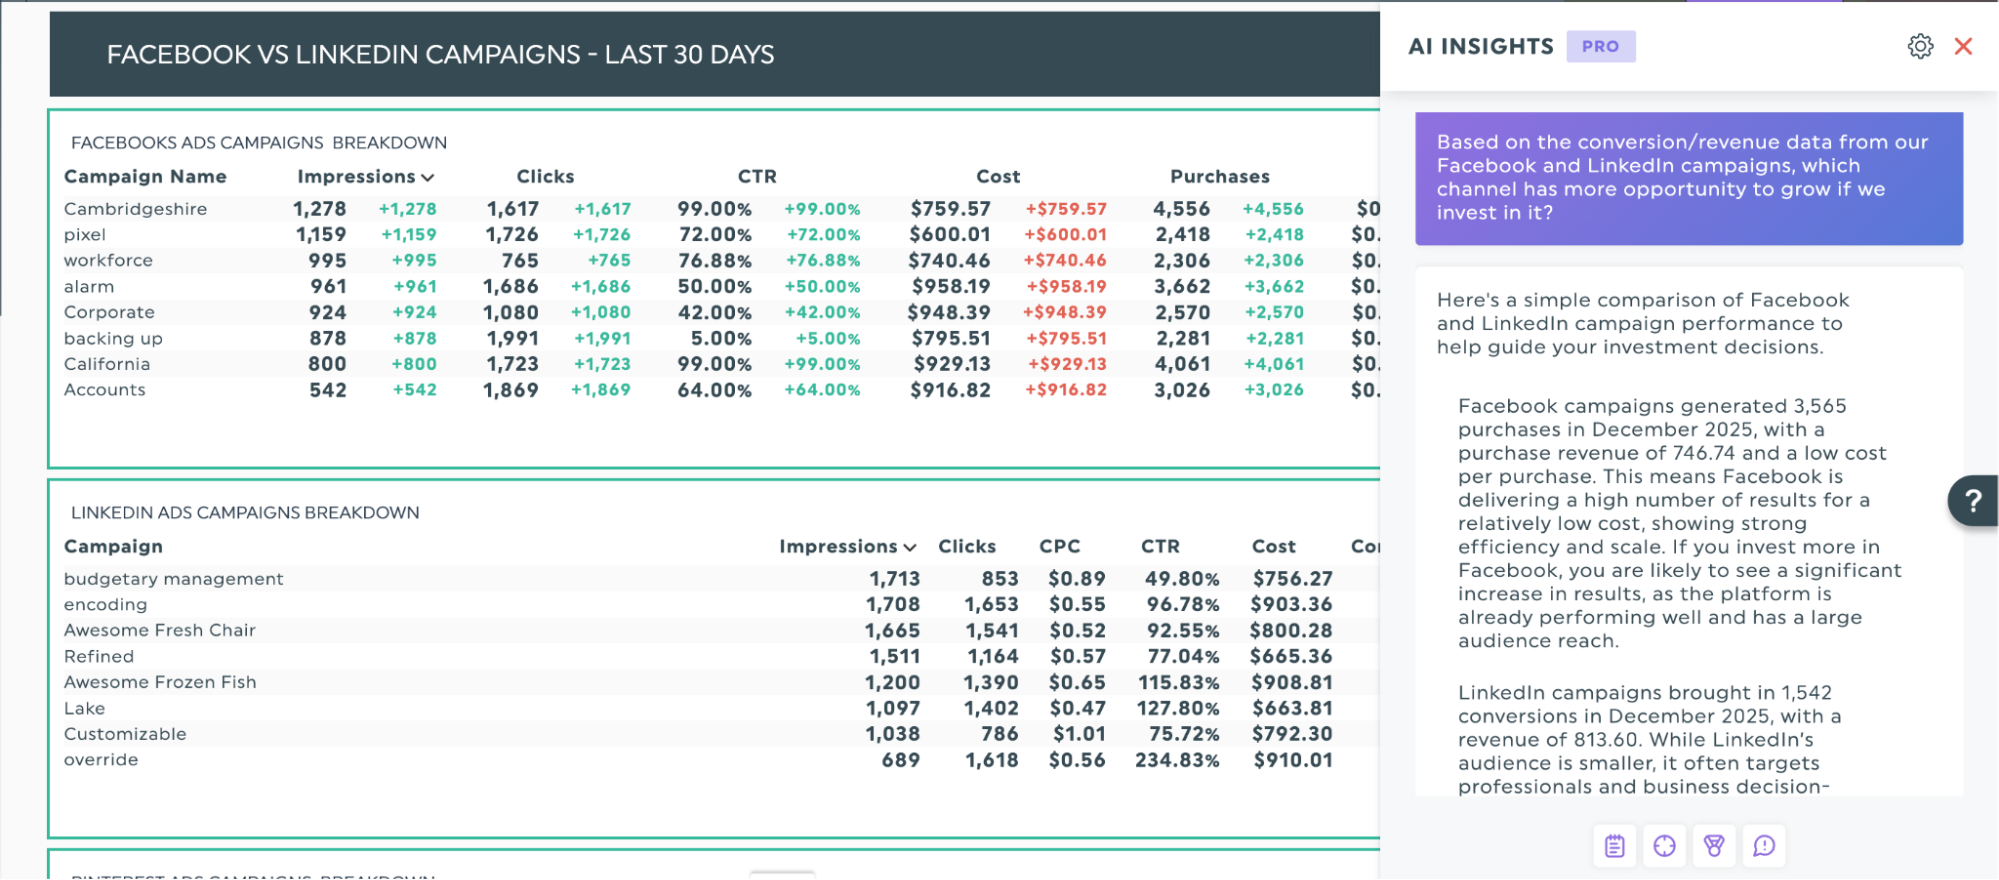
With DashThis’s AI chat interface (available to Pro subscribers), you can ask a question in plain language and get a clear answer instantly, instead of sifting through data for a specific query. This lets you explore your data freely and focus on the questions that matter most.
Let’s say you’re comparing conversion data from Facebook ads and LinkedIn campaigns. Our AI can give practical guidance on a single point of comparison, like conversion and revenue data for specific channels.
With the free version, DashThis AI gives you four ways to analyze your data and jump-start your analysis.
- Summarize your data
- Find the best opportunities
- Identify issues to prioritize
- Highlight wins to celebrate with your client
Step 5: Take action on your findings
This step turns the customer insights you’ve uncovered into practical takeaways. Sounds complicated? Let’s break it down.
Analyzing data involves a few key steps:
- Finding out what happened
- Understanding why it happened,
- Deciding what to do next.
Yes, this applies to wins and setbacks alike. For a win, break it down to see what you can repeat in future campaigns and keep the momentum. For a miss, figure out why, fix it fast, explain what happened, and reassure your client that you’ve got it under control.
Here’s a concrete case. Suppose you run a paid ads agency reporting on your channel strategy. Purchases attributed to Facebook and LinkedIn have dropped, and you want to find out why.
You might break it down and communicate it in your client report like this:
What happened?
LinkedIn ad conversions dropped 35% and Facebook conversions fell 22% over 30 days, despite consistent spend.
Why did this change?
We identified two key factors:
- We expanded to broad targeting in Facebook in mid-November to test new audiences. Reach increased 40%, but these audiences converted 20% less than our previous segments.
- LinkedIn is prioritizing video, cutting visibility of our static ads by 30%.
Your landing page conversion rate held steady at 4.2%. The issue is with ad targeting and creative format, not the landing page people see when they click through.
What will we do?
We recommend these steps to reach 90% of baseline conversions by Q1 2026.
- Return to proven audience segments on Facebook
- Create 3 video ad variations for LinkedIn within 2 weeks
- A/B test pain point vs. benefit-focused ad copy
Translate your KPIs into actionable insights with AI
Customer insights drive growth, and you shouldn’t need hours of manual analysis to understand them. AI tools quickly make sense of the data and point clients to clear next steps.
DashThis helps marketers track results and take action in one place. Connect your data sources, let AI flag what matters, and spend less time in spreadsheets so you can focus on improving campaigns.
Choose DashThis to turn your KPIs into useful customer insights with AI, Start a free 14-day trial today.

Try our new AI insights PRO today!
Read More

Don’t miss out!
Follow us on social media to stay tuned!
Automate your reports!
Bring all your marketing data into one automated report.
Try dashthis for free