GA4 User Types: New, Returning, Total & Active Users in GA4

If you still struggle with getting your head around Google Analytics 4 (GA4), you’re not alone.
GA4 is downright confusing.
This new generation of Analytics—thanks to its new event-based data model—requires a shift in how we measure site activity.
And it starts with knowing the different user types. Once you figure this out, you’re a step closer to:
- Understanding the impact of your campaigns across multiple channels in the customer journey,
- Allocating your marketing spend with zero guesswork, and
- Making informed decisions to acquire, convert, and retain your target audience
While mastering GA4 requires months of practice, this guide will give you the foundation you need to start making sense of your user data today.
To make it easier for you, we included a free GA4 report template with premade user metrics at the end of this post. Grab it if you don’t want to create your reports from scratch.
- GA4 User Types Explained
- Analyzing User Types in GA4
- Visualizing GA4 User Type Data on DashThis
- Using GA4 User Type Insights to Drive Marketing Decisions
- Automate Your GA4 Reports Today
GA4 User Types Explained
This section breaks down each user type: active, new, returning, and total users.
Here’s the lowdown:
Active Users
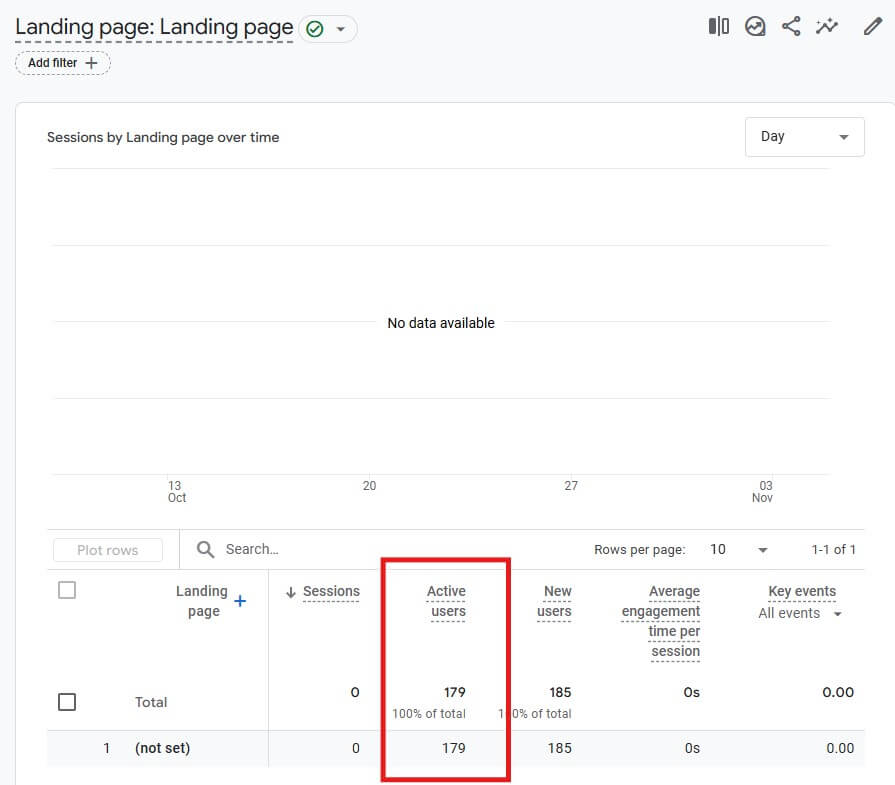
WHAT IT IS:
Number of users who visited more than one page, converted, or had an engaged session on your website or app (10 seconds is the default).
Users are active as soon as GA4 collects the user_engagement event. For example:
- first_visit event or engagement_time_msec parameter (website)
- first_open event or engagement_time_msec parameter (Android app)
- first_open or user_engagement event (iOS app)
Active users also include new users.
GA4 considers active users as its primary user metric. This metric is located in multiple reports, including Traffic acquisition (under Acquisition) and Landing page (under Engagement).
WHY MEASURE IT:
- Monitor active engagement over time
- Track how different marketing initiatives impact user engagement
New Users
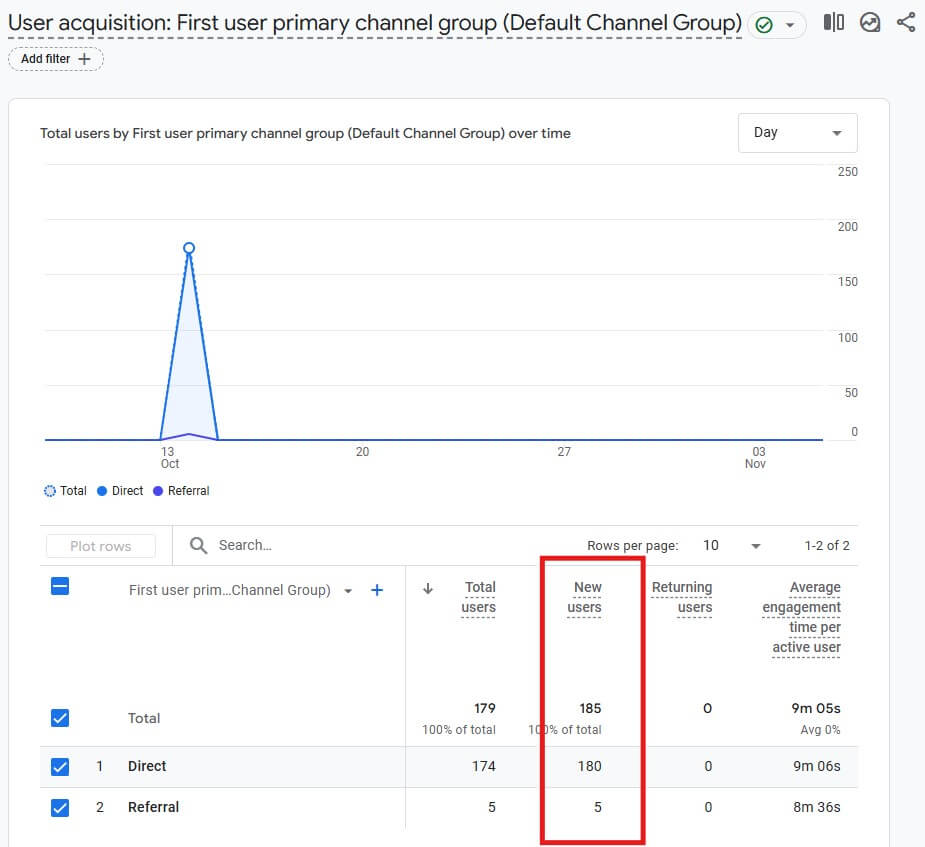
WHAT IT IS:
Number of new unique users who have never visited your website or app before. Besides their unique user ID, they’re also identified by the:
- first_open event (app)
- first_visit event (website)
To locate the new users metric in GA4, click User acquisition (nestled under Acquisition).
WHY MEASURE IT:
- Understand how new users discover your business from a channel and content standpoint
- Track if your lead generation efforts attract the right target audience
Returning Users
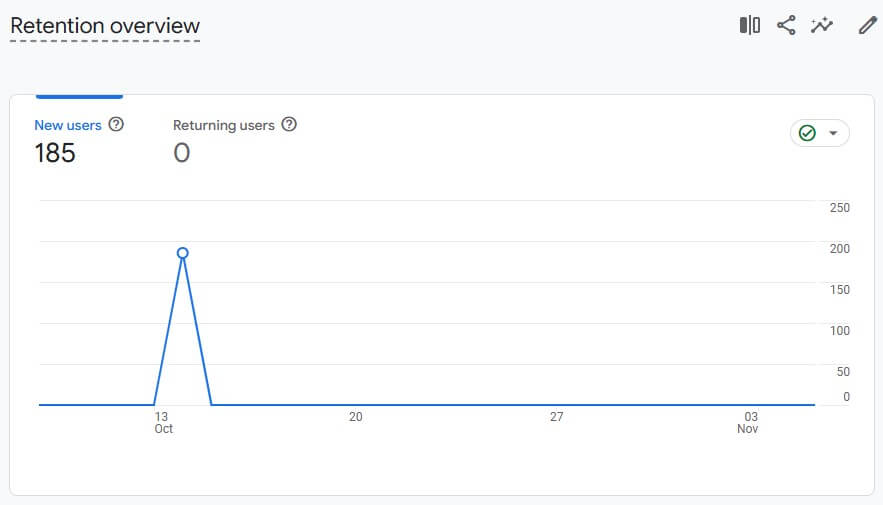
WHAT IT IS:
Number of users returning to your site or app after their first visit. This metric is in the Retention report.
WHY MEASURE IT:
- Track content stickiness to identify which content themes bring users back
- Spot patterns in returning users and improve retargeting
- Track top of mind awareness (TOMA) to improve brand recall and build customer loyalty.
Total Users
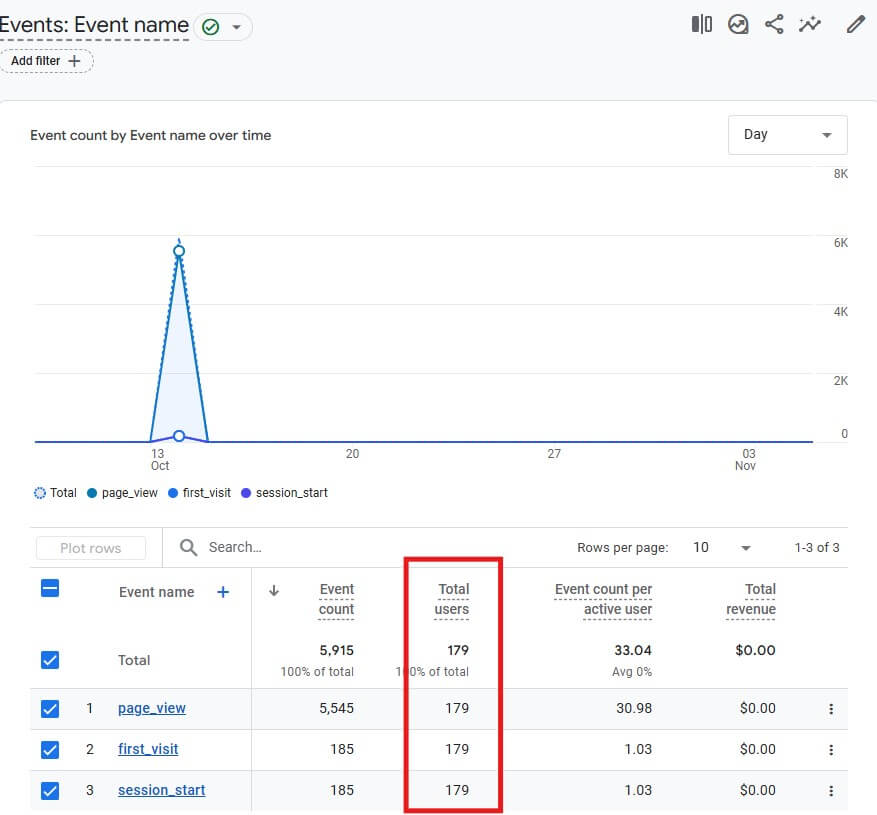
WHAT IT IS:
Total number of users who visited your website or app and triggered any event (e.g., watch a video) in a specific time frame.
This metric includes all users, including visitors who bounced within seconds. To locate this metric, click Events (under Engagement).
WHY MEASURE IT:
- Evaluate overall audience size and growth
- Stack up total users across different time periods (i.e., benchmark performance)
Analyzing User Types in GA4
Now that you understand the different user types available, which reports should you focus on to turn them into actionable marketing decisions?
Here’s our recommendation:
User and traffic acquisition

LOCATED:
Reports > Acquisition > User acquisition / Traffic acquisition
WHY IT MATTERS:
Universal Analytics couldn’t efficiently track users across devices and channels, leading to double-tracked metrics.
Fortunately, GA4 fares better.
This new generation of Analytics boasts enhanced cross-device tracking that provides a clearer picture of your acquisition channels.
Analyze the:
User acquisition report to identify and compare sources driving new users to your site or app. For example, examine average engagement time per active user between paid social users vs. organic social users to understand engagement levels between these two groups.
Traffic acquisition report to learn where new sessions come from. Understanding this will help you (re)engage new and returning users. For example, compare total revenue between paid social vs. organic social to see which attracts more paying customers.
METRICS EXAMPLES:
- Number of engaged sessions
- Number of new users by first user default channel group
- Number of sessions by Google Ads campaign
User demographics

LOCATED:
Reports > User > User attributes
WHY IT MATTERS:
GA4’s User demographics report shows users’ locations, including their country and city, and languages they speak. It also details their gender, interests, and age.
All valuable information for understanding customer segments, creating targeted content, and updating your buyer persona(s).
For example, a lead generation agency found that 80% of their traffic came from the US, but the highest conversions were from Estonia and Poland. This led to an adjustment in its account-based marketing strategy in the EU market.
METRICS EXAMPLES:
- Number of active users by country / city
- Number of new users by interests
- Engagement rate by country
User events

LOCATED:
Reports > Engagement > Events
WHY IT MATTERS:
User events show if your visitors are performing high-value actions.
For an eCommerce store, high-value actions are viewing products and adding them to carts. For a SaaS company, it’s starting a free trial or scheduling a demo.
In other words, this report helps identify potential friction points that impact revenue.
For instance, a high number of items added to cart but a low number of items checked out indicate a poor checkout experience. In the future, you could experiment with A/B testing to improve conversions, such as allowing guest checkout or adding trust badges.
METRICS EXAMPLES:
- Event count per active user
- Event count by event name over time
- Total revenue
After familiarizing yourself with these reports, continue to explore Pages and screen (to identify top-performing pages) and Retention (to track if your content resonates with users and compels them to come back).
Visualizing GA4 User Type Data on DashThis
It’s probably clear by now that creating a report with all these user metrics is a gigantic task.
Imagine the amount of raw data to grab manually across Acquisition, Engagement, Demographics, etc. *shudders*
Your time is better spent on billable work, like addressing client feedback and performing analysis. Consider delegating your manual reporting with the easiest Google Analytics 4 reporting tool, DashThis.
Here’s how it works:
- Connect your GA4 account with DashThis (note: all GA4 roles—including viewer and admin—will work)
- Select a GA4 report template
- Choose your GA4 metrics in Preset Widgets (or add multiple metrics in Widget Bundles)
Wait a few seconds while DashThis automatically gathers the metrics into your dashboard.
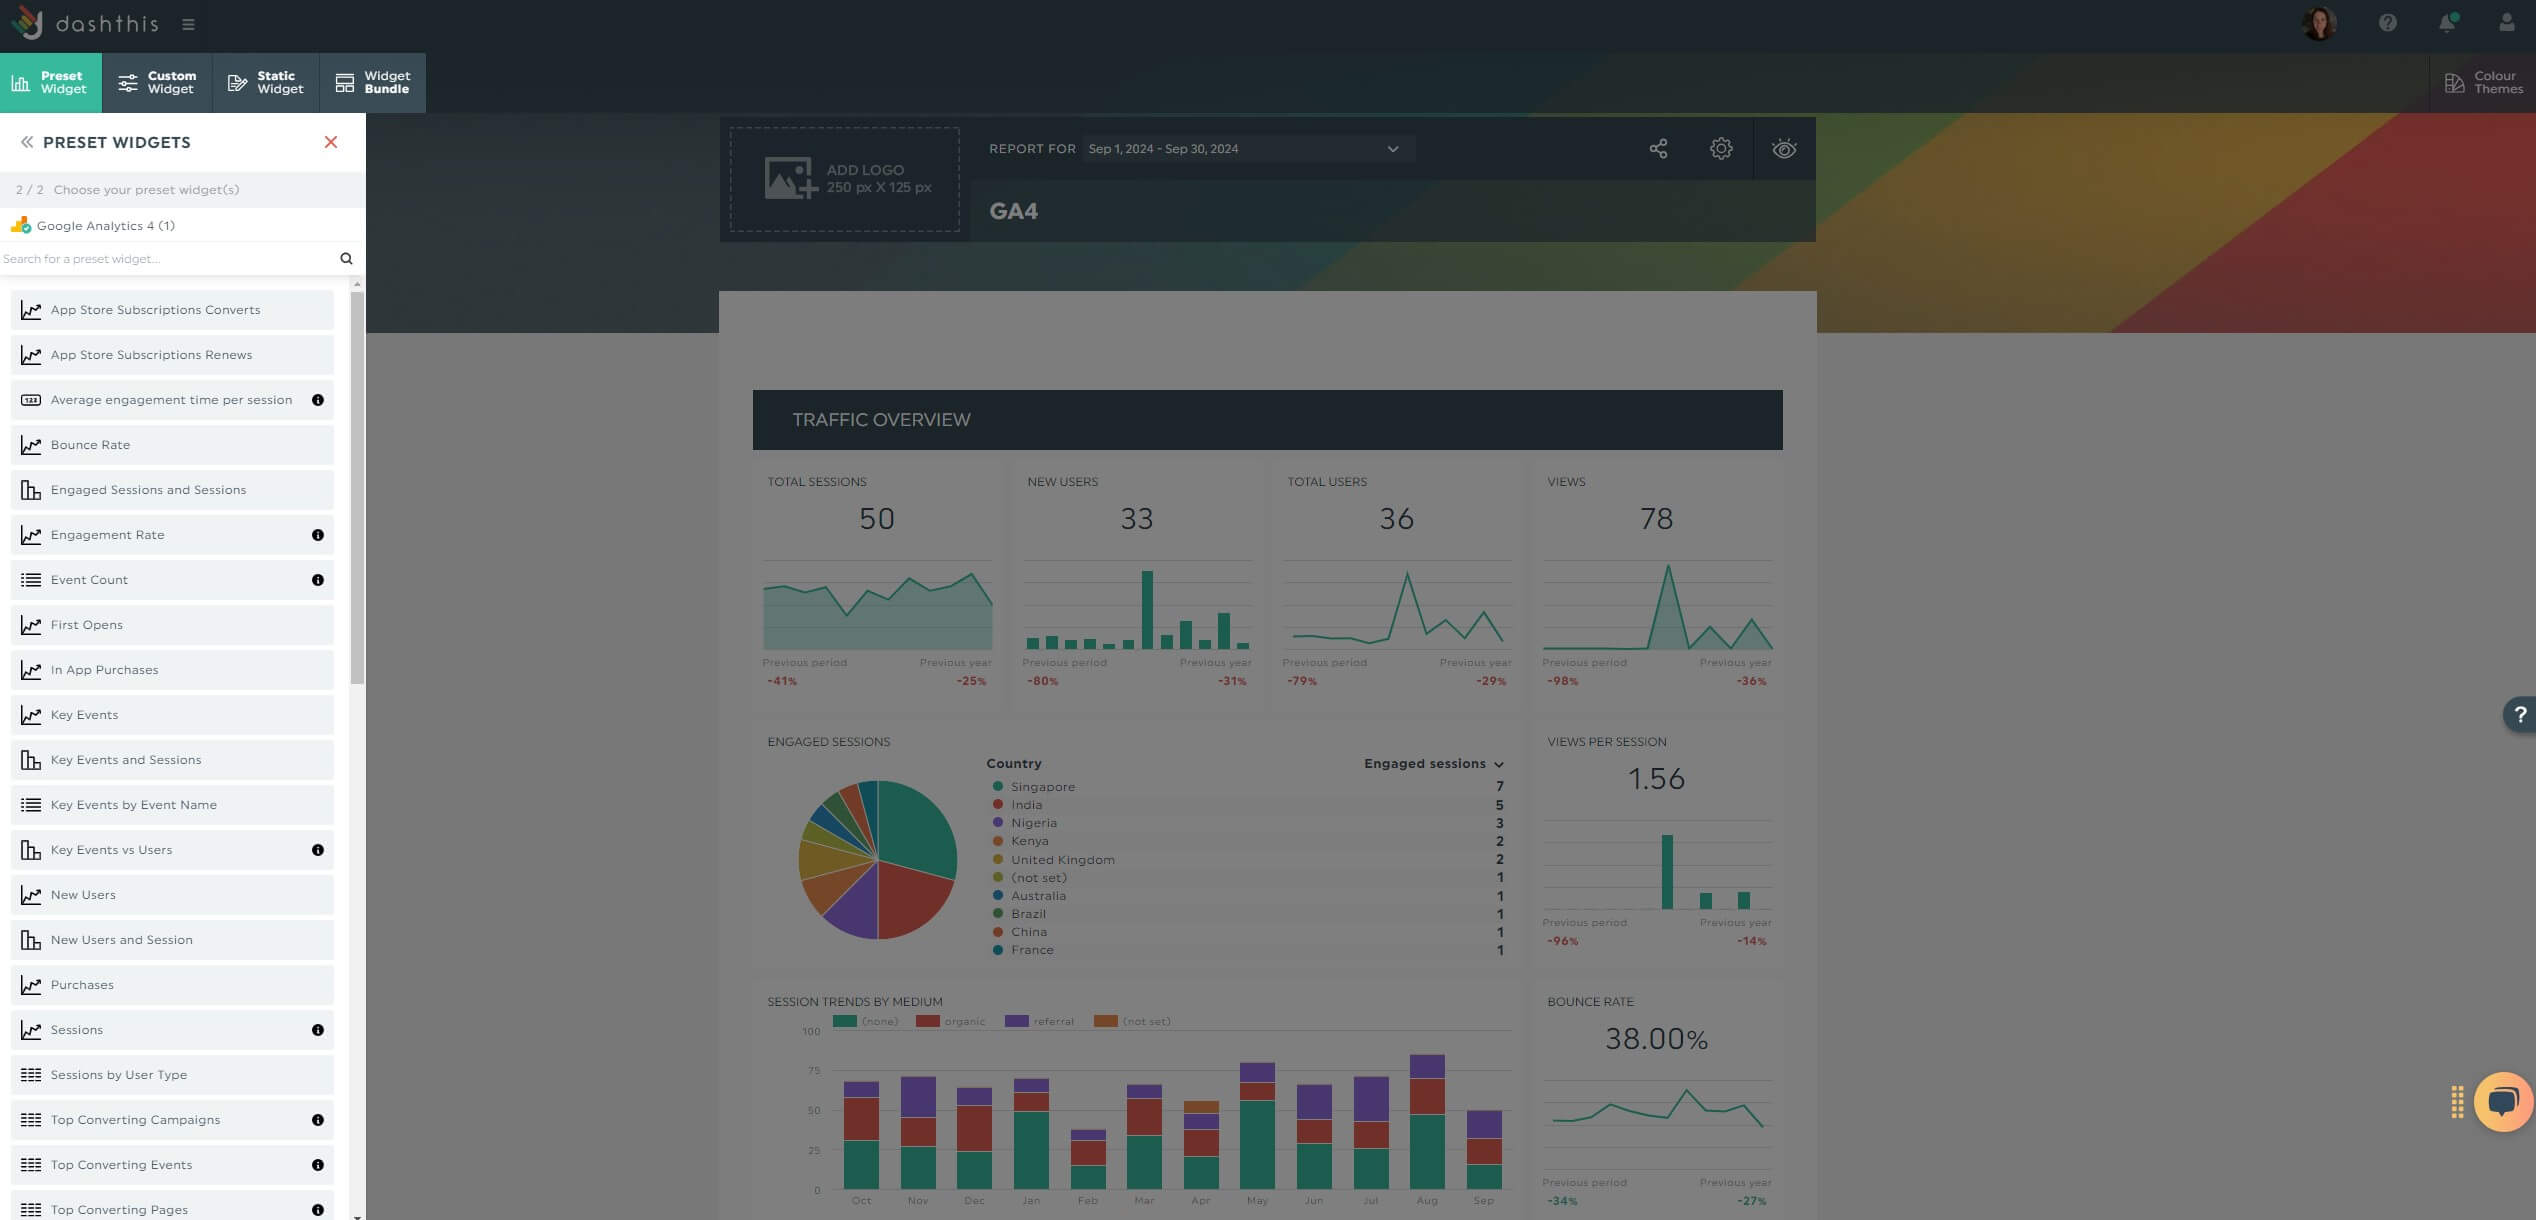
Drag and drop the metrics to illustrate the impact of your strategy.
For example, if you want to spotlight how recent website changes impact user engagement, group the monthly active users metric with bounce rate, page views, and views per session.
To show a specific campaign performance, group new users by source and the conversion rate by channel.
Our notes widget is handy for providing context directly in the report. Suppose you’ve collected additional customer feedback through exit-intent surveys.
Hover over a desired metric and click Add Note.
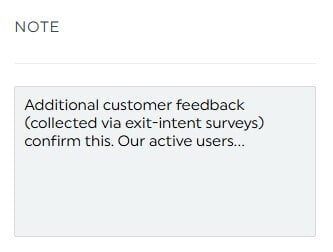
Our notes widget is also helpful for defining marketing acronyms (e.g., conversion rate, difference between user ID vs. client ID) for clients with little marketing expertise.
Include your findings and click Save.
Once you finish the report, configure an automatic email dispatch to all stakeholders:
- Hover over the Sharing Options icon in the top right
- Click Share by Email
- Set the dashboard period and frequency
- Add an optional note
- Click Schedule
Automatically send your report based on your preferred schedule.
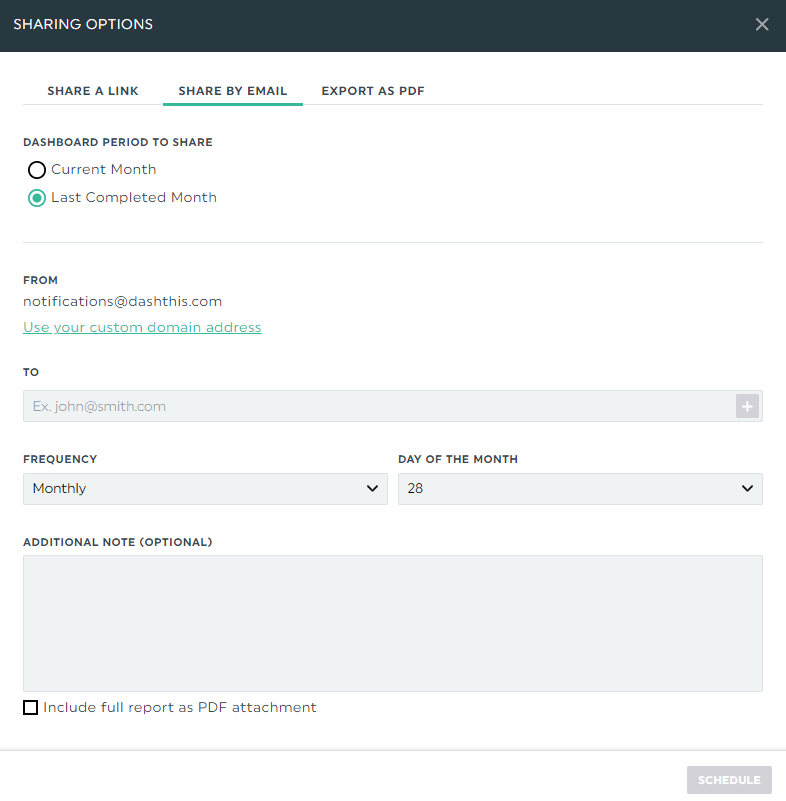
Stakeholders receiving this dispatch can view the report in real-time. To compare different periods, click the date range field and select accordingly.
DashThis is the easiest Google Analytics 4 reporting tool. Start your free 15-day trial today.
Grab your free GA4 report template
As a marketer, you’ll create GA4 reports to track traffic or understand content performance. This free template does both. Notice how easier it is to understand your user activity across the entire journey.
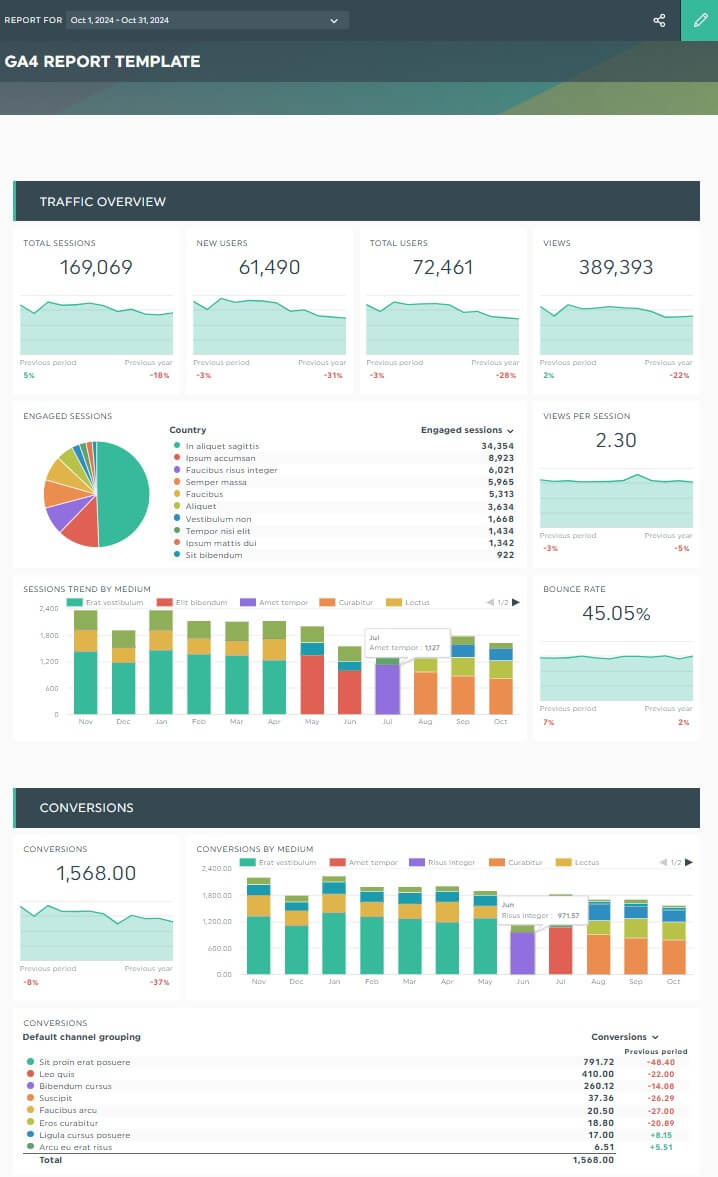
Grab this free GA4 report template with your own data!
Last Notes: Using GA4 User Type Insights to Drive Marketing Decisions
We previously shared how user-type data informs optimization tactics, but how does it look on a grand scale?
Here’s a peek:
(i) Spot trends and patterns
Identify trends before they take off.
As you track user behavior over time period, you’ll gain clarity on your audience’s patterns, preferences, and priorities. Not only do these shape future marketing strategies, but you’ll also have a clearer idea on what new products or services to focus on.
(ii) Segment users for targeted marketing campaigns
Uncover similar attributes of your most valuable user segments.
By grouping all users into different segments, you create relevant campaigns that catch them at the right time.
(iii) Optimize user acquisition and retention strategies
Top performers hint at what attracts and retains users.
Scan for common themes across your best-performing pages to uncover what makes them tick. You’ll improve acquisition and user retention in the long run.
(iv) Track the impact of marketing initiatives
Successful digital marketing efforts generate best-fit customers. Align every content, campaign, and channel with your user-centric KPIs and measure for long-term success.
Automate Your GA4 Reports Today
We won’t sugarcoat the truth.
Mastering GA4 is overwhelming. Fortunately, this guide provides the foundation you need in the first step: understanding user types.
If you’re still lost, don’t worry.
Our free template boasts premade user metrics—perfect if you’re creating GA4 reports for the first time.
Gather your entire GA4 data across campaigns, channels, and content into one beautiful report. DashThis is the easiest reporting tool. Start your free 15-day trial today.
Ready to automate your GA4 reports with Dashthis?
Read More
Don’t miss out!
Automate your reports!
Bring all your marketing data into one automated report.
Try dashthis for free

