Google Analytics Custom Reports: How to Transform Data into Actionable Insights

GA4’s latest reporting UI lets you organize your report navigation and collections on a granular level, streamlining reporting for the entire team.
It sounds awesome, but you’re not 100% sure how to create a Google Analytics custom report now.
Lucky for you, this guide shows you how to do precisely that.
- Understanding Google Analytics Custom Reports
- How to Create GA Custom Reports with DashThis
- Create Awesome GA4 Custom Reports with DashThis
- DashThis’s Google Analytics Custom Report Template
- Automate Your Google Analytics Report
Understanding Google Analytics Custom Reports
Conversion events have replaced goal conversions.
Bounce rate is different.
Session duration is now longer.
Not to mention the new attribution features we need to relearn.
And don’t get us started on how we can segment pageviews by hostname but not in the landing page view. 🤨
Google Analytics 4 has a lot of unlikeable quirks.
The next generation of analytics has revamped its platform, completely changing almost everything we once knew and loved.
Fortunately, setting up a new custom report on GA4 is still pretty straightforward.
Back then, when we wanted to create custom reports on Universal Analytics, we had to click customization > custom reports and select the report type (e.g., explorer, flat table, map overlay).
Today, here’s what it works:
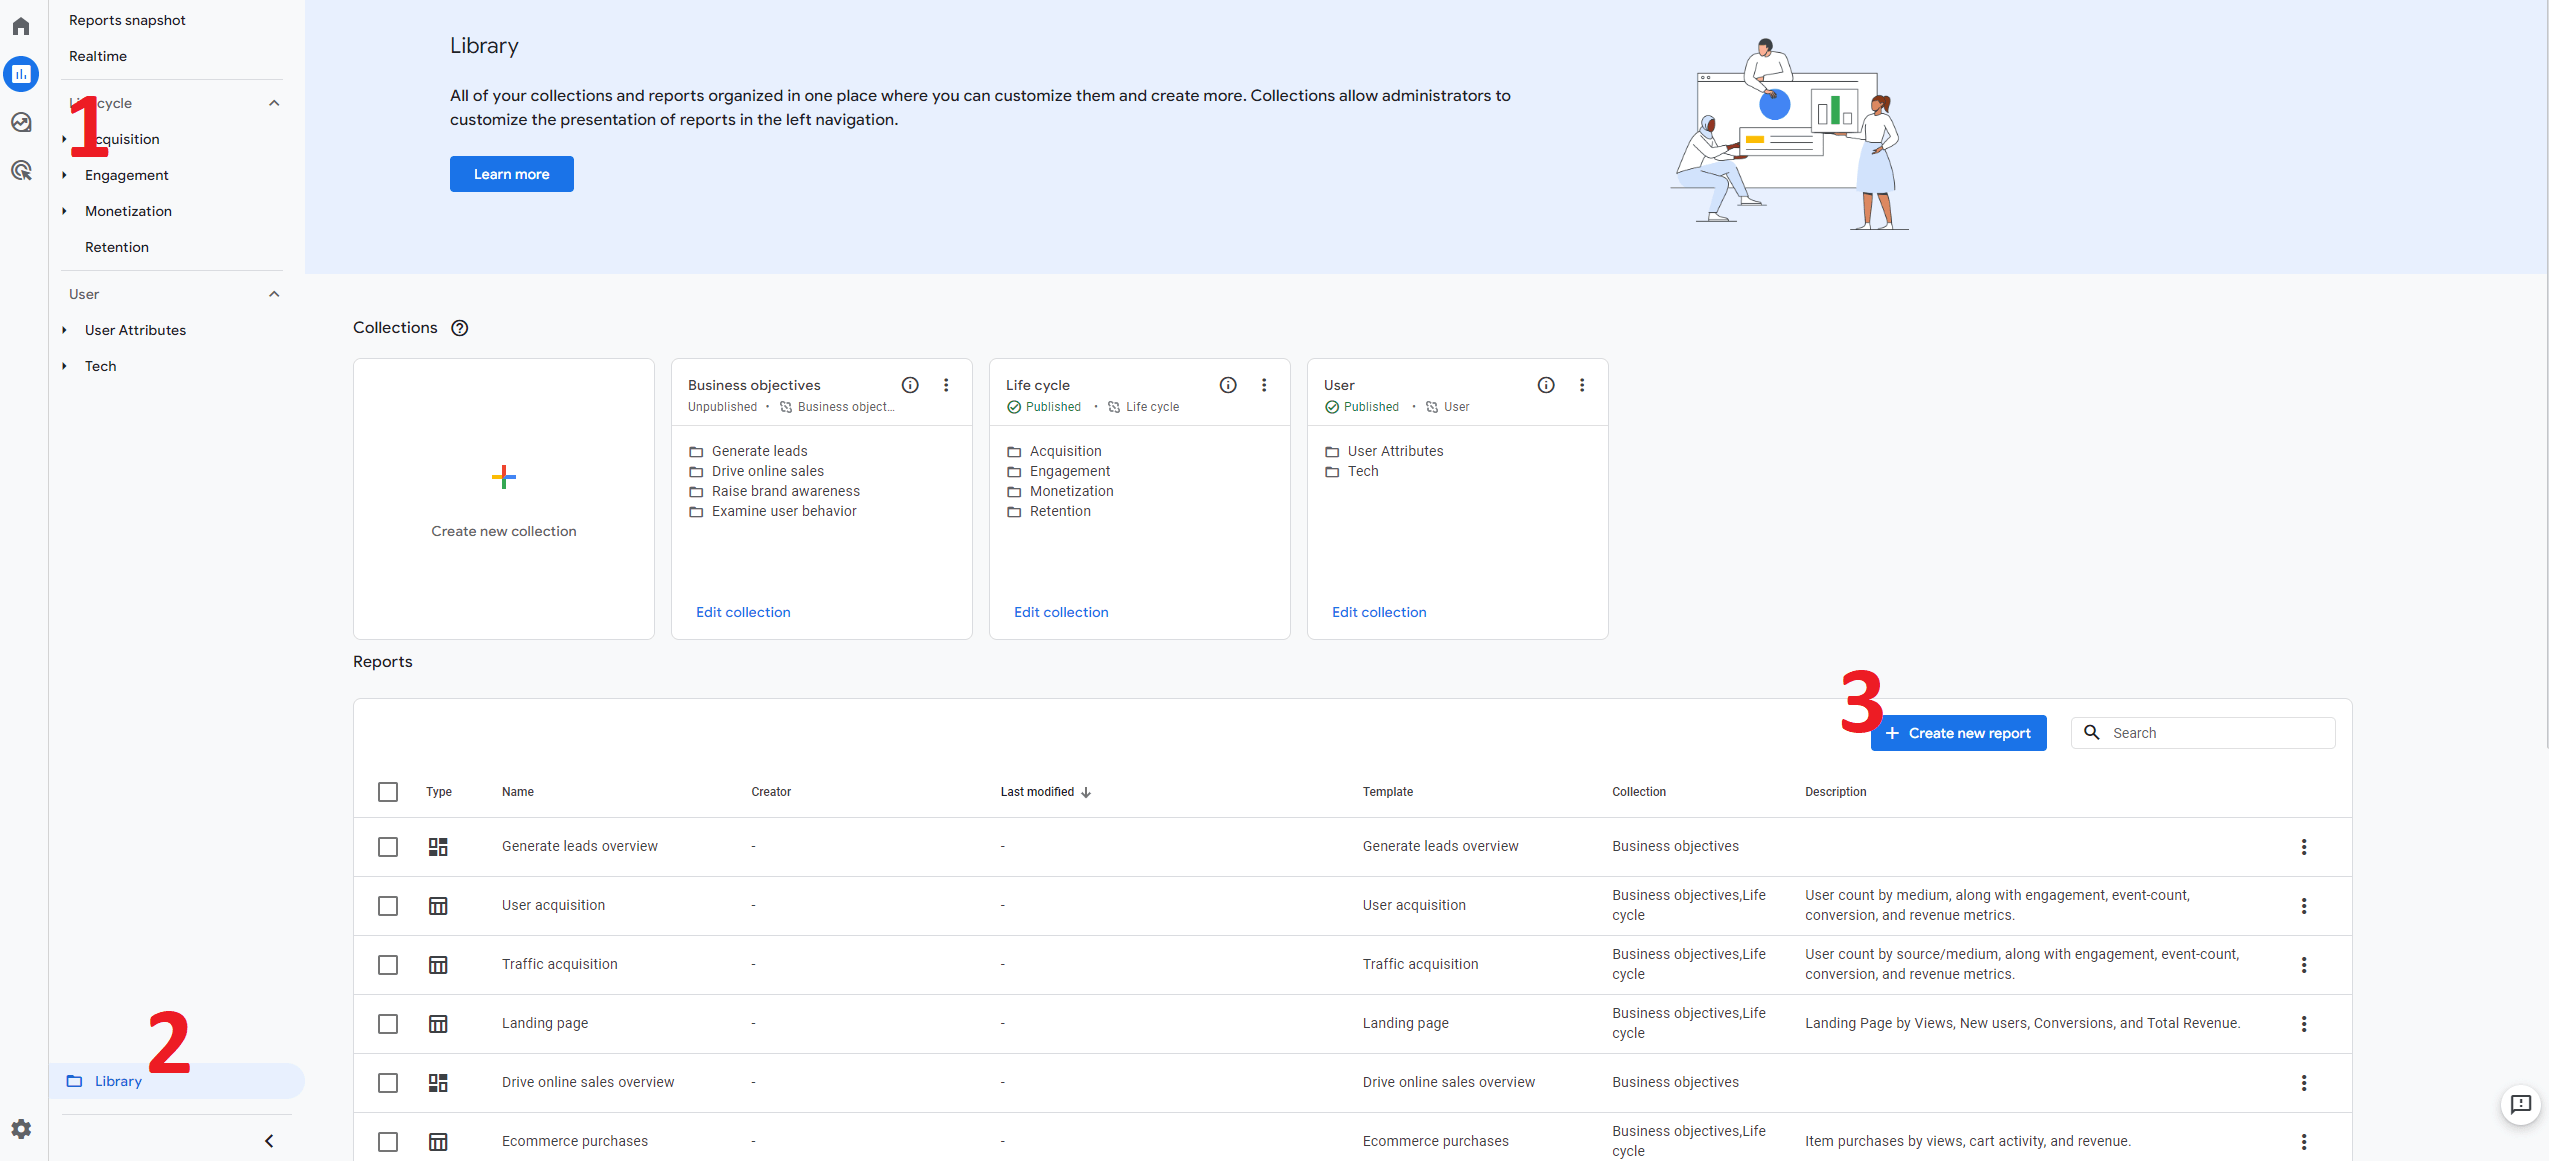
- Click the report tab
- Select Library
- Choose Create new report
Next, pick Create detail report on the drop-down menu.
Start from scratch.
Or pick a template with built-in metrics and dimensions.
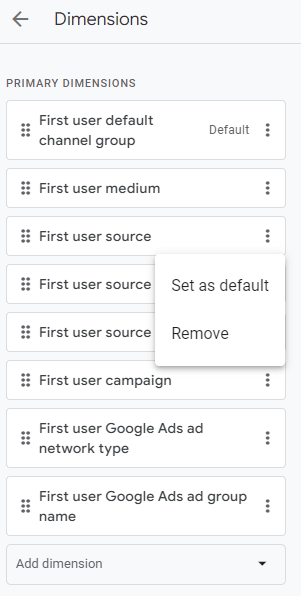
On the right side of the screen, click Dimensions and the three-dot icon to choose what you want as the default.
Click Apply.
Click the save button.
Name your report and give it a description and click Save.
And that’s it.
These custom reports build out the metrics, dimensions, and filters in your preferred charts. Use them to save more time and dig deeper into your analysis.
How to leverage this data into actionable insights
GA4 is a data powerhouse packed with uniquely accessible insights. The best way to leverage it: organize your reports into collections.
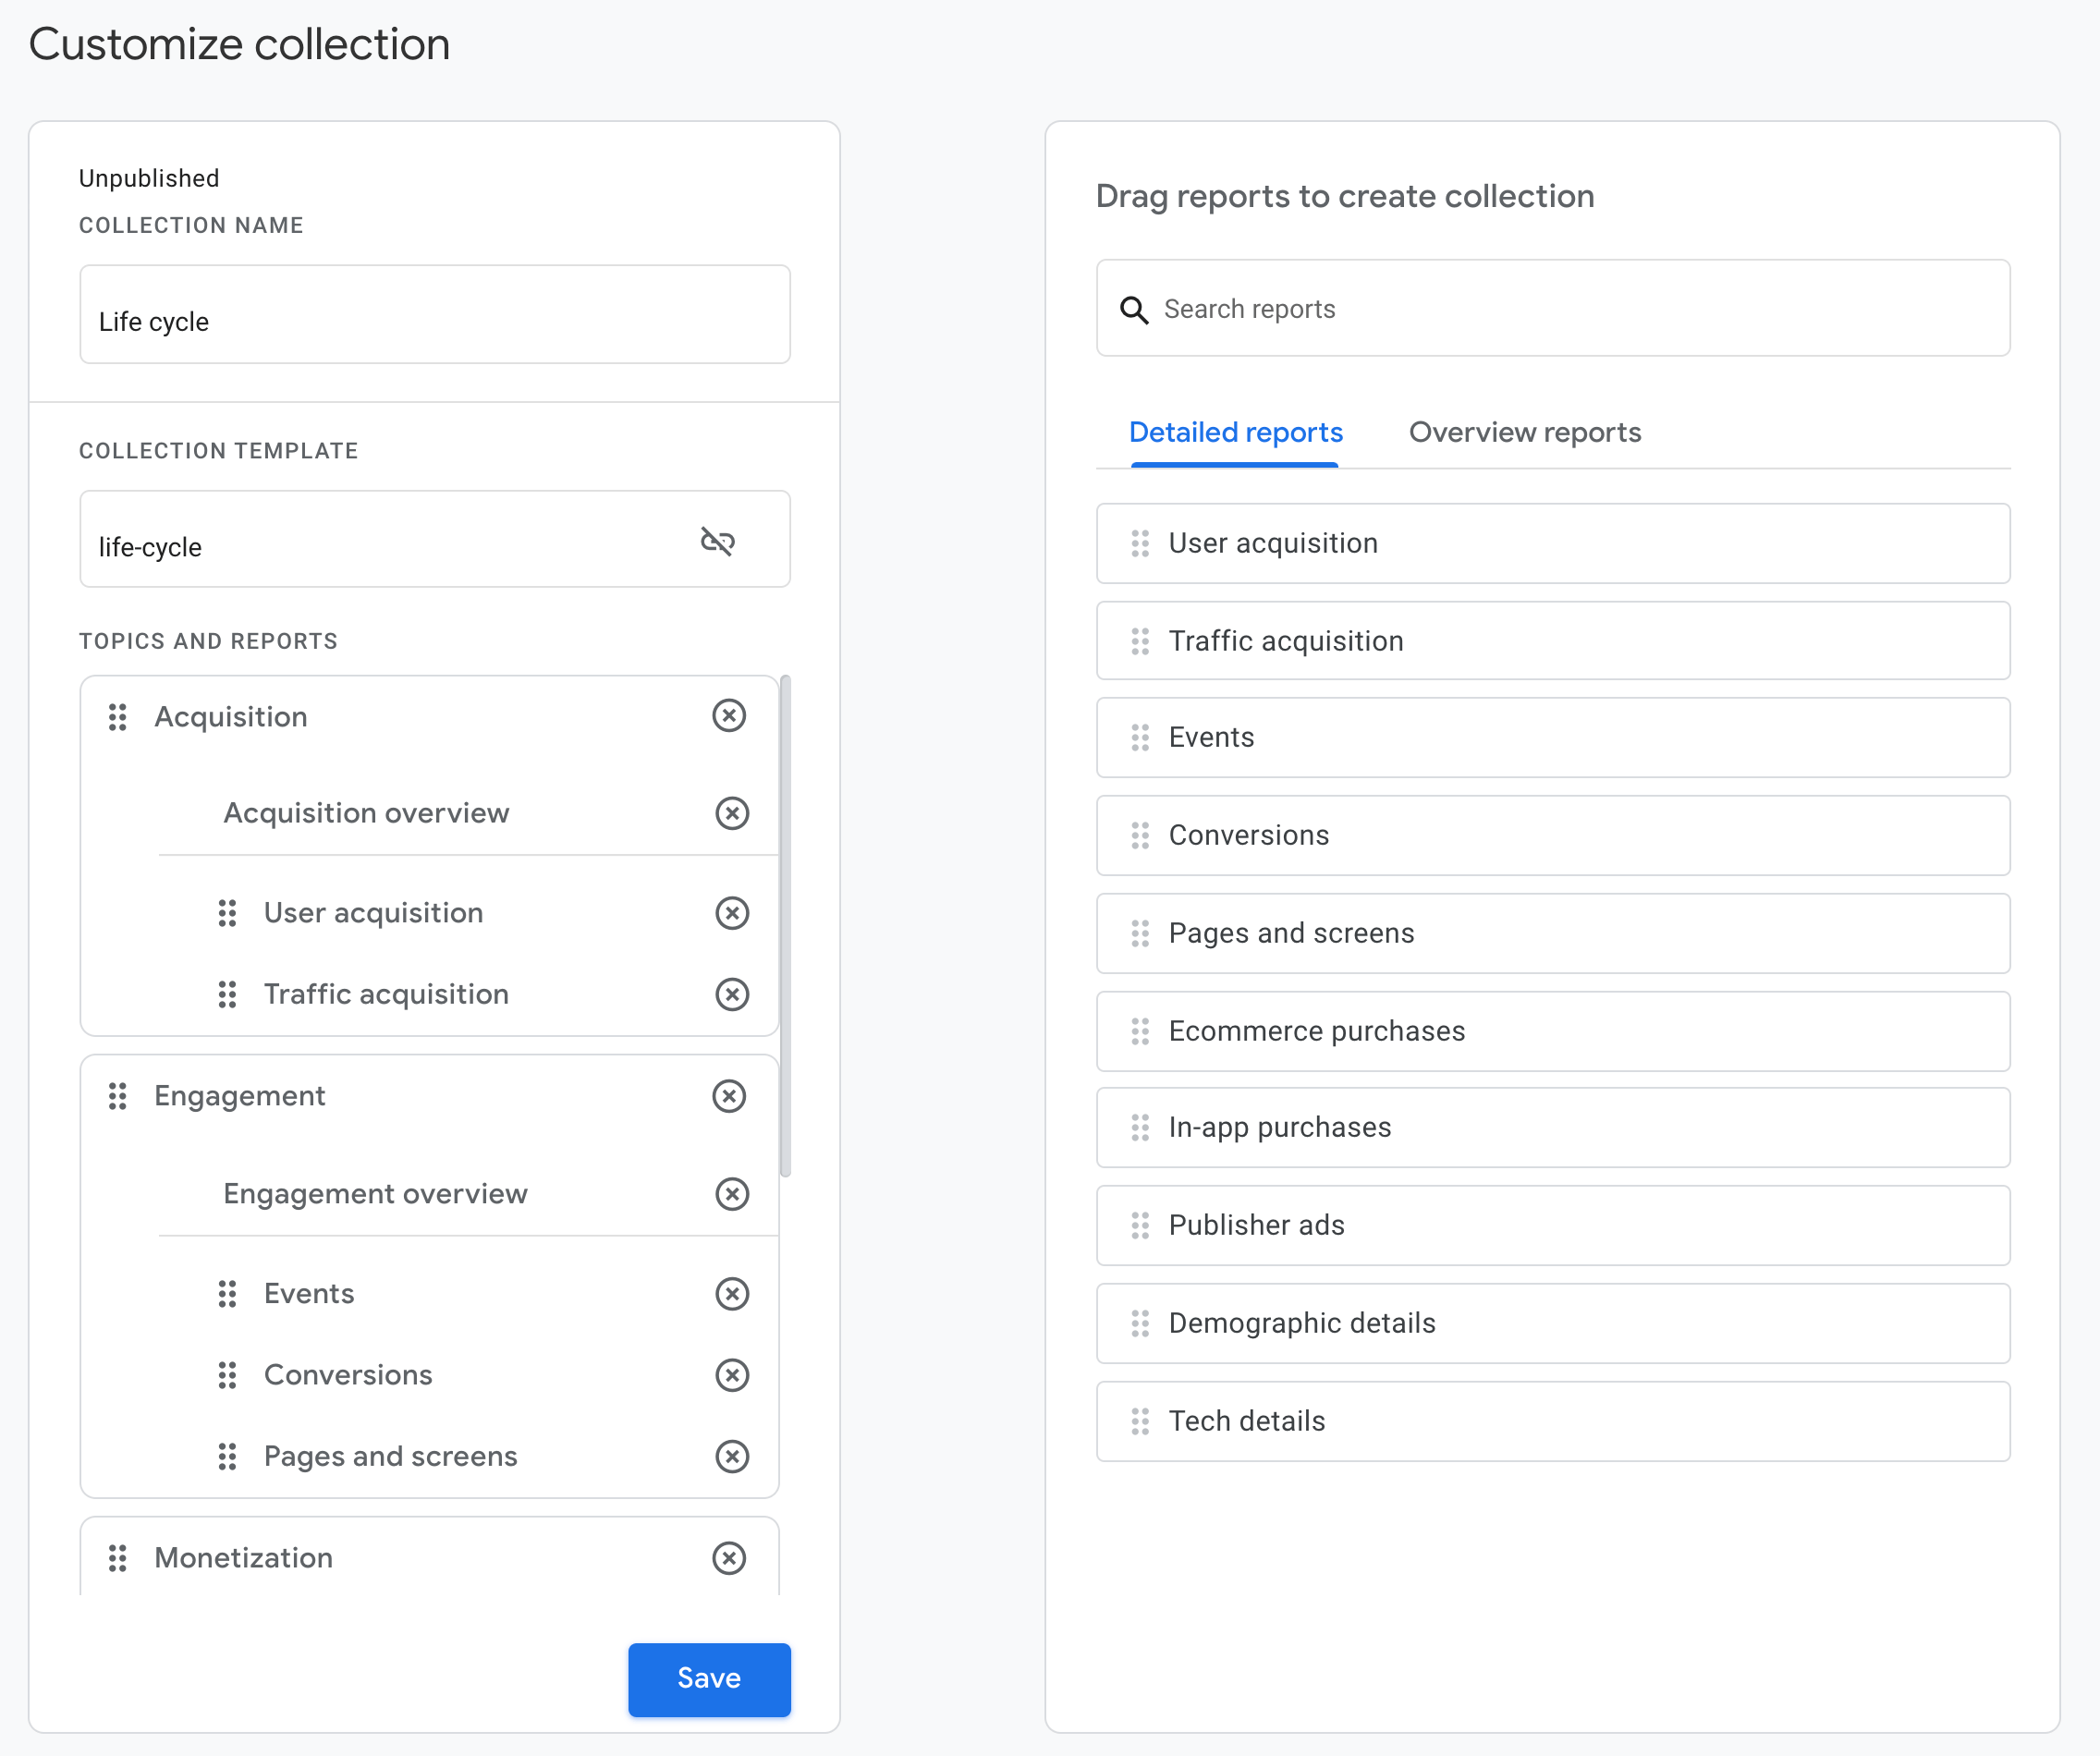
One highlight of GA4 is the highly customizable reporting UI. It lets you modify your reports and left nav on a granular level—brilliant when you want to focus on specific KPIs and metrics relevant to your business needs.
Build your different report collections for specific teams (e.g., paid vs. organic) so everyone will know exactly where to click for their reporting needs.
Let’s illustrate this with an example.
Say you’re the head of ecommerce marketing and you want to analyze how traffic compares among paid, organic social, and referral channels.
Set up an event and change your team’s definition of engagement in the traffic acquisition report. The reason we recommend this is because GA4’s built-in engagement rate is a session over eight seconds, which, frankly, isn’t what we consider healthy engagement. 😬
Publish the report and organize it in the left nav once you’re done. With all custom reports in alphabetical order, stakeholders can quickly access them with a few clicks.
How to Create GA Custom Reports with DashThis
GA4 is far from a perfect tool.
One glaring drawback is its inability to reuse custom reports in multiple GA4 accounts. A bummer for agencies that want to reuse the same proven template across different clients!
Great news, DashThis lets you reuse your custom report templates across your entire client base.
Our marketing tool automatically gathers all your Google Analytics data into a beautiful report in the blink of an eye.
Note the GA4 dashboard below. It auto-collects your raw event-based data and visually breaks down how each metric impacts site traffic.
It’s easy to get started.
Connect your Google Analytics account seamlessly with DashThis and let it do the rest. Boasting a user-friendly interface, it takes only a few minutes to find the information you need.
Save your report as a template for future campaigns. This template will keep the same metrics, dimensions, filters, and positions of your widgets.
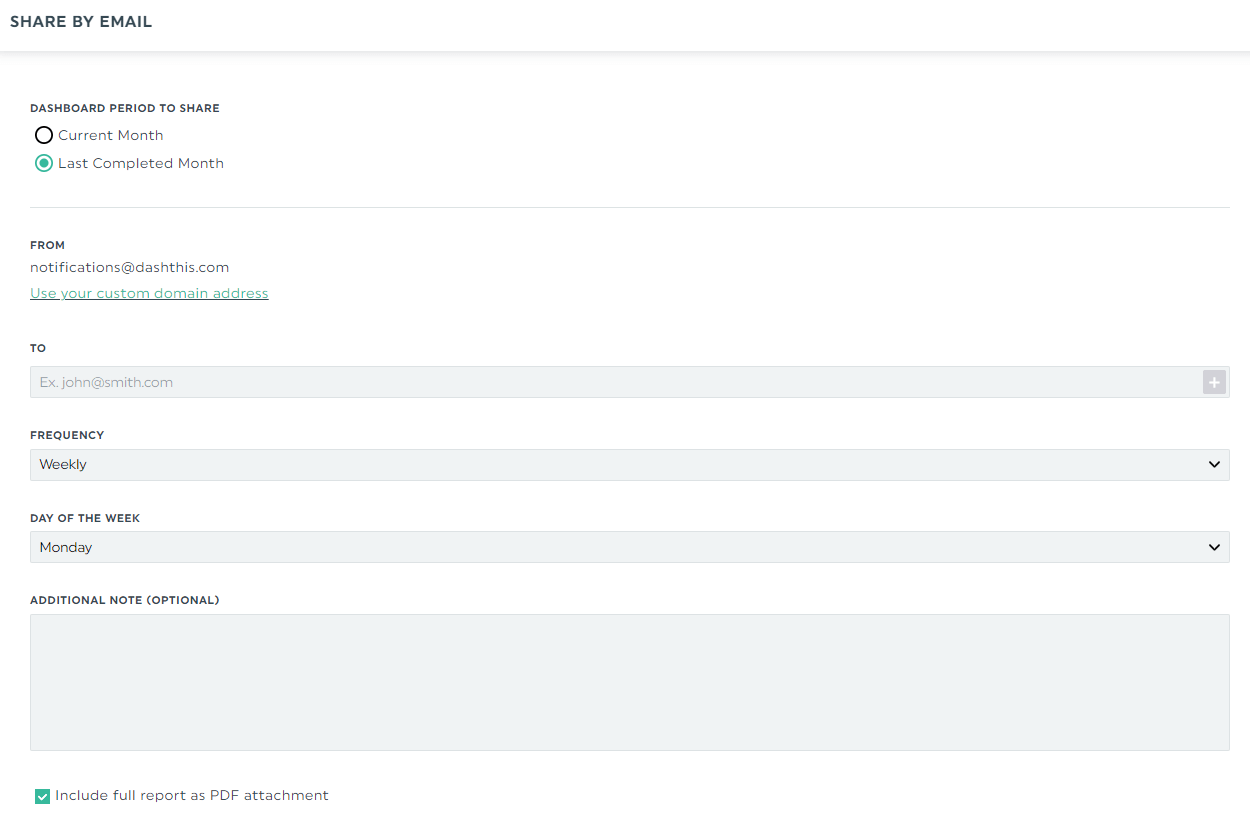
Share reports via automatic email dispatch in your preferred time frame. You can send your client reports every week, quarter, month, taking no further action.
Track multiple channels at once. From social media to email and SEO to PPC, you can quickly compare performance in one place.
DashThis is an easy-to-use marketing reporting tool that helps busy marketers save hours of their time. Grab your free 15-day trial to automate your marketing reports today.
Create Awesome GA4 Custom Reports with DashThis
Are you sold on using DashThis to automate your reporting?
If so, here's a step by step tutorial to get started:
- Connect your Google Analytics account with DashThis
- Select the Google Analytics Report template
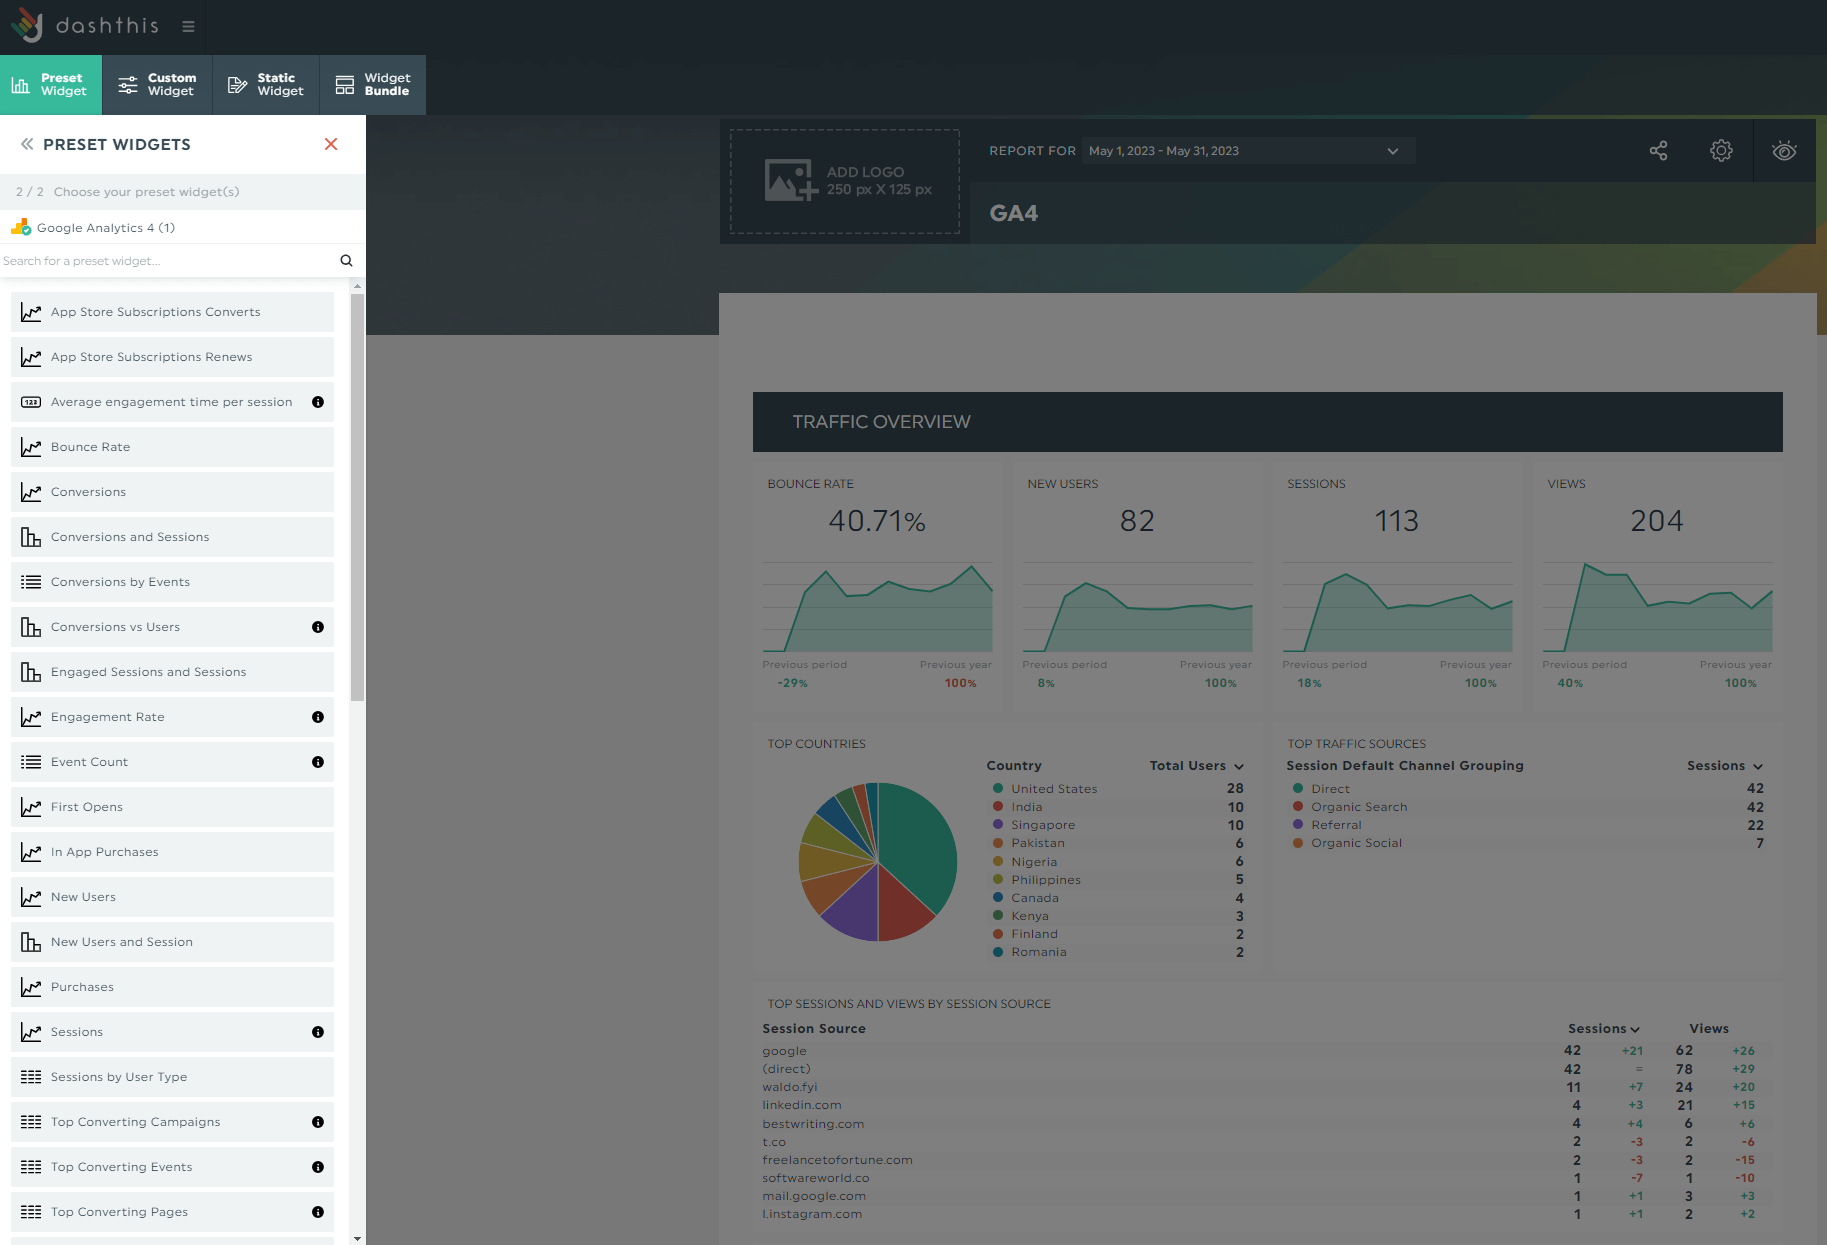
- Choose your metrics in Preset Widgets
DashThis automatically grabs your Google Analytics data and transforms it into eye-catching graphs and charts.
Drag and drop every data table to form a cohesive look. For example, you might drag the monthly conversion rate widget next to a yearly goal completions bar graph to better understand trends and patterns.
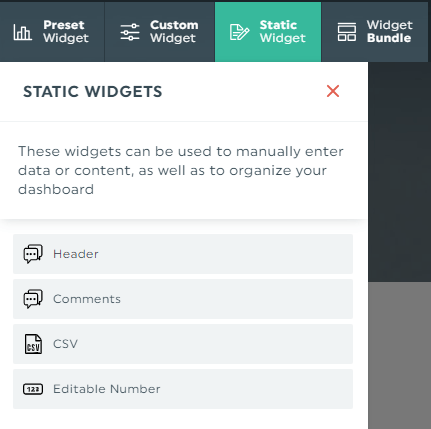
Click Static Widgets > Comments to outline the next steps within the report. Share your recommendations for the next month’s or quarter’s campaign instead of emailing a separate message.
If you want to use this report again, click Dashboard Options > Save as Template. Note: the content from static widgets won’t be carried over, so you don’t need to worry about a client seeing your comment to another.

Grab your free 15-day trial to automate your marketing reports today.
DashThis’s Google Analytics Custom Report Template
Track user behavior and engagement patterns confidently using these customizable templates below.
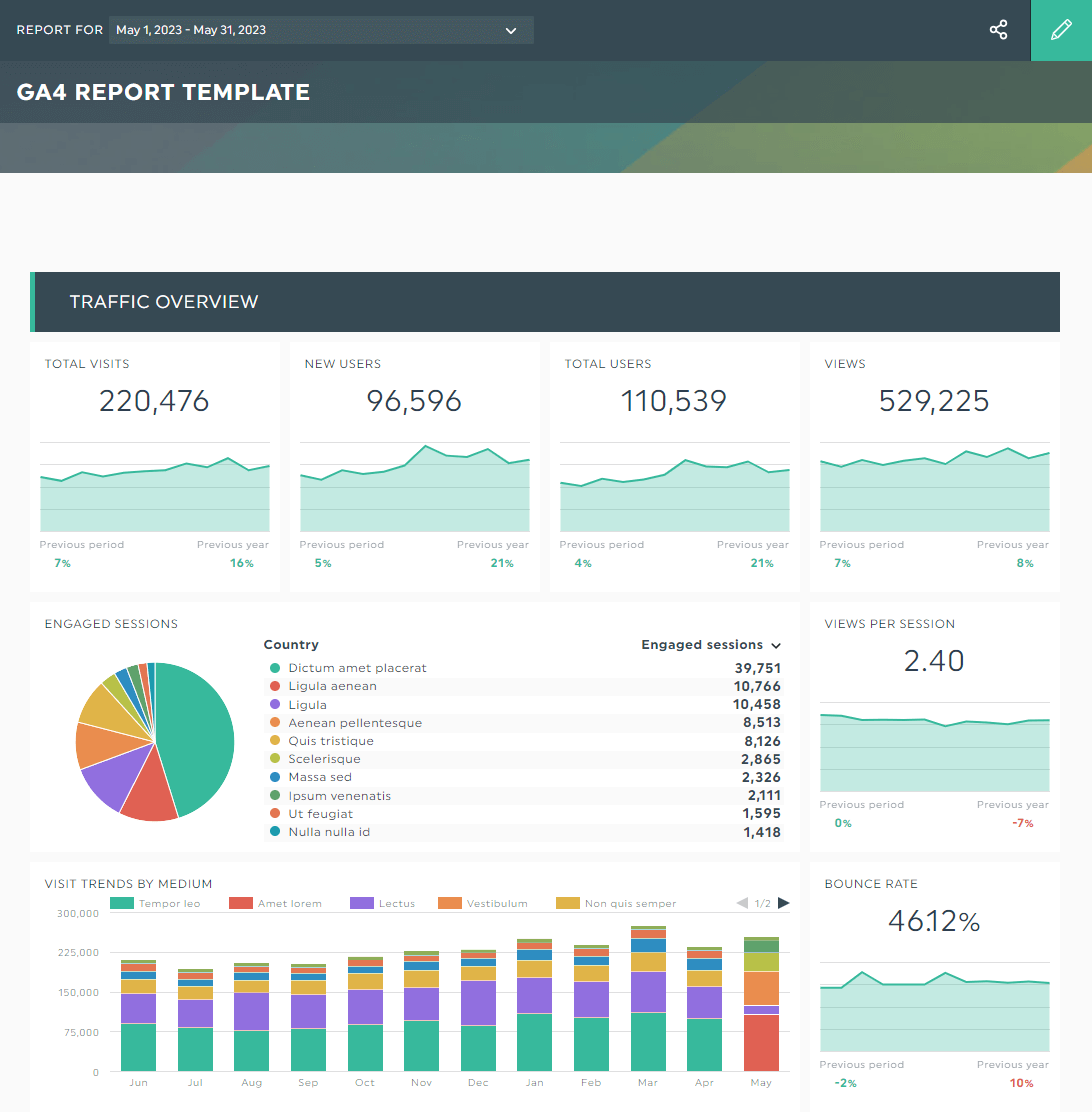
GA4 report template
Note this standard Google Analytics report that drill down how each metric impacts the KPIs. In a snapshot, the line graph in each metric communicates how it’s grown (or dipped) across different periods.
Grab this GA4 report template with your own data!
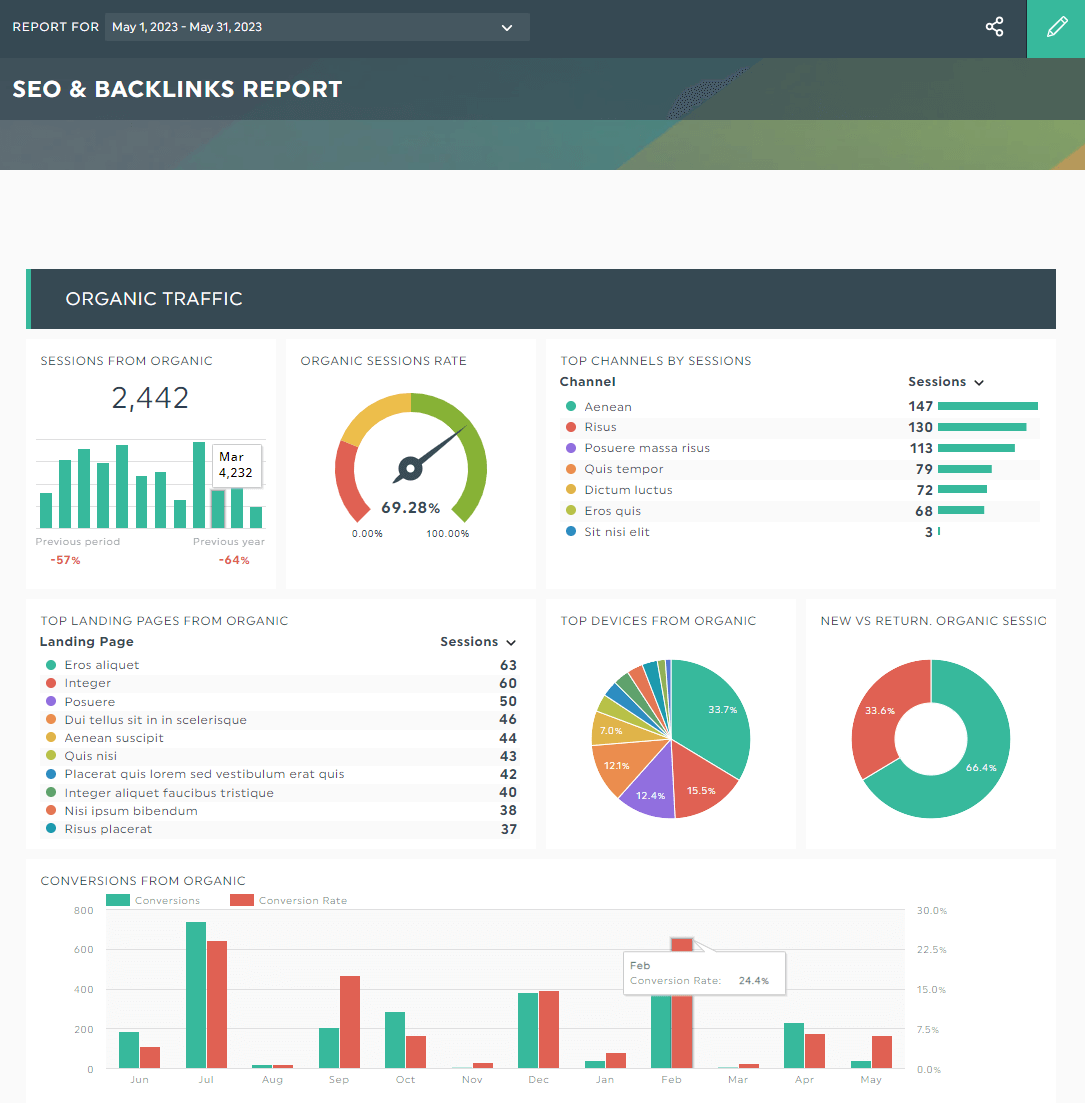
SEO report template
Stack up different web pages against each other. This data-driven custom content marketing report pinpoints the top-performing landing page, gauges optimization efforts, and analyzes conversions over the year.
Grab this SEO report template with your own data!
Digital marketing report template
Compare traffic across different channels. From search engine and social media (e.g., LinkedIn) to paid traffic (hello, PPC), this custom report's got it all.
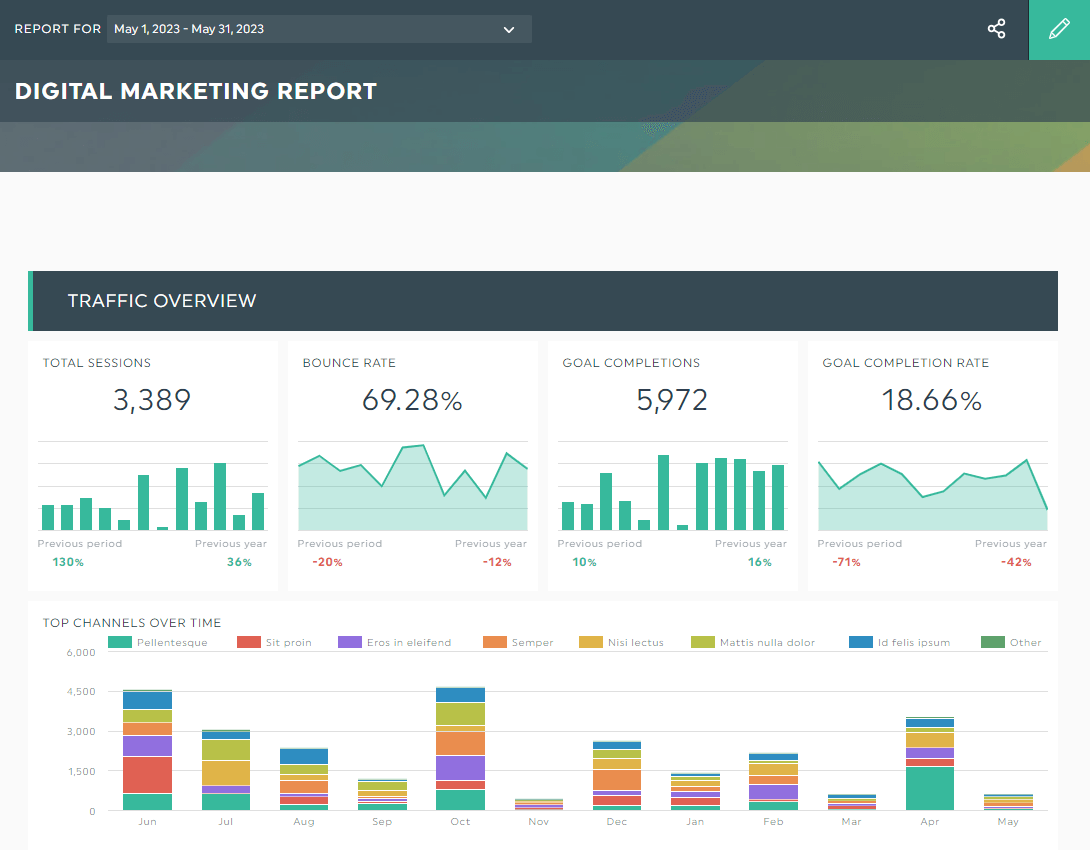
Grab this digital marketing report template with your own data!
Automate Your Google Analytics Report
GA4 feels like a hassle compared to Universal Analytic.
But considering the highly customizable reporting UI (and other features we’ll share in future), we think it’s worth a second look.
Follow these steps to rebuild your custom google analytics reports and organize them on the left nav for streamlined reporting.
Better yet, automate your GA4 reports with DashThis.
Our marketing tool gathers data across multiple channels at once. From GA4 to Ahrefs and email to social media, you can quickly compare your multi-channel performance in one place and save hours of your time.
Grab your free 15-day trial to automate your custom Google Analytics reports in the blink of an eye today.

Read More

Don’t miss out!
Follow us on social media to stay tuned!
Automate your reports!
Bring all your marketing data into one automated report.
Try dashthis for free