The Quick & Friendly Guide to End-of-Year Reporting

The end of the year is chaotic enough, with holiday campaigns, budget planning and wrapping up projects before a well-deserved break. End-of-year reporting shouldn’t add to the stress. In fact, with the right approach, it can be one of the most useful (and oddly satisfying) things you do all year.
Here’s a casual, no-nonsense guide to building an end-of-year marketing report your team and clients will actually read.
Table of contents
- Start With the Big Picture (Not the Numbers)
- Choose the Metrics That Matter
- Highlight Your Wins With Context
- Don’t Avoid the Lows or Losses
- Showcase the Best of the Year (Make it Visual)
- End With a Simple, Actionable Plan for Next Year
- Keep It Personal & Honest
Start With the Big Picture (Not the Numbers)
It’s tempting to jump straight into the meat and potatoes, aka the metrics and graphs, but take 10 minutes first to zoom out. Think about the story you want this report to tell.
A good end-of-year report answers these three questions:
- What were the goals?
Did you focus on growing organic traffic? Increasing retention? Write these down so you can evaluate your performance against something real.
- What worked?
Not every win will be a flashy one. Maybe you cracked a new content format, found a more efficient ad setup, or finally convinced your clients to stop tracking pointless vanity metrics.
- What didn’t?
This isn’t about calling out failures, it’s about identifying what not to repeat next year. A clear-eyed look at what fell flat can be more useful than celebrating wins.
This sets the stage. Your report becomes a narrative, not a data dump.
Choose the Metrics That Matter
Year-end reporting tempts people to throw every possible number into one document. Resist. More data does not mean more insight.
Instead, stick to metrics that directly align with your goals. For example:
- Content & SEO: organic sessions, keyword growth, top landing pages, conversions from organic
- Social: engagement rate, follower growth, CTR, top-performing posts
- Email: open rate, click rate, unsubscribes, conversions
- Paid campaigns: ROAS, cost per lead, cost per conversion, audience performance
If a metric doesn’t help explain the year’s results, it doesn’t belong in the report.
(And if you’re using DashThis, your reports probably already have these widgets set up, so this part is painless.)
Highlight Your Wins With Context
A chart showing traffic going up is nice. But what people really want is the “why.”
Instead of simply saying Organic traffic went up 22%, try something like:
- We grew organic sessions by 22% this year, largely thanks to our new content refresh strategy launched in March. Updated posts drove 40% of our organic conversions in Q3 and Q4.
Or:
- Our LinkedIn engagement rate doubled after we shifted to more behind-the-scenes and team-led content.
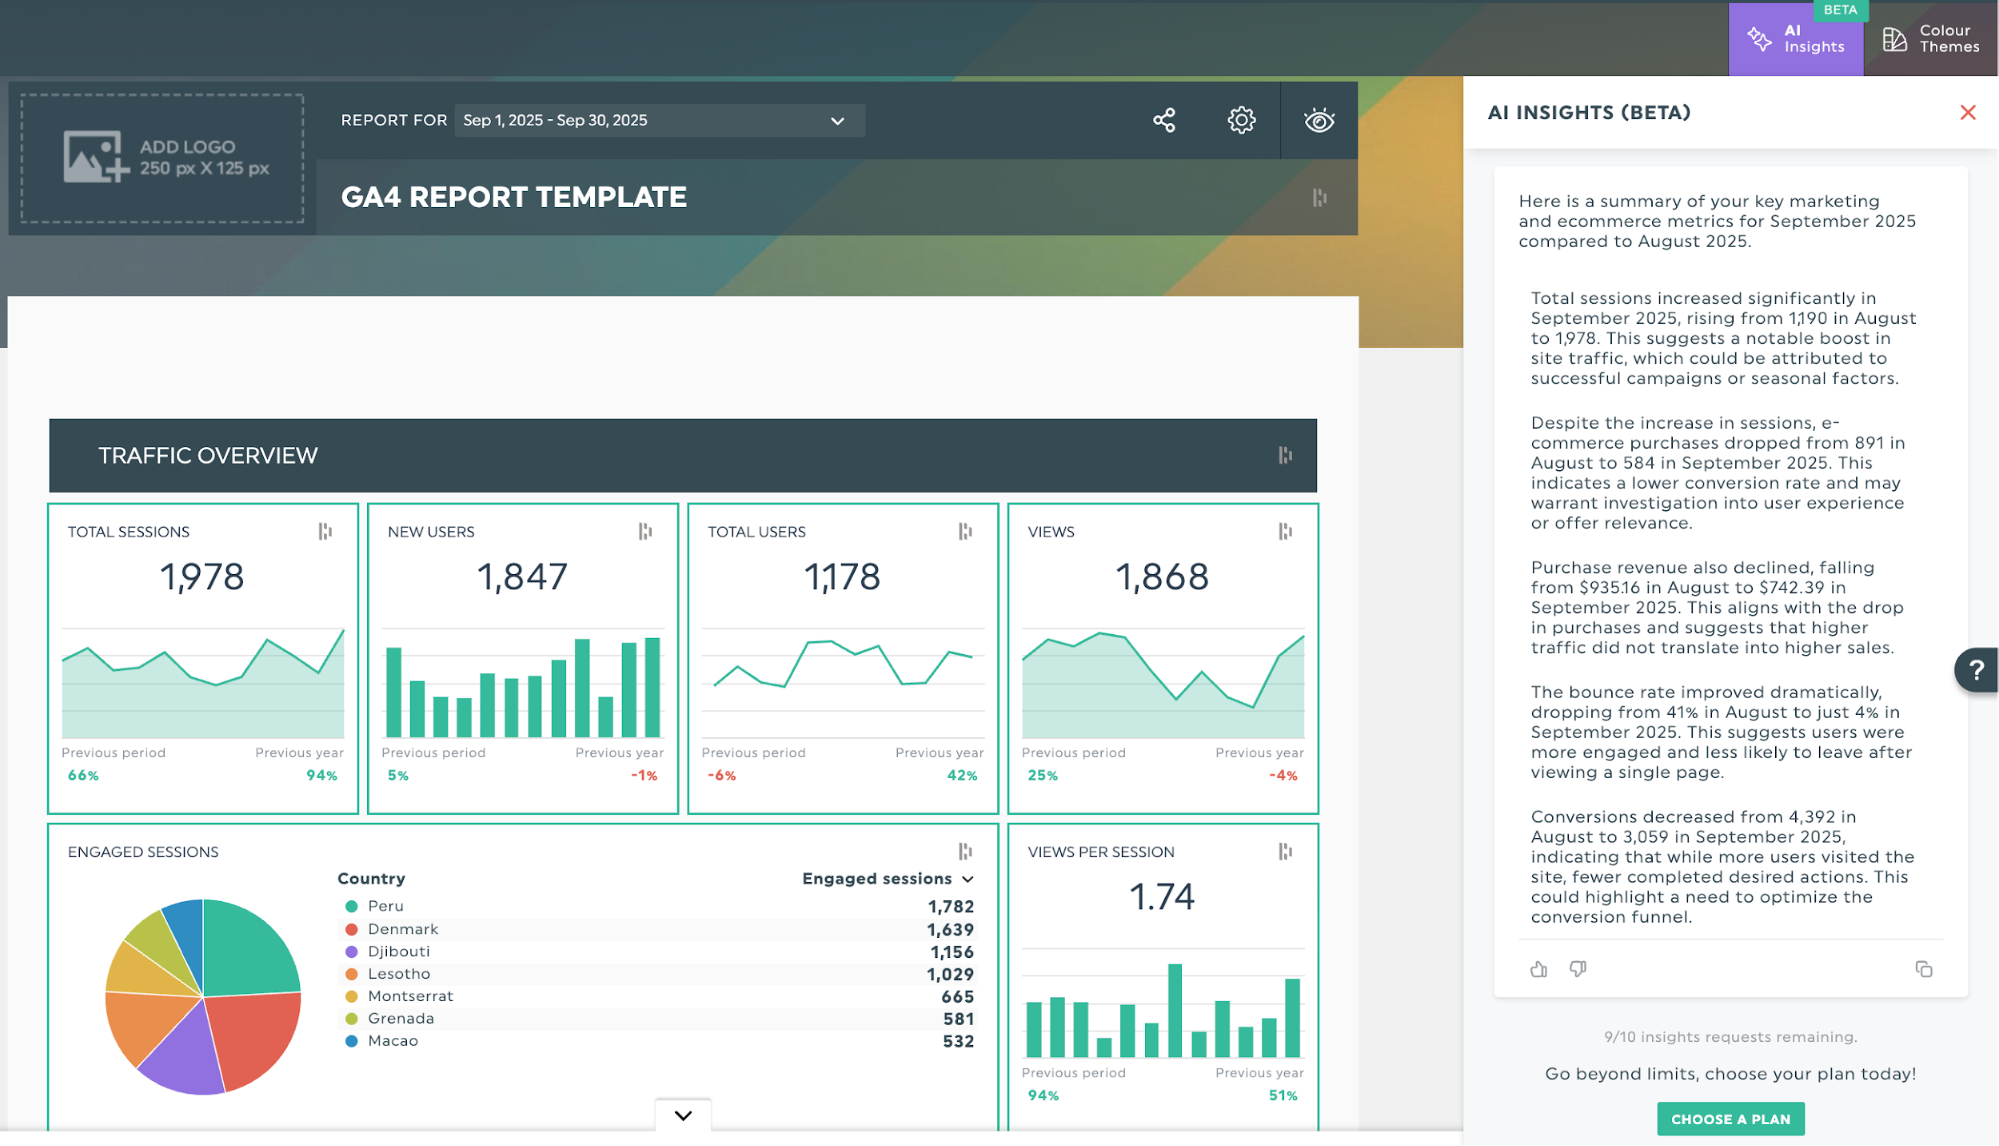
Context makes your results meaningful. Even small wins feel bigger when you explain what drove them, and if you’re using AI Insights, you don’t even have to dig for that context yourself. It automatically surfaces the “why” behind your numbers, saving you from manually hunting through trends or guessing what caused a spike or dip.
Don’t Avoid the Lows or Losses
Every year has hiccups. Campaigns flop. Algorithms do algorithm things. Budgets get cut. Your job isn’t to hide any of that; it’s to make it useful.
Here’s how to frame underperformance without sounding negative:
- Explain what happened
- Identify the cause
- Share the plan for improvement
Try something like: “Our CPCs were significantly higher this fall, mostly due to seasonality and increased competition. Next year we’ll shift part of our budget earlier in Q3 and test new keyword groups to reduce costs.”
This turns “we underperformed” into “we learned something.”
Showcase the Best of the Year (Make it Visual)
People love skimmable eye candy in a year-end report. Add a section highlighting:
- Top-performing posts
- Best emails
- Your biggest month
- Most successful campaign
Think of it as your marketing highlight reel.
End With a Simple, Actionable Plan for Next Year
People love skimmable eye candy in a year-end report. A quick “highlight reel” of your standout moments like your best-performing content, your strongest month, or the campaigns that made the biggest impact makes the report feel more engaging and easier to digest. It’s a simple way to give readers a sense of the year’s momentum without overwhelming them with data.
From there, it’s an easy shift into what comes next. Close your report with a short section outlining where things are headed next.
For example:
- Double down on the channels that drove the strongest ROI
- Test new content formats
- Refresh underperforming landing pages
- Build automation around repetitive reporting tasks
- Reallocate budget toward proven audiences
This keeps your report feeling forward-thinking rather than backward-looking and shows how the insights you gathered this year will actually shape your strategy moving forward
Keep It Personal & Honest
End-of-year reporting shouldn’t feel stiff or formal. It’s a chance to reflect, celebrate progress, and be transparent about what you learned. When in doubt, communicate like a real human, not a dashboard.
And if you want to make next year’s reporting even smoother, try building your year-end dashboard right in DashThis: it’s the easiest way to keep everything organized, compare performance year over year, and start January with clarity instead of chaos. Try it today!

Discover AI-driven Insights with DashThis
Read More

Don’t miss out!
Follow us on social media to stay tuned!
Automate your reports!
Bring all your marketing data into one automated report.
Try dashthis for free