Top 6 Ways to Enhance Marketing Agency Reporting With AI

69.1% of marketers have incorporated AI into their marketing strategies.
Consider that you and your team spend countless nights collecting data from Google Analytics, social media platforms, and ad dashboards. You collect data in a file, and halfway through, you realize somebody made a mistake with the sales numbers.
As a result, you don’t have the exact data to show the results to your client. This shakes the level of trust the client has in your company.
But what if AI in marketing agency reporting makes your life easy? It can collect data from all sources automatically, update dashboards in real-time, and visualize trends. Every client receives a tailored report. A summary of the report can be presented with voice technology as well.
This article outlines how AI-powered reporting tools help agencies improve their reporting.
Table of contents
- Automating data collection
- Real-time performance tracking
- Improved data visualization
- Personalized client reports
- Predictive analytics for smarter reporting
- Natural language summaries
- Turn Your Marketing Reports Into Relationships
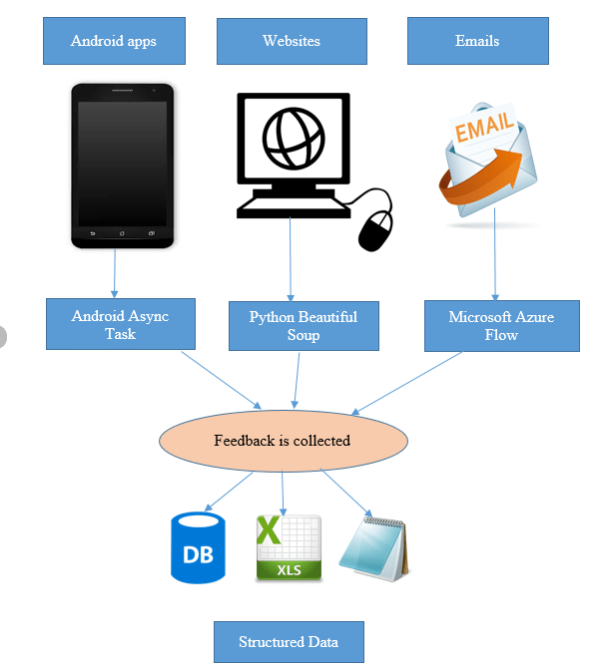
Automating data collection
The process of data collection looks like downloading numbers from Google Ads, cross-checking from Facebook Ad Manager, collecting conversion rates from Hubspot or Salesforce, and exporting audience management data from Instagram or LinkedIn.
After collecting data, a person would spend hours cleaning and organizing the spreadsheets. This process is time-consuming and prone to human error.
With AI-powered reporting tools, data is collected automatically from multiple platforms, then cleaned and updated in your dashboards.
For example, platforms like Supermetrics, Funnel.io, or Google’s Looker Studio (with AI integrations) can connect to dozens of marketing tools and fetch the data you need. Instead of logging into different platforms, you log into one. AI helps in detecting anomalies as well. Some agencies also integrate ETL tools for niche use cases so that marketing and sales insights are centralized in one place without manual exports.
Why does this matter?
- Time savings
Collecting data automatically saves time as teams don’t have to fetch everything manually.
- Accuracy
The data that is collected manually is prone to human error. Some entries can be duplicated, some numbers may be mismatched or missing. This accuracy is maintained when data is collected automatically.
- Scalability
Businesses can scale easily without the burden of increasing their workforce. Automation leads to collecting a huge amount of data, so you scale without any worries.
An agency uses AI to automate data collection for all its clients. Reports that took 4–5 days of an analyst’s time each month are now produced within hours. The analyst focuses more on finding insights, experimenting with A/B tests, and developing client strategies. This improves client retention because reports are presented faster with proper analysis.
Automating data collection with AI can improve the performance of your team. There’s less repetitive work and more brain work.
Real-time performance tracking
Would you drive a car with a speedometer that updates only once? You won’t be able to figure out whether you will arrive on time. Relate this to marketing reports. Monthly or weekly reports tell you how you are progressing. They don’t inform you how soon you can reach your goal, what needs to change, or how you can improve.
AI-powered dashboards provide real-time performance tracking. Every impression, conversion, click, and spendings are updated automatically. AI integrates with your ad platforms, social media tools, and analytics systems.
When performance shifts, the system highlights the change and suggests reasons for the decline or growth. Some tools, like Adverity or Tableau with AI integrations, can send alerts to Slack or email.
Why does this matter?
- Faster decision-making
With real-time performance tracking, decision-making speeds up. If one ad is underperforming, then the budget of that ad can be redirected to another that is performing better. For a dropshipping business, this agility can mean quickly shifting focus to profitable products while cutting losses on slow movers.
- Client transparency
The data displayed on the dashboards is real-time. This ensures transparency with clients. They don’t have to wait for the report day; they can easily log in and view the data anytime.
- Proactive optimization
Real-time insights can help you reduce spending on what is not working, as discussed in the above ad example. As a result, you direct your budget and improve results.
For example, consider a digital marketing agency that manages an e-commerce brand. They noticed through the AI dashboard that a Facebook retargeting campaign’s CTR dropped by 40% within just two days. Instead of waiting until the end of the month, the team focused on improving their strategy. Within 48 hours, engagement increased.
AI-driven real-time performance tracking transforms reports from history lessons into living dashboards.
Improved data visualization
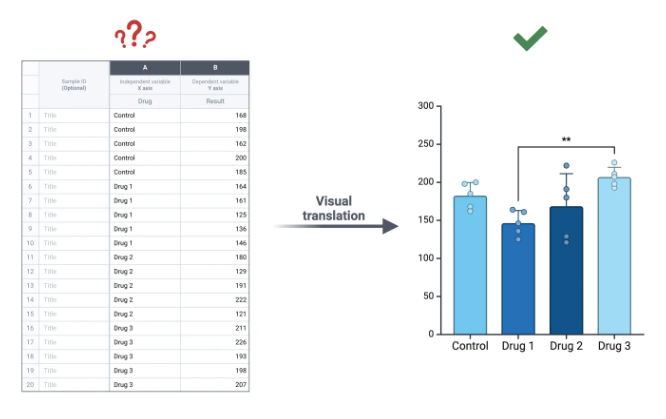
Clients don’t have the patience to read all the sheets or wait for an analyst to explain the insights. Generally, agency reports contain many tables with hundreds of rows and columns. These reports overwhelm clients and confuse them.
AI-powered visualization tools completely change that experience. Instead of rows and columns, clients see interactive charts, graphs, heatmaps, and trends. The story of the raw data becomes clear.
This visualization can clearly show a dip in engagement, a spike in conversions, or the performance difference between two campaigns.
Here’s how AI adds more value:
- Choosing the right chart type automatically
AI is smart enough to understand what type of chart should be used to display a particular data accurately. This produces interactive dashboards that tell the real story.
- Highlighting anomalies
AI helps in highlighting anomalies smartly so that they are instantly visible. For example, if one campaign’s CPC is 3x higher than others, AI can flag it with color-coding or annotations.
- Interactive storytelling
Clients can hover, click, and explore data themselves instead of asking for another static screenshot.
Why does this matter?
- Client clarity
Data is properly visualized with accurate charts. This provides clarity, and clients can easily understand what the data is saying. They don’t need a technical person to come and explain.
- Better decisions
Decisions are quick and efficient. There are fewer errors, and therefore, this leads to effective decision-making.
- Improved engagement
Clients remember visuals rather than raw data. So they can act quickly based on the visuals.
Along with visuals, some agencies are experimenting with AI dubbing to make reports more accessible. Instead of sharing only dashboards and charts, AI can generate an audio version of the highlights delivered in a clear, natural-sounding voice.
This allows clients to absorb the key points while commuting, exercising, or multitasking, without needing to sit and study a spreadsheet.
For example, a retail client might receive a quick audio update saying: “Your Instagram ads drove 35% more traffic this week, while Google Ads conversion rates dipped slightly. We recommend shifting 10% of the budget from Google to Instagram for better ROI.” Paired with the visual dashboards, this makes the reporting process dynamic and easy to access.
AI-driven visualizations improve client satisfaction as they don't have to wait for someone to come and explain the reports. They can understand it by themselves.
Personalized client reports
A marketing agency manages clients from various industries. Every client's need is different. A SaaS startup may care about MRR and churn, a retail brand may prioritize conversions and average order value, and a nonprofit organization may go after awareness and engagement.
Then, the agency sends generic reports that cover everything but highlight nothing specific to the clients’ goals.
With AI-driven personalization, instead of one-size-fits-all templates, you can tailor each report to provide the most important data for a specific client.
How it works:
- During onboarding, define client-specific KPIs (e.g., CAC, ROAS, engagement rate, conversions).
- Feed these KPIs into your AI system.
- The AI automatically prioritizes those metrics in the client’s report.
Why does this matter?
- Improves relevance
Clients get to see what matters the most to them. They feel understood when they see reports focused on their preferences.
- Saves time
The clutter is reduced by highlighting only the main points that clients are looking for in a report. This way, AI-driven insight saves time on client reporting.
For example,
Consider a marketing agency handling clients from retail, SaaS, and education. Their reports were in a PDF. It contained generic metrics like impressions, CTR, and ad spend.
The problem:
- Clients couldn’t read the reports as they were too long.
- In the meetings that were held to decide further strategies, the reports were used to explain the numbers rather than discuss improvements.
The solution:
The agency changed its reporting strategy and began using an AI-powered reporting system. It provides personalized dashboards for each client.
- SaaS clients saw metrics like conversion rates and signups in their reports.
- Retail brands received reports focused on revenue per channel and cart abandonment numbers.
- Education clients tracked cost per inquiry and student enrollment trends.
The AI tool automatically prioritized these KPIs.
The impact:
- Clients began reading and engaging with reports because they were relevant and easy to understand.
- Strategy calls shifted from “What does this mean?” to “How do we improve further?”
- Within six months, the agency saw an increase in client retention.
- New client acquisition also improved, as personalized reporting demonstrated value during pitches, shortening the sales cycle.
Personalized reporting shows clients you are delivering what matters most to them.
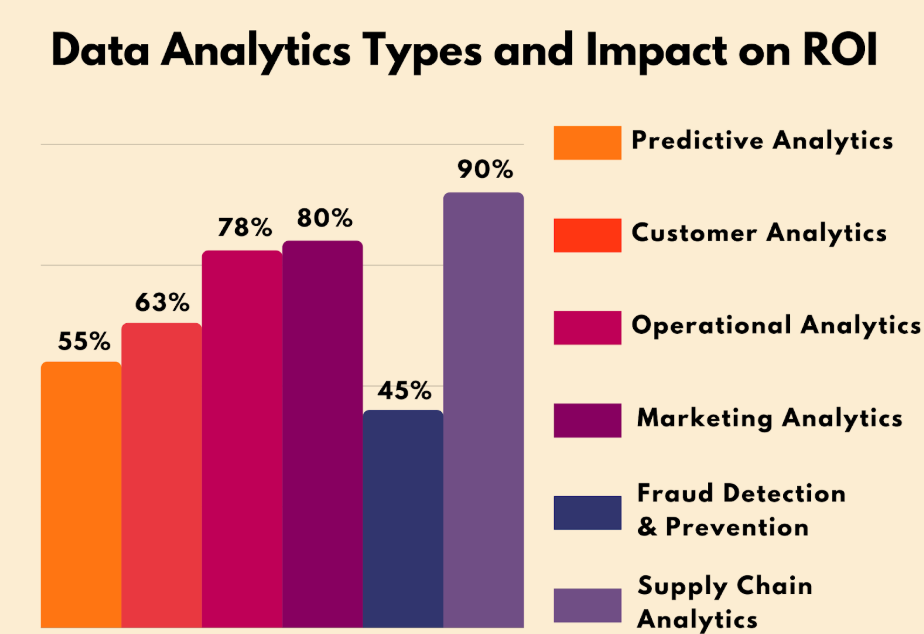
Predictive analytics for smarter reporting
Generating reports on past data tells you what happened. But what if something can tell you what can happen? That’s what predictive analytics powered by AI can do for you.
By analyzing historical data and spotting patterns, AI models can predict future outcomes with accuracy.
Here’s how agencies use predictive analytics:
- They predict the budget for a campaign. How long does your campaign money last, and when spending more money does not give the expected results?
- AI is used to predict which leads may convert, so teams can focus on nurturing them.
- AI can predict when the sale of a particular product will increase or decrease. This helps in deciding when to overstock and understock an item.
- It can predict which platforms will give maximum results.
Why does this matter?
- Proactivity vs Reactivity
Companies can stay proactive instead of reactive. They can act in real-time rather than acting on last month’s results.
- Smarter strategies
Predicting things helps in planning budgets, pitching decks, and sales calls to increase conversion rates.
- Competitive advantage
Agencies with predictive analytics can improve client results, which can attract more clients.
Predictive analytics turns your reports from a rear-view mirror into a windshield.
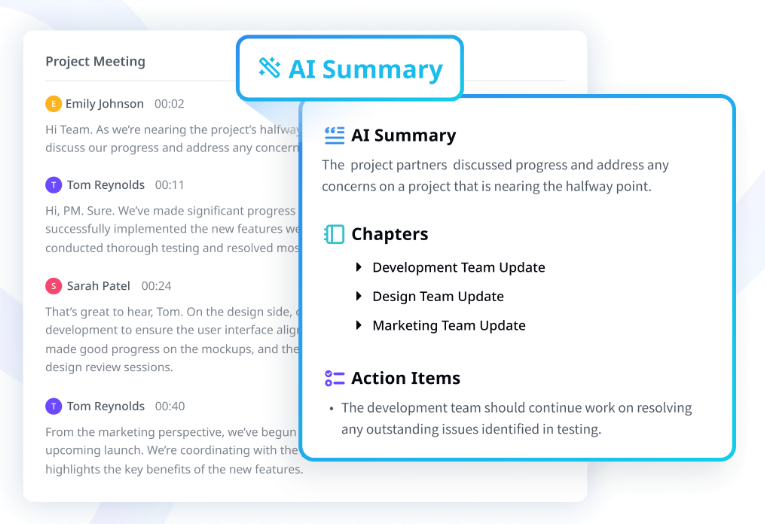
Natural language summaries
Suppose you send a client a 20-page PDF report. You know what will happen next. They skim the first chart, glance at the revenue number, and maybe skip straight to the conclusion. Most clients don’t have the time and patience to analyze every graph.
Instead of only showing numbers, AI can generate simple explanations. For example:
- “Your Facebook ad campaign drove 45% more clicks this month compared to last.”
- “Email open rates dropped slightly this quarter, likely due to audience fatigue. For better results, consider generating new subject lines.”
Why does this matter?
- Clarity for non-technical clients
Clients can easily understand what the report is all about and what areas need improvement.
- Save time
These reports present the conclusion of the overall performance, so that more time is spent on strategizing rather than figuring out what the report has to say.
- Action oriented
These reports showcase insights, not just numbers. So clients can strategize their action plan accordingly.
Some agencies are pairing the written summaries with AI dubbing. Instead of sending clients a PDF, the system can generate a short, voice-narrated update.
Suppose your client gets a one-minute audio brief in a natural, human-like voice saying,
“Hi, here’s your campaign update. Website traffic grew by 18% last month, mainly from Instagram ads. Leads from LinkedIn improved in quality, and your cost per lead dropped by 12%. Great momentum heading into Q4!”
This makes reporting more dynamic, accessible, and even personal. It is a great tool for clients who prefer to listen rather than read. AI dubbing complements the report by making insights easier to consume.
AI in marketing agency reporting transforms raw data into actionable marketing insights.
Turn Your Marketing Reports Into Relationships
AI in marketing agency reporting saves time, improves accuracy, and builds trust with clients.
AI-powered reporting tools automate data collection, provide real-time tracking, help in creating personalized dashboards, and offer predictive analytics.
They turn raw numbers into actionable insights. With natural language summaries and AI dubbing, insights are delivered in a way clients understand and enjoy.
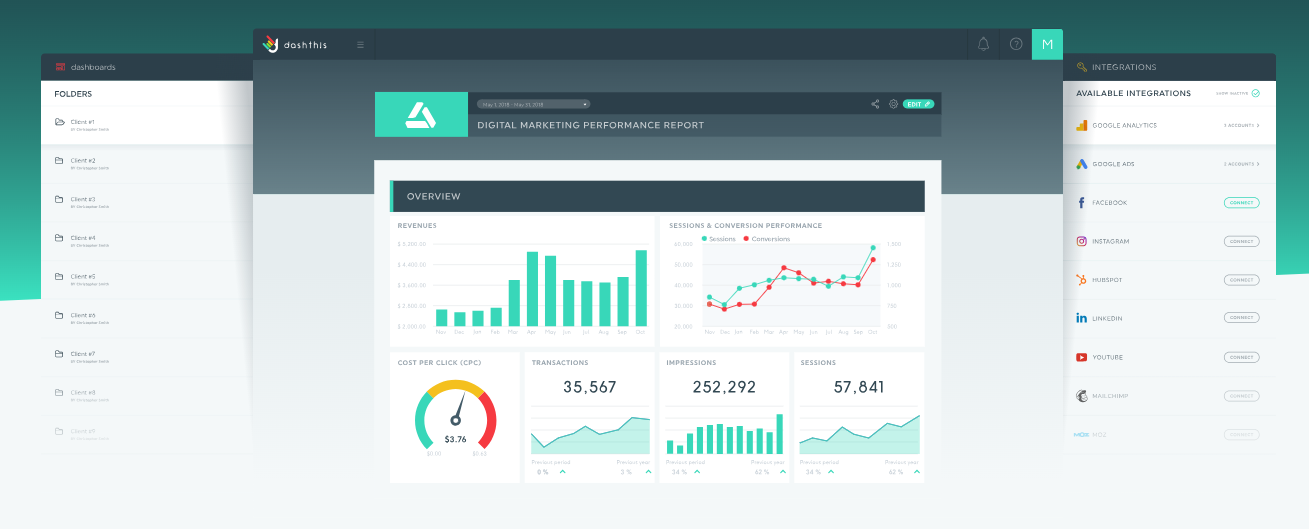
Want to make your business reporting effortless? Explore DashThis today and start transforming the way you report.

Discover AI-driven Insights with DashThis
Read More

Don’t miss out!
Follow us on social media to stay tuned!
Automate your reports!
Bring all your marketing data into one automated report.
Try dashthis for free