Pinterest Analytics: Why It Matters (Metrics & KPIs to Track)

Now that you've discovered Pinterest's potential as your next marketing channel, you're ready to move beyond basic engagement — and hopefully, convert some Pinterest users into an engaged audience and customers in the process.
Before that, you need a quick overview of the metrics and KPIs to measure. That way, you can understand your entire campaign lifecycle, focus on Pins and ads that work, and achieve healthier ROI.
- Why Pinterest Analytics Matter to Marketers
- Pinterest Metrics vs. KPIs – What’s the Difference?
- 10 Most Important Pinterest Metrics to Track
- How to Use Pinterest Analytics to Improve Your Performance
- Automate Your Pinterest Analytics Reports with DashThis Today
Why Pinterest Analytics Matter to Marketers
As a social media platform, Pinterest is steadily catching up to Facebook and Instagram. Here are three reasons to take your Pinterest analytics seriously.
Improve your evergreen content for long-term engagement
Over 60% of Saves were from Pins over a year old, proving Pinterest is an excellent engagement driver for evergreen content.
Review your analytics to pinpoint optimization opportunities: ideal posting time, trending topics, and type of content that drive higher engagement. This will keep your every piece from your content marketing efforts relevant long after posting.
Optimize Pin formats and ad creatives for greater performance
Landscape or vertical? Pinterest board templates or raw images? Carousel or collections?
Different formats and creative styles resonate differently — who knows, the viral user-generated content on your TikTok might perform just as well on your Pinterest Ads.
Check the analytics and measurement dashboard to see what works for your Pinterest strategy.
Catch more sales-ready customers at the right time
Unlike Google's solution-focused searches, Pinterest captures consumers during the brainstorming phase — an early point in the shopping journey. It's the place customers go for fresh ideas.
Your odds of earning a sale rise when you sell to inspired shoppers. Data shows 80% of weekly Pinners feel inspired by the shopping experience on the platform.
Tracking your Pinterest metrics gives a complete view of your campaign lifecycle and shows which Pins and ads drive link clicks and sales.
Note the customizable Pinterest Ads dashboard below that gathers your entire ad campaigns in one place. Instantly spot which campaigns to double down...or ditch.
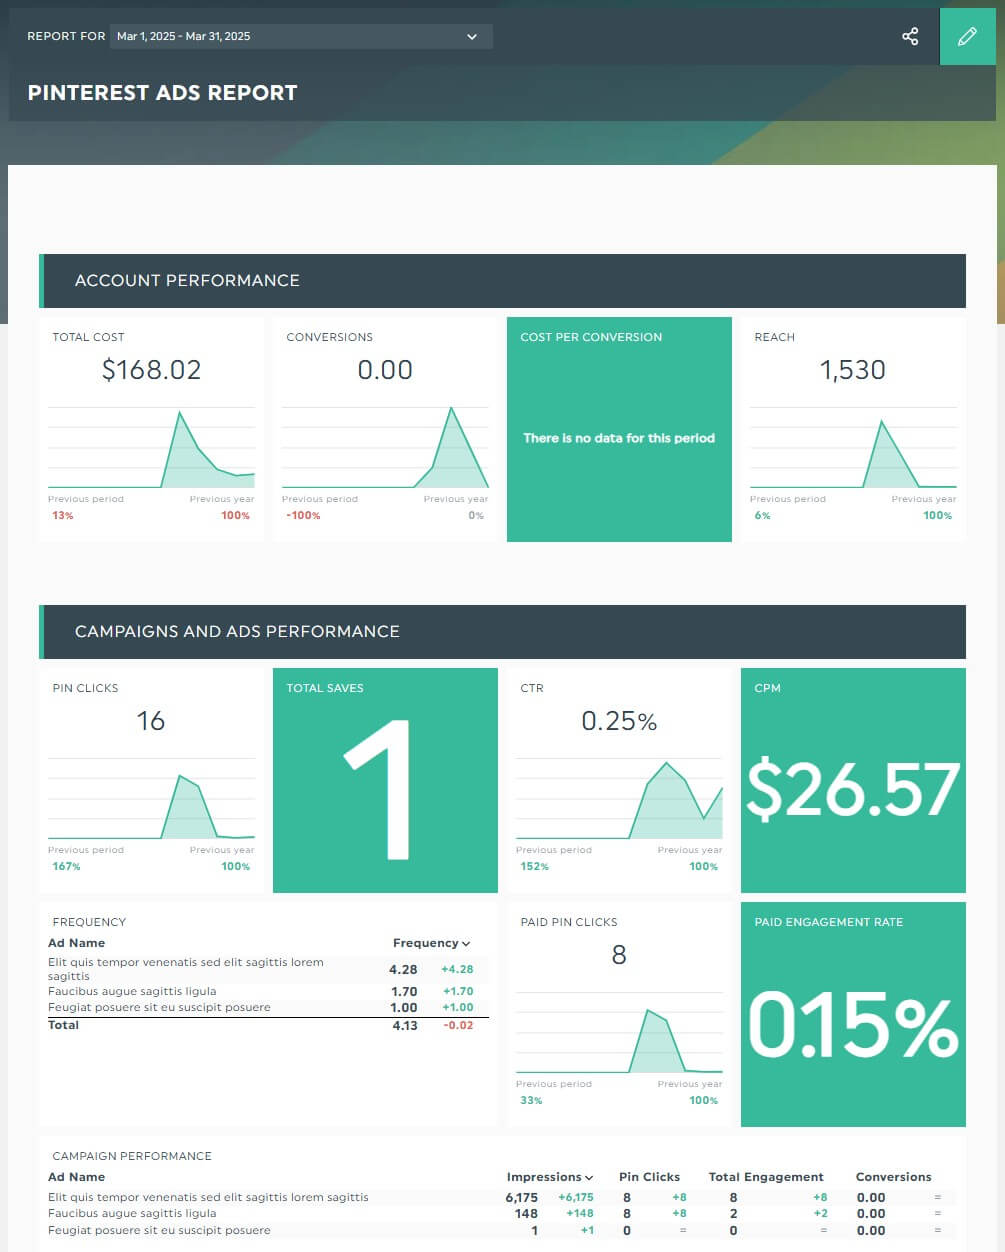
Grab this Pinterest Ads report template with your own data!
Pinterest Metrics vs. KPIs – What’s the Difference?
Metrics are data points that track the performance of a function. Examples include impressions, Pin clicks, and saves.
Key performance indicators (KPIs) are “big picture” metrics that track your progress in achieving business objectives. These include ROI and sales.
💡 HOW TO CHOOSE THE RIGHT PINTEREST KPIS?
Start with your marketing goals.
For example, if you're driving orders from your Pinterest Ads campaign, prioritize ROI and sales metrics to connect total ad spend with revenue.
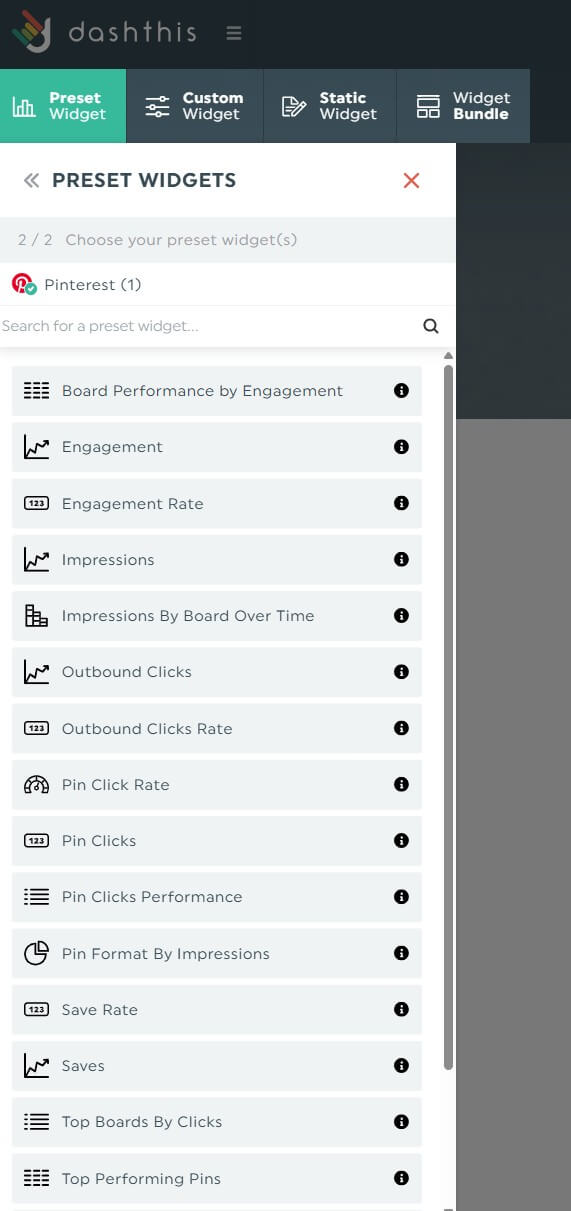
Tip: Pinterest analytics tools like DashThis come with built-in metrics and KPIs. Next time you're stuck on your metrics or KPIs, start with our templates. These metrics are sorted based on popularity.
To add these metrics, click Preset Widgets and select the ones that fit your campaign. Drag and drop them to form a cohesive look.
10 Most Important Pinterest Metrics to Track
To access engagement metrics and more in your Pinterest account, click the hamburger menu on the top left corner of the page > Analytics > Overview. To get more insights on audience demographics, apply filters (e.g., Age, Gender).
Key Pinterest organic metrics
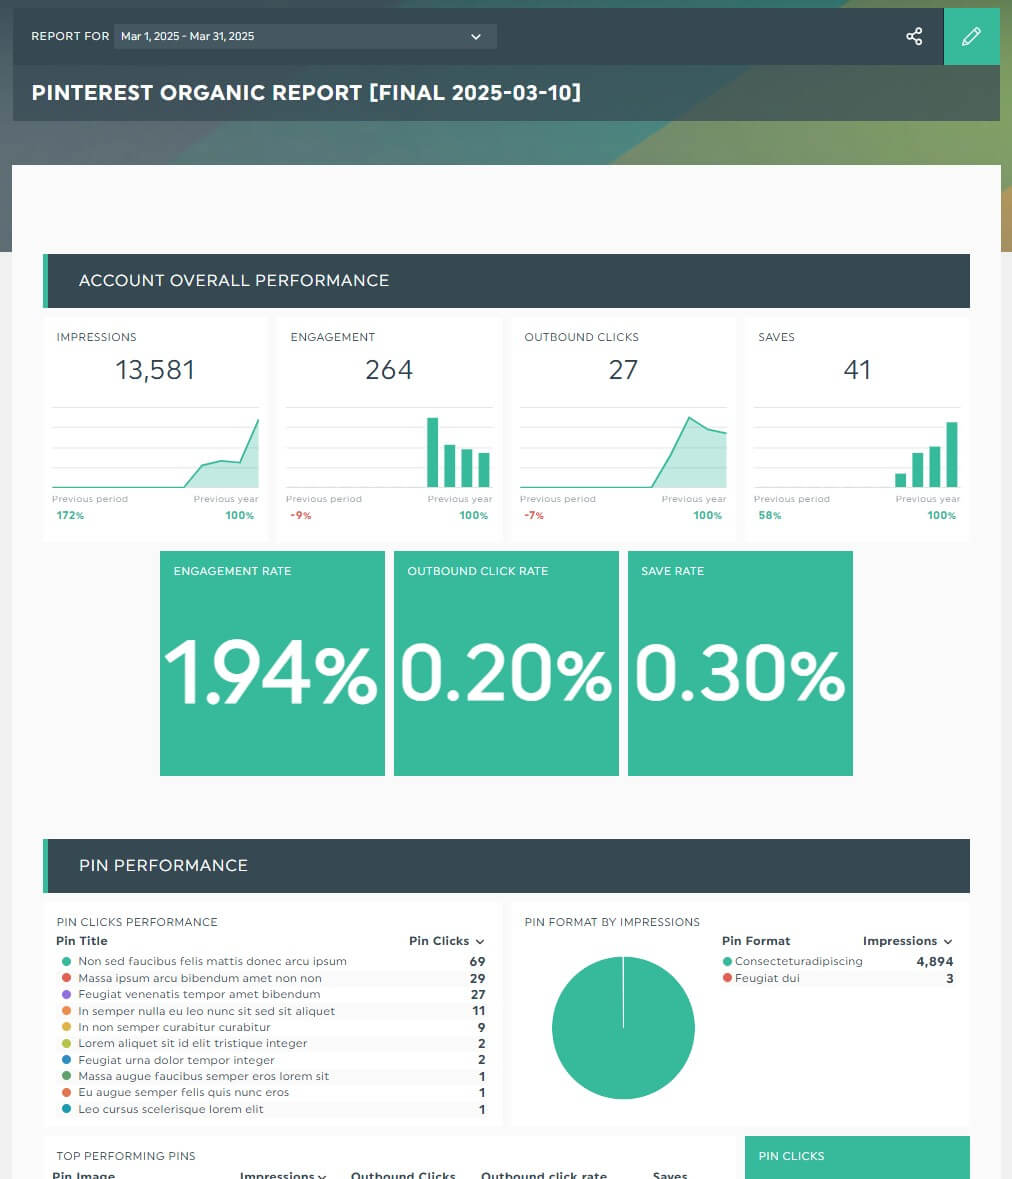
Grab this Pinterest organic report template with your own data!
(i) Impressions: Number of times your Pins or ads were shown.
(ii) Engagements: Total number of times people engaged with your Pins, including saves, outbound clicks, and Pin clicks. Measure it alongside engagement rate.
(iii) Outbound clicks: Total number of clicks that direct users to a website outside Pinterest. This metric is what you're really after. Another relevant metric is outbound click rate.
(iv) Saves: Number of times users saved your Pin to a board.
(v) Pin clicks: Number of clicks on your individual Pins or ads (opens in closeup). Track it together with Pin click rate.
Key Pinterest Ads metrics
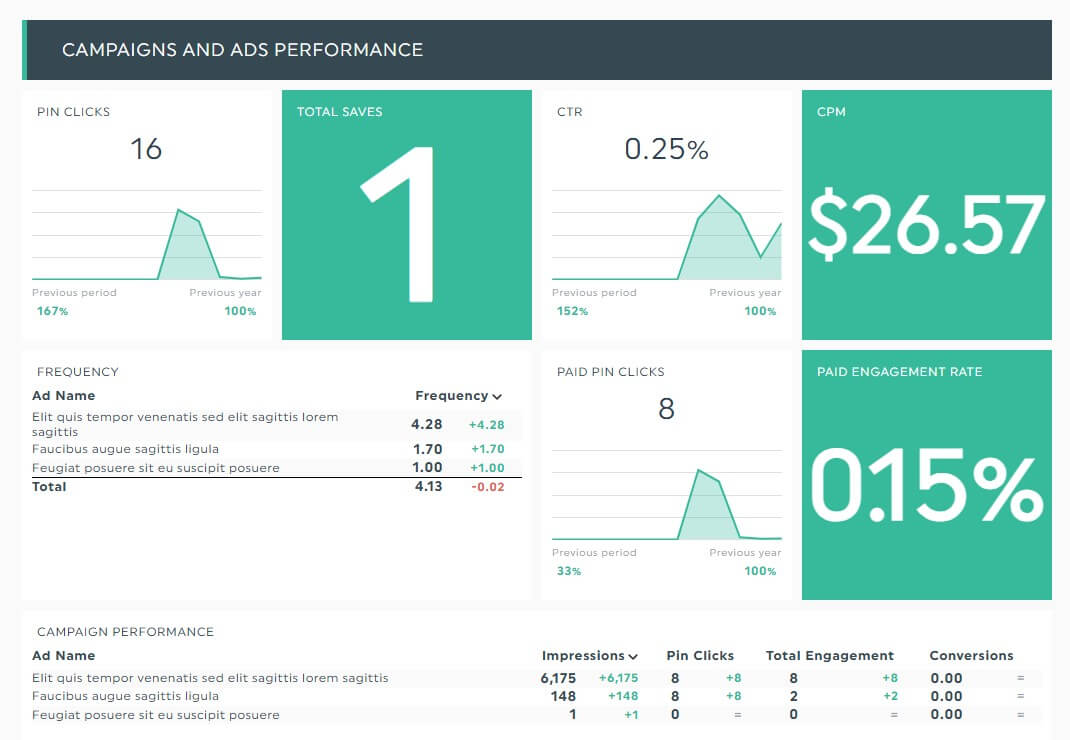
Note: You need a Pinterest business account to access ads metrics.
(i) Click-through rate (CTR): Percentage of users who clicked your ads.
(ii) Cost per click (CPC): The average cost for each ad click.
(iii) Cost per 1,000 impressions (CPM): Cost paid for every 1,000 times your ad is displayed.
(iv) Conversion rate: Percentage of users who complete a desired action (e.g., purchase, sign up) after clicking your ad.
(v) Total ad spend: Overall cost spent on Pinterest Ads.
Manually tracking these metrics wastes hours of your time. It's time better spent on optimizing campaigns.
DashThis is the easiest social media analytics reporting tool. Gather all your Pinterest data into one beautiful report automatically, analyze your Pin performance at a glance, and save hours of your time. Start your free 15-day trial today.
How to Use Pinterest Analytics to Improve Your Performance
You've found the Pinterest Analytics dashboard, but you're unsure what to do next. Here are five ideas to make the most out of your data.
1. Identify top Pins
Are your best-performing video Pins original and created by you or Repins from other brands? What topics resonate with your highest-value audience segments? What comments are users leaving on your Pins? What are they saying?
Your analytics reveal these insights, helping you determine the next move in your content strategy.
2. Conduct A/B tests
Generally speaking, A/B tests only work when you have large amounts of data (like millions of Pinterest impressions). For small businesses, go with your instincts.
Experiment with different Pin formats and ad creatives to determine which drives maximum engagement and conversions. As you measure the results, consider these questions:
- How many video views did your vertical video generate compared to square video?
- Which drives more link clicks: Raw images or Pinterest templates with design elements and text overlay?
- Your most popular Pins are Image Pins. Should you double down on this winning format or diversify by allocating budget to videos and collages?
Tip: Dealing with a skeptical client (or management) about A/B test results? Automated reporting tools like DashThis transform raw data into easy-to-understand graphs and charts that validate your strategy.
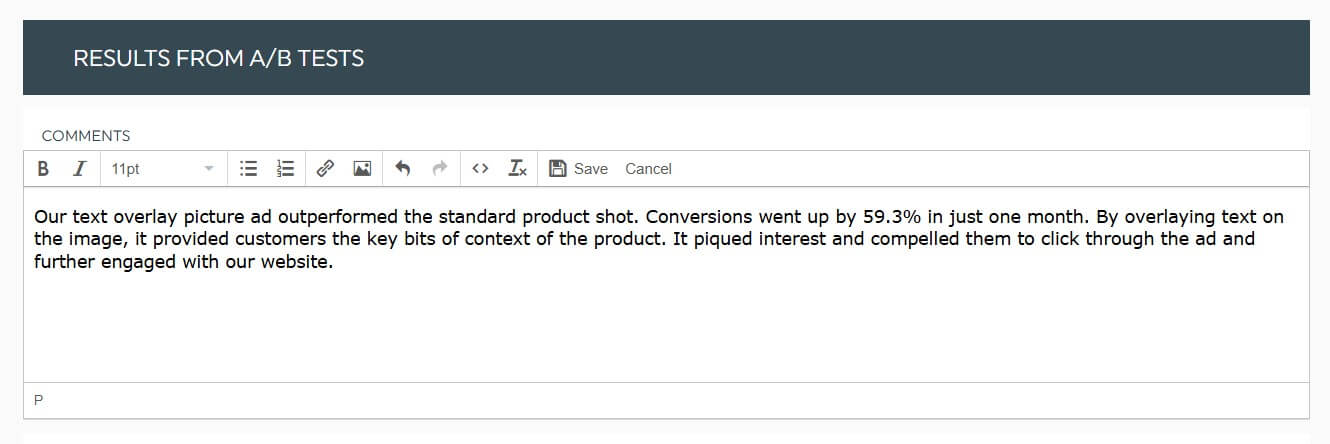
Let's imagine the client sells a novel product. Instead of using a standard product shot in the ad campaign — a format the client is used to — you want to experiment with pictures with text overlay.
In your A/B test, you confirmed your hypothesis with hard data. By overlaying text on the image, you instantly communicated critical context and benefits to customers. Conversions surged within the first week.
To include this finding in your report, click Static Widget from the drop-down menu > Comment. Share your discovery in the text box.
Click Save.
This text box will be included directly in your report, allowing the client to review everything in one place.
3. Improve targeting
Even the most compelling Pin or ad will fall flat with the wrong audience.
Using Pinterest demographic insights, segment your total audience by engagement, interests, location, actalikes (similar to Facebook's lookalike audience), or even keywords. Your content will resonate better and drive action.
4. Adjust your ad budget
Reallocate your budget to campaigns with the highest ROI.
Example: You remove middle-of-the-funnel (MoFu) campaigns from your Pinterest marketing strategy after discovering users either view the ads or click through your website. As a result, you allocated more budget towards top-of-the-funnel (ToFu) and bottom-of-the-funnel (retargeting) campaigns.
5. Watch for trends and shifts
Consumers consider a myriad of factors before making informed decisions — trends are one of them.
Whether it's the growing popularity of mountain travel destinations or primary play in home spaces, you'll want to catch them before they take off.
Besides your Pinterest analytics dashboard, check out these three sources for trends or seasonal engagement shifts:
- Industry reports (e.g., Pinterest Predicts, McKinsey)
- Audience research tools like SparkToro
- Discovery platforms like Exploding Topics and BuzzSumo
Monitor these resources weekly before your competitors capitalize on them.
Once you spot an opportunity, tailor your campaigns accordingly. A furniture eCommerce store might double down its photo door mural ads campaign if murals are trending, for instance.
Automate Your Pinterest Analytics Reports Today
By measuring (and understanding) your Pinterest performance daily, you get closer to compelling browsing shoppers to make a purchase.
DashThis is the easiest automated reporting tool for social media marketing, Google Analytics, email, SEO, and more.
Gather all your Pinterest organic and ads data into one centralized dashboard. Customize your reports with metrics that matter most to you, schedule them automatically by date range, and gain back hours of your time.

Read More

Don’t miss out!
Follow us on social media to stay tuned!
Automate your reports!
Bring all your marketing data into one automated report.
Try dashthis for free