How to Choose Between Reach and Impressions for Better Campaign Results

Impressions vs Reach at a glance:
| Metric | Meaning | When to Prioritize |
|---|---|---|
| Reach | Number of unique people who see your content | Brand awareness campaigns, new product launches |
| Impressions | Total times your content is displayed | Retargeting, market launch campaigns, message reinforcement campaigns |
Key distinction: While the same person can generate several ad views, reach specifically measures unique viewers or unique accounts. For example, if a potential customer sees your ad five times, you’ll record five ad impressions but your reach stays at one since you’ve connected with just one viewer.
Reach vs Impressions Explained (Coffee Shop Example)
Table of contents
- Introduction
- What’s the difference between reach and impressions in digital marketing?
- How does reach vs impressions measure up in different channels?
- What your reach and impressions data is telling you about your social media marketing strategy
- Automate your reach & impressions reporting with DashThis
Introduction
Are your ads reaching new potential customers, or are you annoying the same people over and over? This distinction between finding fresh eyes versus repeat exposure is exactly what separates reach from impressions, and getting it wrong can significantly reduce your campaign effectiveness and waste a substantial portion of your ad budget.
Understanding these two metrics is essential for any digital marketer. They also help you evaluate how other metrics like engagement or conversions perform across your campaigns.
These two metrics frequently overlap in reports, and marketers often swap the terms interchangeably. However, this creates problems when measuring performance. Misunderstanding these basic metrics puts your marketing strategy at risk by optimizing for incorrect goals. If you've often found these terms confusing or need a refresher, use this guide to help you.
What’s the difference between reach and impressions in digital marketing?
What is the reach metric in marketing?
The number of unique people who see your digital content. These can be a social media post, paid ad or video content. This metric shows the number of unique users have seen your brand and helps you understand the size of your audience.
What is the number of impressions in marketing?
Impressions measure the total number of times people see your content.
Which is more important? Reach or impressions?
The best metric to use varies based on your goal. Are you trying to reach the widest audience or maximize ad recall or engagement?
Prioritize reach to:
- Build brand awareness in a new demographic market: Higher reach means more people are seeing your content, which tells you how effectively your brand awareness campaigns are performing.
- Introduce a new product: When you're launching something new, prioritize reach to maximize the number of people who discover your product.
Prioritize tracking impressions to:
- Stay memorable to your current customers: Research shows people typically need to see an ad seven times before making a purchase. By tracking total impressions, you can adjust how often your ads appear to the same viewers, helping them remember your brand.
- Reinforce a complex marketing message: When running ad campaigns for technical products or those built on emotional appeal, multiple exposures help audiences grasp and respond to the message.
All this can be pretty confusing, so let’s use an analogy to clarify the differences between these terms.
Imagine you’ve put up a giant neon sign as part of a marketing campaign to draw people to your storefront in a busy shopping mall. To measure its effectiveness, you would track the following.

Image source: Unsplash
Reach is the number of different shoppers who walked past your sign at least once today, whereas impressions is the total number of times your sign was seen. If the same shopper walks past your sign three times in one day, that counts as three separate impressions, even though it's just one person seeing your sign multiple times.
How does reach vs impressions measure up in different channels?
Here's where things get a bit tricky. While reach and impressions have clear definitions, each platform calculates and shows them differently. Let’s break down what you need to know about the major social media platforms.
Social media metrics
- Facebook and Instagram: separates paid and organic reach on Facebook pages and ads. Facebook also counts reach over different time periods: daily, weekly and the past 28 days.
- LinkedIn: tracks impressions separately for sponsored and organic content
- YouTube: tracks both impressions and video views differently. An impression counts when someone sees your video thumbnail, while a view only counts when they actually watch the video.
- X (Twitter): lacks organic reach tracking, and its impression metrics count your own post views plus any glances at a piece of content, no matter how brief.
Other digital marketing channels
- Email marketing: Uses opens and unique opens instead of impressions and reach
- Google Ads: prioritizes impressions in its metrics. While Google’s algorithm relies on statistical models to calculate reach data, this can result in less precise measurements compared to other platforms.
What your reach and impressions data is telling you about your social media marketing strategy
What is considered high or low reach or impressions? While exact numbers depend on your platform, industry, and whether you're comparing organic or paid metrics, here are some guidelines to find your own benchmarks:
Start with your own historical data: Compare previous social media campaign performance to establish your personal benchmark and KPIs. Your own historical performance provides the most accurate baseline since it reflects your brand and audience. Tracking historical metrics across platforms and campaigns can be challenging. DashThis stores 13 months of campaign history, letting you measure current reach and impressions against past periods to identify performance patterns.
Check industry standards: Review benchmark reports to understand what defines strong performance in your platforms and industry. Socialinsider data puts average organic reach for Instagram and Facebook at 3.5% and 1.2% respectively, while LinkedIn posts reaching roughly 9 impressions per 100 followers based on RivalIQ data. When your metrics surpass these industry averages, you know your content is performing well.
Study what works for others in your industry: Social media analytics tools like Hootsuite and Sprout Social can help track your competitors’ social media performance, including their content reach and engagement rates.
When your campaigns are performing well
High reach and high impressions
When you’ve got healthy results, it means your content is both reaching a large audience and being seen multiple times, but not enough to cause significant content fatigue by being seen too often. This combination typically drives strong total views across your campaigns, so you’ve got good news to share with your client.
When reach and impressions are growing steadily
This is another healthy scenario, showing your campaign is scaling effectively without fatiguing your audience by showing your ad too often. Your brand is steadily growing its reach among interested audiences.
When your campaigns have room for improvement
Here are those scenarios and what to do next with your client.
High reach and low impressions
This means you’re reaching many people but each person is only seeing your content once. Especially if you’re trying to introduce something new or enter a new market, this means your content isn’t seen often enough for it to be memorable.
To address this, examine these campaign elements.
Budget: Are you investing enough to connect with your full audience?
Duration: Is your campaign running long enough for your ads to reach people? Consider adjusting your campaigns by increasing ad frequency to help audiences better retain your message.
Low reach, high impressions
Showing content repeatedly to the same audience can lead to viewer fatigue. You'll notice this reflected in key metrics: lower click-through rates (CTR), higher frequency counts, and dips in conversion rates.
Consider expanding your audience targeting or reducing your ad frequency cap to reach more people.
Pro tip: When presenting this to clients, frame it positively: "We're building strong brand recall with a core audience. Now, let's expand targeting to reach more people for your campaign.
When you see red flags in your campaign performance
When monitoring reach and impressions, certain patterns may signal potential issues that need your attention.
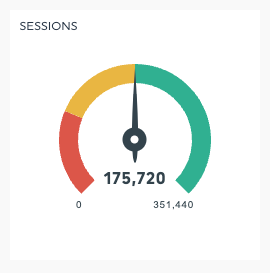
Tip: Set up gauge widgets in DashThis to track reach and impression metrics against your goals. These widgets help you spot and fix potential issues early.
Low reach, low impressions
This usually means there's something fundamentally misaligned in your campaign or content. Maybe your budget is too tight, you're targeting the wrong people, or your ad creative just isn't resonating. When this happens, tell your client: "Our campaign needs some immediate attention. Let's examine whether we need to adjust our targeting, bump up the budget, or try a different approach with our creatives.
Flat reach, impressions climbing
Rising impressions may seem positive at first, but repeatedly showing ads to the same audience can lead to fatigue. When people start tuning out, it’s time to make changes. Consider expanding your target audience, managing how often each person sees your ad, or testing new creative approaches to keep your message fresh.
Flat impressions, reach climbing
This scenario means you're reaching a wider audience but only introducing yourself once. It's great for awareness, but not so great if you need people to remember your message. In this case, tweak your budget or ad frequency to make sure your ads get shown more often and at the right time.
Automate your reach & impressions reporting with DashThis
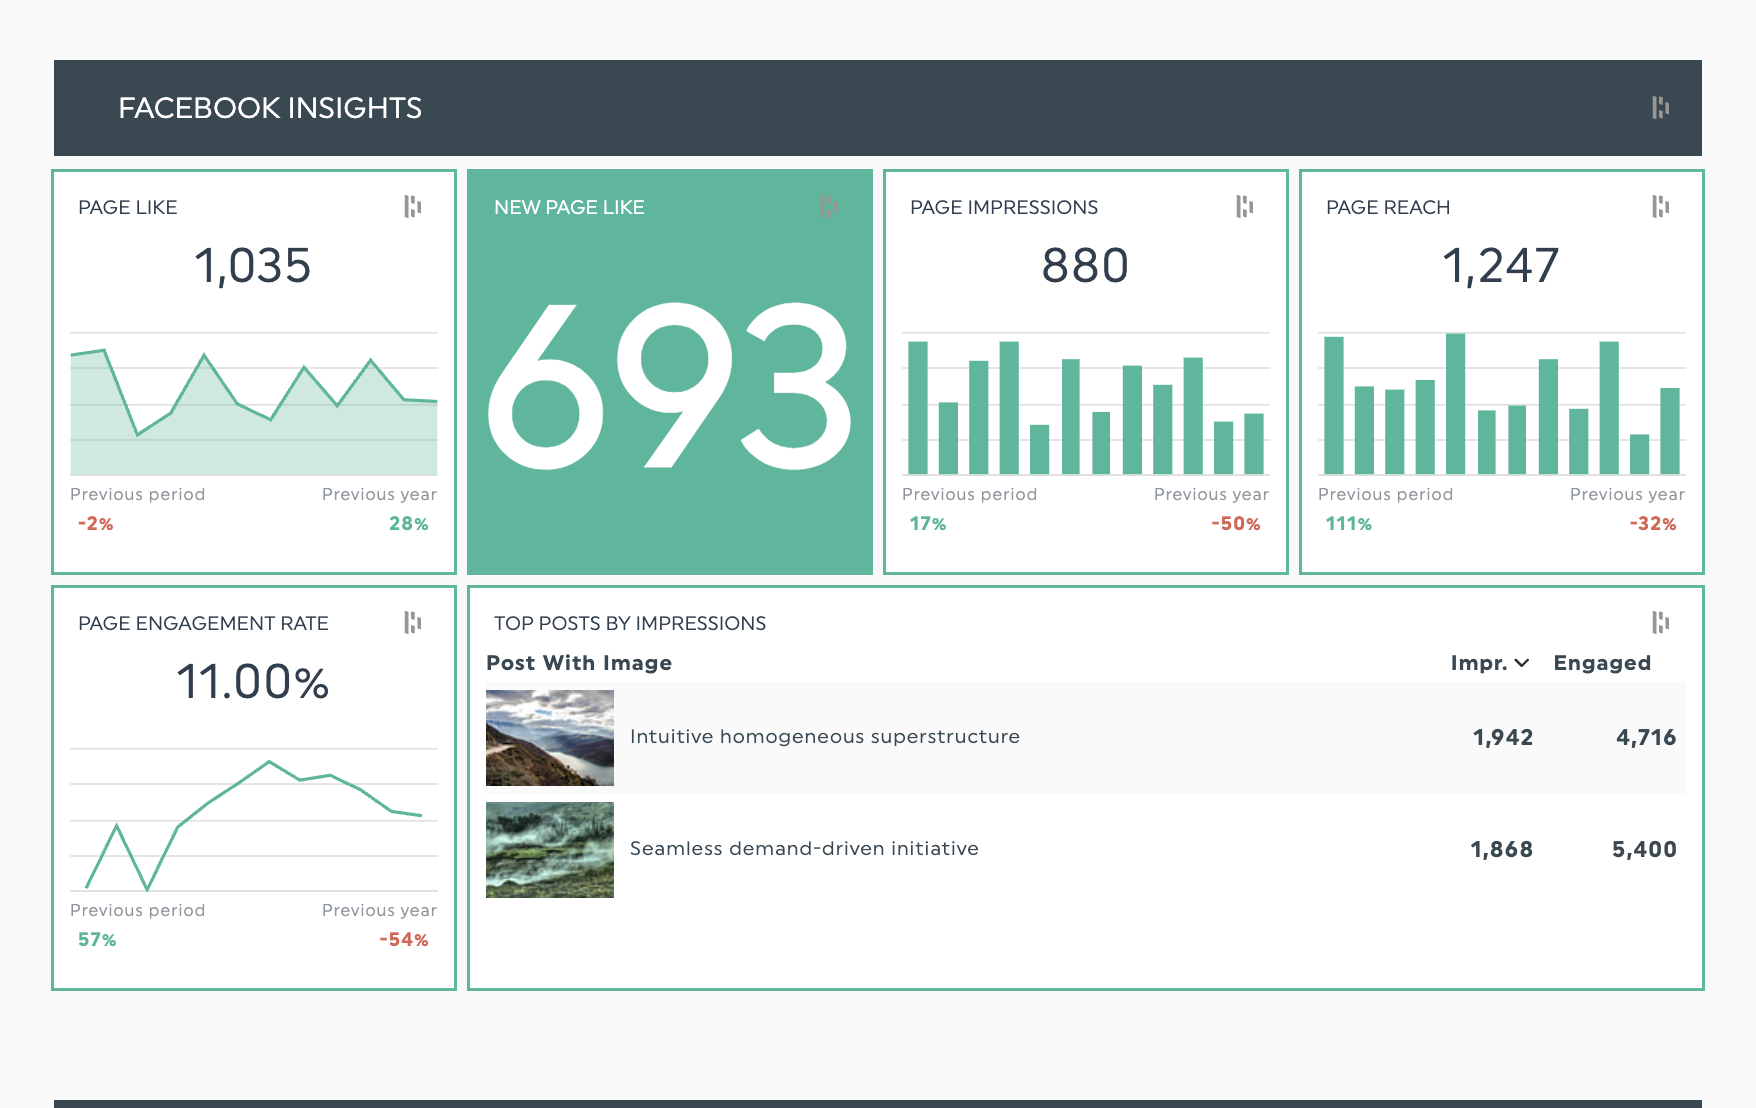
Stop manually pulling reach and impressions data from multiple platforms. DashThis integrates with over 34 digital marketing platforms, including Facebook Ads, Google Ads, LinkedIn, and more, bringing your social media metrics and digital marketing analytics together in a single, auto-updating dashboard.
It’s perfect to compare reach and impression data between social networks, showing how expanded reach translates to engagement, and measuring brand awareness campaign performance on different platforms.
After you’ve signed up for your free DashThis account, here’s how to get started.
- Select your report template: Pick the digital marketing report template or social media template to get started. Want something different? Build your own custom report or start from scratch.
- Connect your data sources in one click
- Add reach & impressions widgets: Drag and drop reach and impressions from your connected platforms. Add your other metrics for comparison as well.
Get this social media report template with your own data!
Once you've got your basic reach and impressions tracking set up, DashThis becomes even more powerful for ongoing campaign management. Here's how it can automate your reporting workflow.
Save time with reusable templates: Build custom dashboard templates featuring your essential metrics and KPIs. Apply them to new campaigns or clients with just a few clicks to streamline your digital marketing reporting process.
Get cross-platform insights instantly: Compare Facebook reach and Google Display impressions to measure audience exposure across platforms. Track how LinkedIn organic and paid social content performs to pinpoint where your message connects best. These metrics show whether your high impressions come from repeat views, beneficial for brand recall) or new audience growth which is aligned with awareness goals.
Ready to streamline your reporting? Start your free 15-day trial of DashThis and transform how you track reach and impressions across all your campaigns.

Track your social media efforts with DashThis
Read More

Don’t miss out!
Follow us on social media to stay tuned!
Automate your reports!
Bring all your marketing data into one automated report.
Try dashthis for free