How to Find Your Most Valuable Website Traffic by Hour in Google Analytics

In the world of marketing, we live and thrive off of data. We use data to measure the success of our endeavors and help us formulate our next steps.
This is part of the reason why we, as marketers, are constantly craving more data, because the more data we have, the more strategic we can be in our marketing.
As most of us know, Google Analytics is a great hub of information when it comes to our websites. It allows us to see traffic sources, regions and more, but did you know Google Analytics can also provide you with website traffic by hour?
Why You Should Be Looking at Website Traffic by Hour
Digging further into your website traffic and looking at hourly traffic allows you to get a better understanding of how and when people are using your website.
Once you gather your hourly traffic data, you may be able to make better-informed decisions regarding:
- When to post blog content
- When to make major or minor changes to your website
- How your target audience searches and uses the internet
Thus, by understanding the hourly traffic of your target audience and when they access your website you can develop a better overall customer profile.
For instance, if you have a restaurant and you see that you are getting a lot of traffic to your website around lunchtime, it may help you segment your audience further into a lunch and after-work crowd, or it may tell you that you might want to offer a lunch delivery service during this time of day.
The information you gather from looking at website traffic by hour can not only help determine what you do on your website, but can also inform other aspects of your marketing, including paid advertising, social media postings, search engine optimization, and perhaps overall business practices, such as follow-up communication, business hours and more.
Now that you have a better understanding of how reviewing hourly traffic can be helpful, let’s take a look at how to actually do it.
In Google Analytics, there are actually three ways that you can track your website traffic average by time of day:
- Timelines
- Secondary Dimensions
- Custom Reports
Before we elaborate, however, it’s important to note that while looking at website traffic by hour can aid with marketing and overall business practices, you should not rely on it too heavily.
I recommend using hourly to complement all of your other digital marketing and website data. Otherwise, you might end up missing the big picture, or in the case of marketing, the obvious solutions.
Using Google Analytics Hourly Timeline to Find Traffic by Hour
By logging into your Google Analytics account, you can use nearly any reporting view to check hourly traffic and gauge performance.
First, choose the time frame you wish to review and select it in your date range. The default setting for the timeline will likely be by day, so simply select the Google Analytics hourly tab on the timeline and you should be able to see the traffic average per the time of day.
It should look something like this:
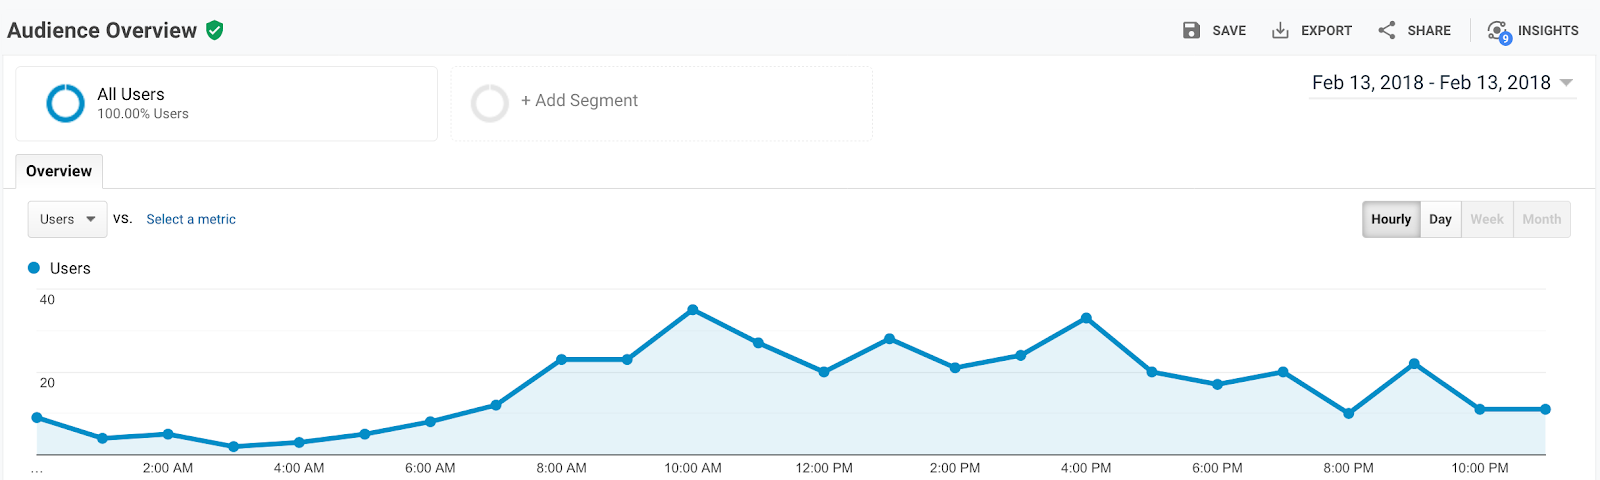
As you can see, by looking at the Google Analytics hourly tab we can note that traffic begins to pick up around 6 a.m., with a sharper increase in traffic around the 8 a.m. hour.
As a marketing agency, we can tell by this information that our audience is most likely visiting our website while they are at their own offices. This information can help us determine how and when we want to market to this audience moving forward, especially if we track and review the hourly traffic data over a period of time.
While the Google Analytics hour of day format is a great and simple solution for retrieving hourly traffic data, there are several other tools that can give you a bit more insight into your website’s hourly traffic.
Secondary Dimensions in Google Analytics by Hour
If you don’t currently utilize secondary dimensions in your website analysis, now is the perfect time to start. Secondary dimensions allow you to further segment an already specific section of your website data to get an even deeper analysis.
As an example, let’s look at organic traffic by the hour for this website. To get to this point, the path is Acquisition > All Traffic > Source/Medium.
Once you’ve followed that pathway, click on Secondary Dimension > Time and this should open an entire menu of options including examining information by hour.
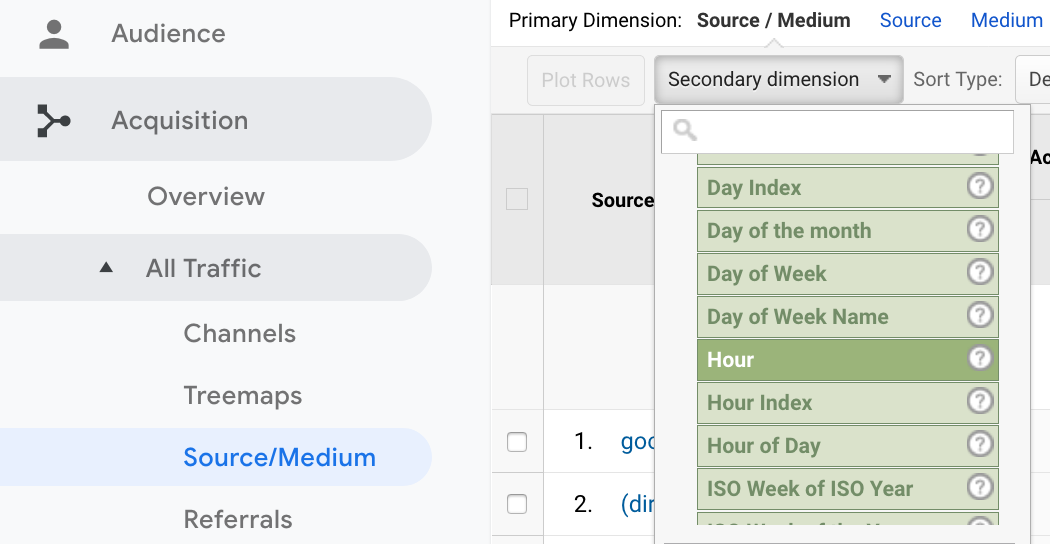
Select the Google Analytics by hour option and you will be able to see the breakdown of organic website traffic by hour.
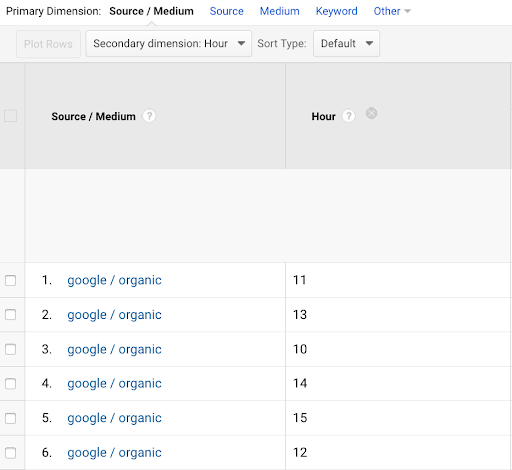
As you can see, from looking at the Google Analytics traffic by hour breakdown, this particular website receives the majority of its traffic around midday and into the afternoon.
Custom Time of Day Reports in Google Analytics
The final method of finding website traffic by hour that we’ll take a look at is creating custom reports, specifically time of day reports in Google Analytics.
This type of hourly traffic report is ideal for larger date ranges where there’s significantly more data to sift through.
To create a custom Google Analytics time of day report, first select Customization in the right-hand menu and click on Custom Reports.
Select the New Custom Report button and a screen should appear that allows you to choose which metrics and dimensions you want to be included in your report.
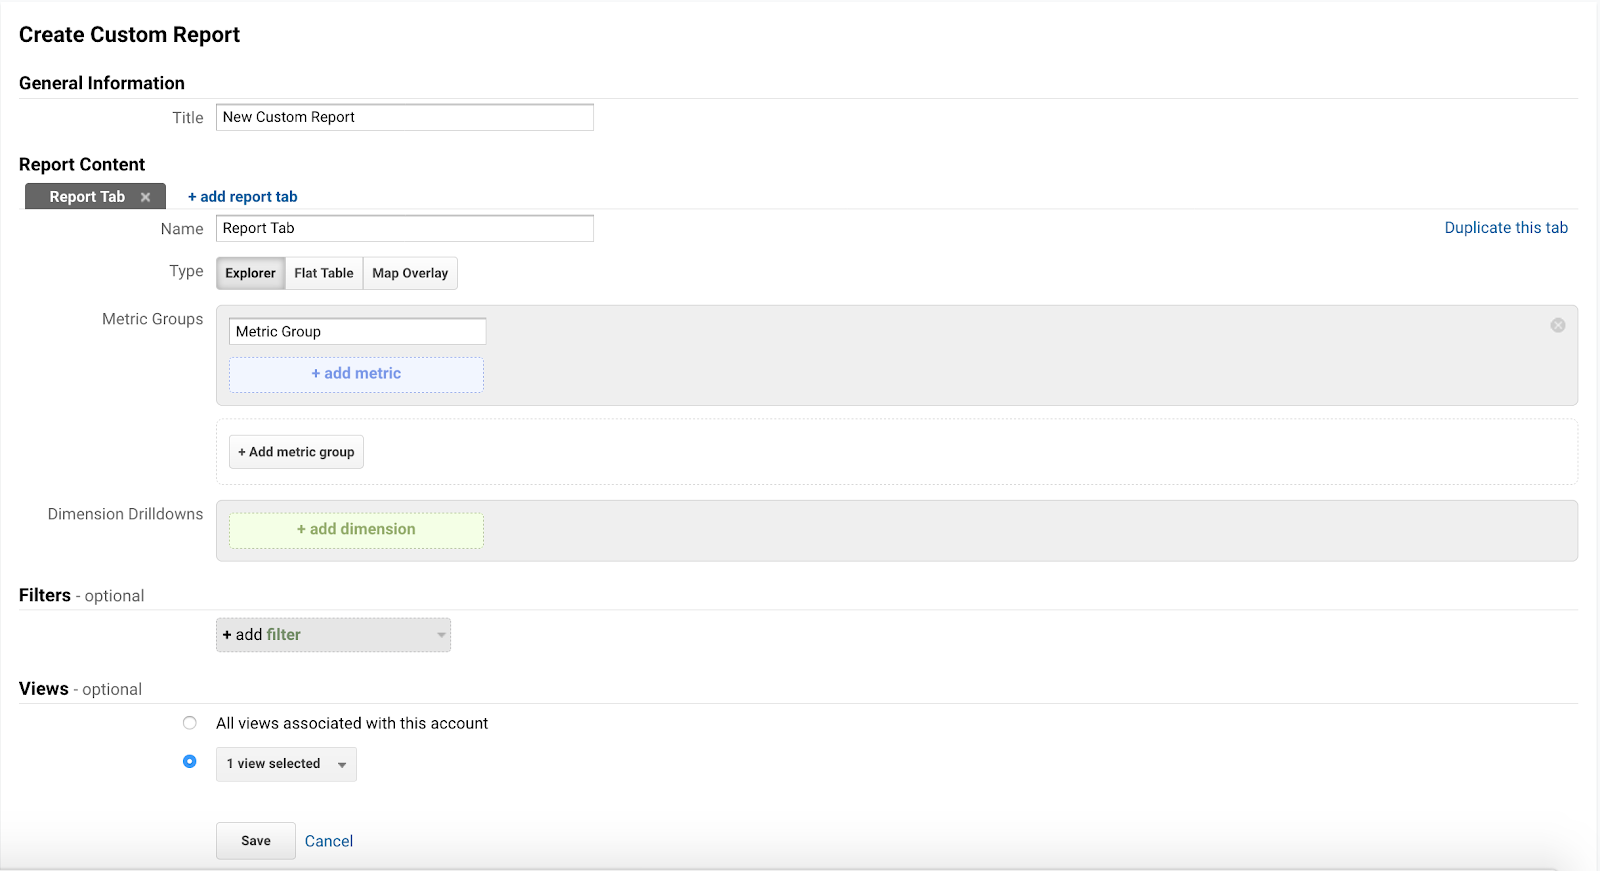
Fill out whichever metrics you wish to track, but when you get to the Dimension Drilldowns section, choose Hour in order to track the hourly traffic. Once you save your report, you should be able to see hourly traffic data averaged across the selected date range.
What to Do with Your New Hourly Data
As with all data, hourly traffic can help you with your planning and execution of your marketing initiatives. By creating a time of day report in Google Analytics or even just checking your website traffic by hour in the timeline, analyzing this data over time can help you identify trends in your website’s traffic.
While discovering these trends may help with determining the best times to post content or providing you a little extra insight into your target audience, it’s important to remember that this data is just a tiny part of improving your overall marketing efforts.

Ready to automate your reporting?
Read More

Don’t miss out!
Follow us on social media to stay tuned!
Automate your reports!
Bring all your marketing data into one automated report.
Try dashthis for free