4 KPI Scorecard Examples to Track Your Most Important Metrics

Are you one of the 21% of marketers who struggle to demonstrate the ROI of your marketing activities?
Proving the ROI of your hard-won efforts boils down to two main things: aligning with the sales department and tracking your data with a robust scorecard software tool.
This guide focuses on the latter.
We’ll show you how to create a report quickly and share four KPI scorecard examples to track your overall performance at a single glance.
- What is a KPI scorecard?
- 4 KPI Scorecard Examples
- - Sales Report Template
- - Digital Marketing Report Template
- - Social Media Report Template
- - Ecommerce Report Template
- How to Create a KPI Scorecard with DashThis
- Grab Your Free Balanced Scorecard Template Now
What is a KPI scorecard?
A KPI scorecard is a quantitative record that measures progress towards a critical key performance indicator (KPI) [e.g., improving strategy execution].
The balanced scorecard (BSC), for starters, is used to provide a comprehensive look at a business. Stuck? These four KPI examples spanning different areas will get you started:
- Financial: Market share, cash flow, and revenue growth
- Customer: Customer retention and net promoter score (NPS) to measure customer satisfaction
- Internal processes: Operating efficiency, cycle time
- Learning and growth: Process time to maturity, percentage of product that generated X% of sales
While DashThis isn’t exactly a balanced scorecard software, it’s still valuable in measuring your overall business performance. Note the business KPI dashboard below that shows how each scorecard KPI paints a cohesive picture of your business.
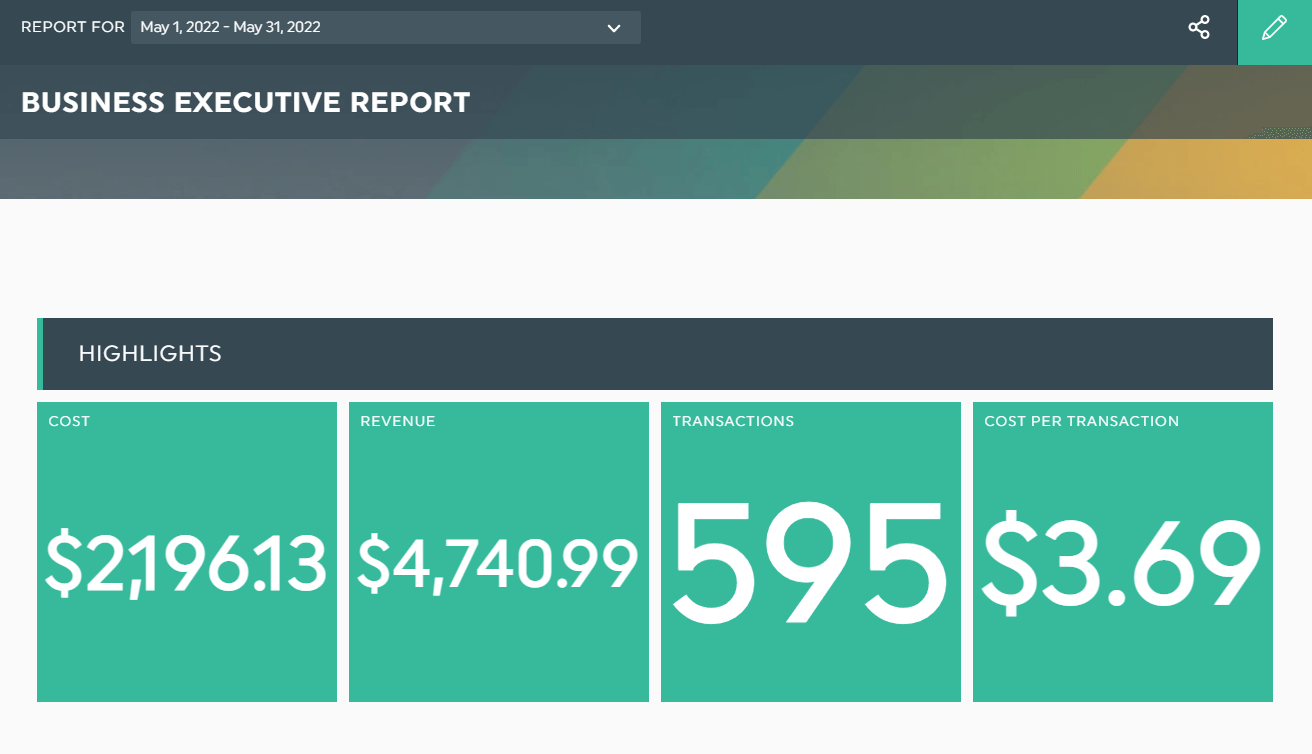
Grab this KPI scorecard template with your own data!
Stack up the total revenue against the total cost of doing business, pinpoint the exact source that attracts the biggest revenue, and assess if your strategy map is attainable with little to no guesswork.
Take your pick from 30+ free dashboard templates to speed up your decision-making. Start your 15-day free trial today.
4 KPI Scorecard Examples
A scorecard helps you gauge how far along you are in hitting your strategic goals. You can do no wrong with these four balanced scorecard examples.
Sales Report Template
Sales reports measure your sales activities, including the number of sales-qualified leads, conversion rate, and total sales.
Note how the KPI scorecards below—total store sales and total advertising cost—help the sales manager review the profit margin and ROI.
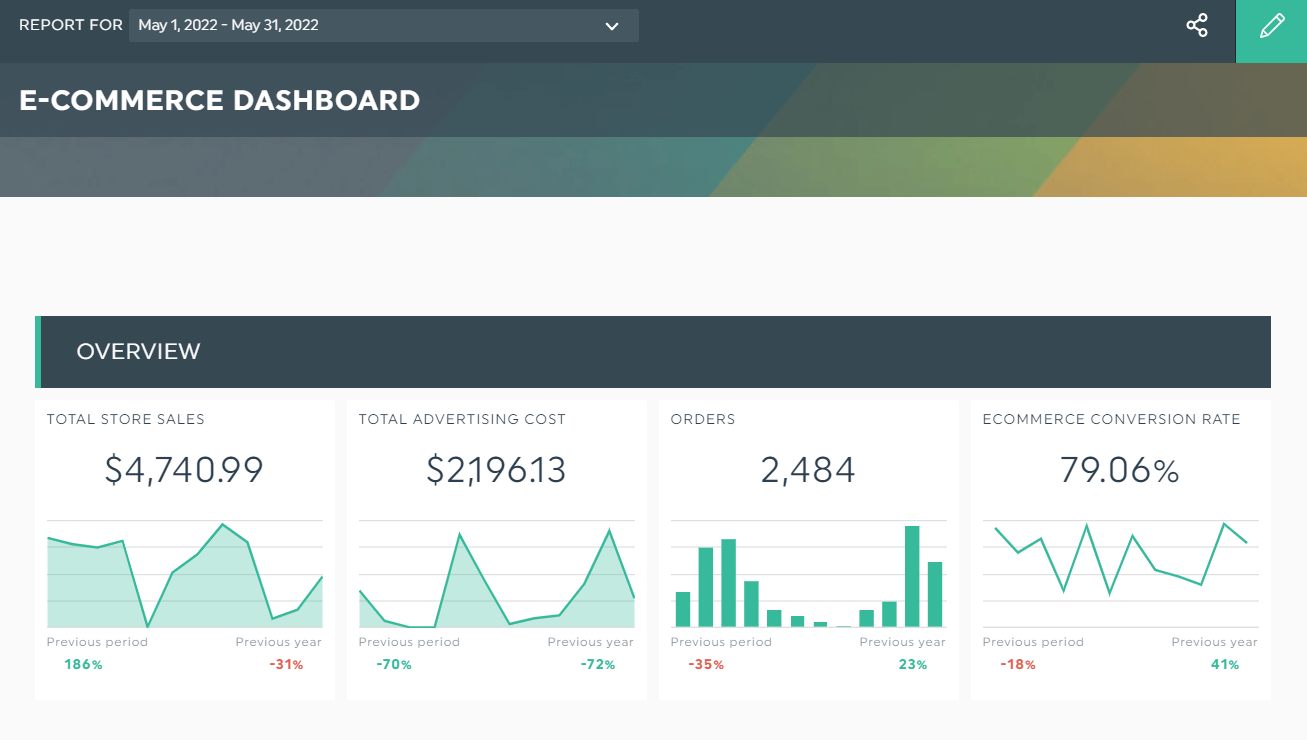
Grab this sales report with your own data!
The remaining sales metrics dig deeper into the different channels, analyzing which ones perform the best. Using this info, the sales manager (or client) can eliminate unnecessary expenses from the sales budget in a jiffy.
Tip: Give clients real-time access (via automatic email dispatch) to your data visualization dashboards. Click Sharing Options > Copy Shareable Link.
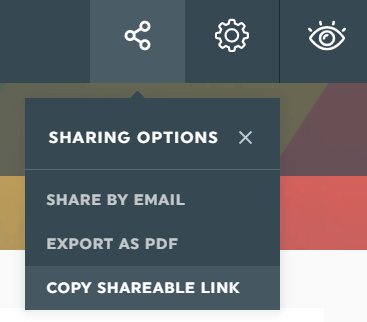
Alternatively, export it as PDF.
Start your 15-day free trial to automate reporting today.
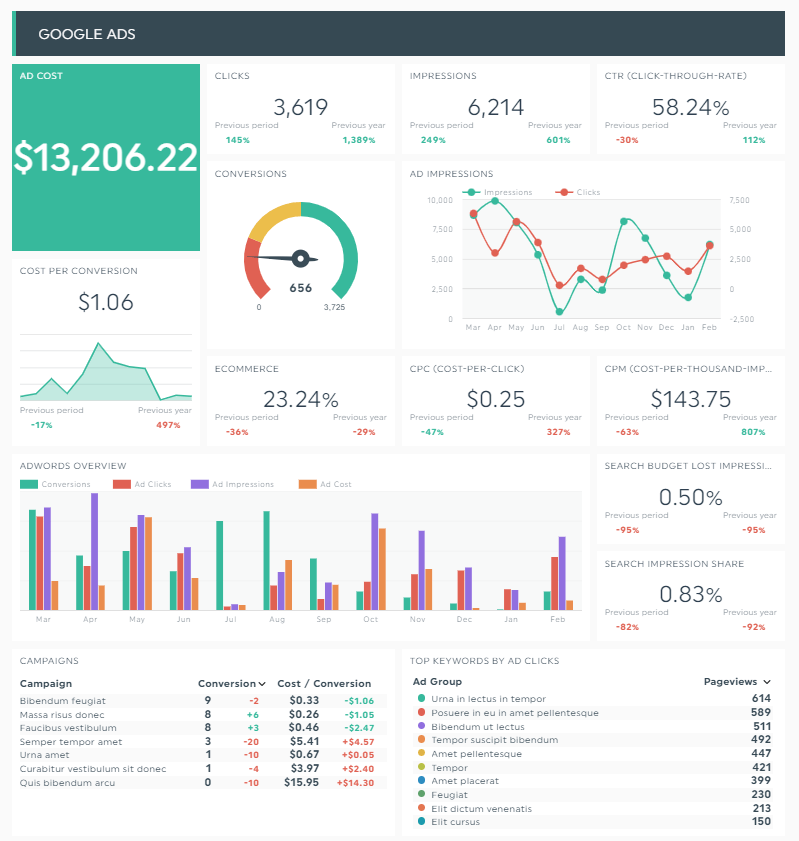
Digital Marketing Report Template
Digital marketing reports track how your in- and outbound channels attract users to your website. With these varied performance metrics, you can see which specific page or campaign leads to direct revenue.
Grab this digital marketing report with your own data!
The next time you need to get buy-in for a new marketing campaign, show this dashboard as proof.
Social Media Report Template
Social media reports identify your best-performing platforms, so that you can triple down on what works and attract your best customers today.
Whether your strategic objectives are increasing brand awareness, driving targeted traffic to your website, or generating quality leads, the report below comes in handy.
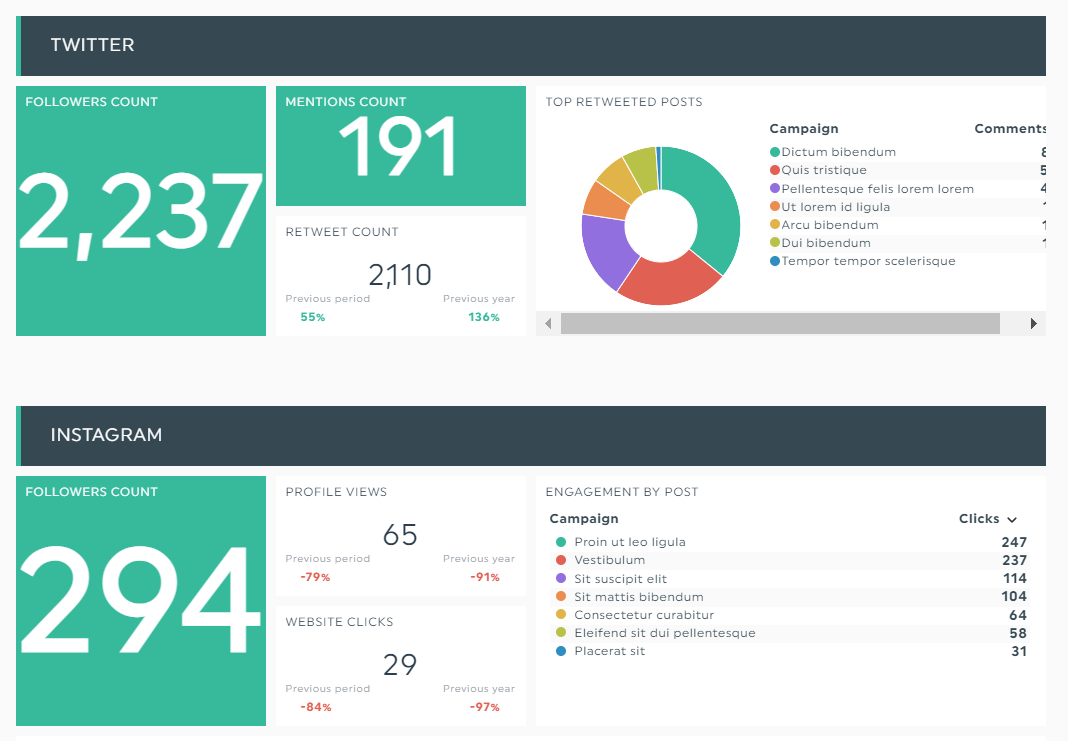
Grab this social media report with your own data!
Tip: Combine your total social media engagement in one widget to show clients the overall performance. Hover to the widget you want to merge and click Edit Widget > Merge Widgets.
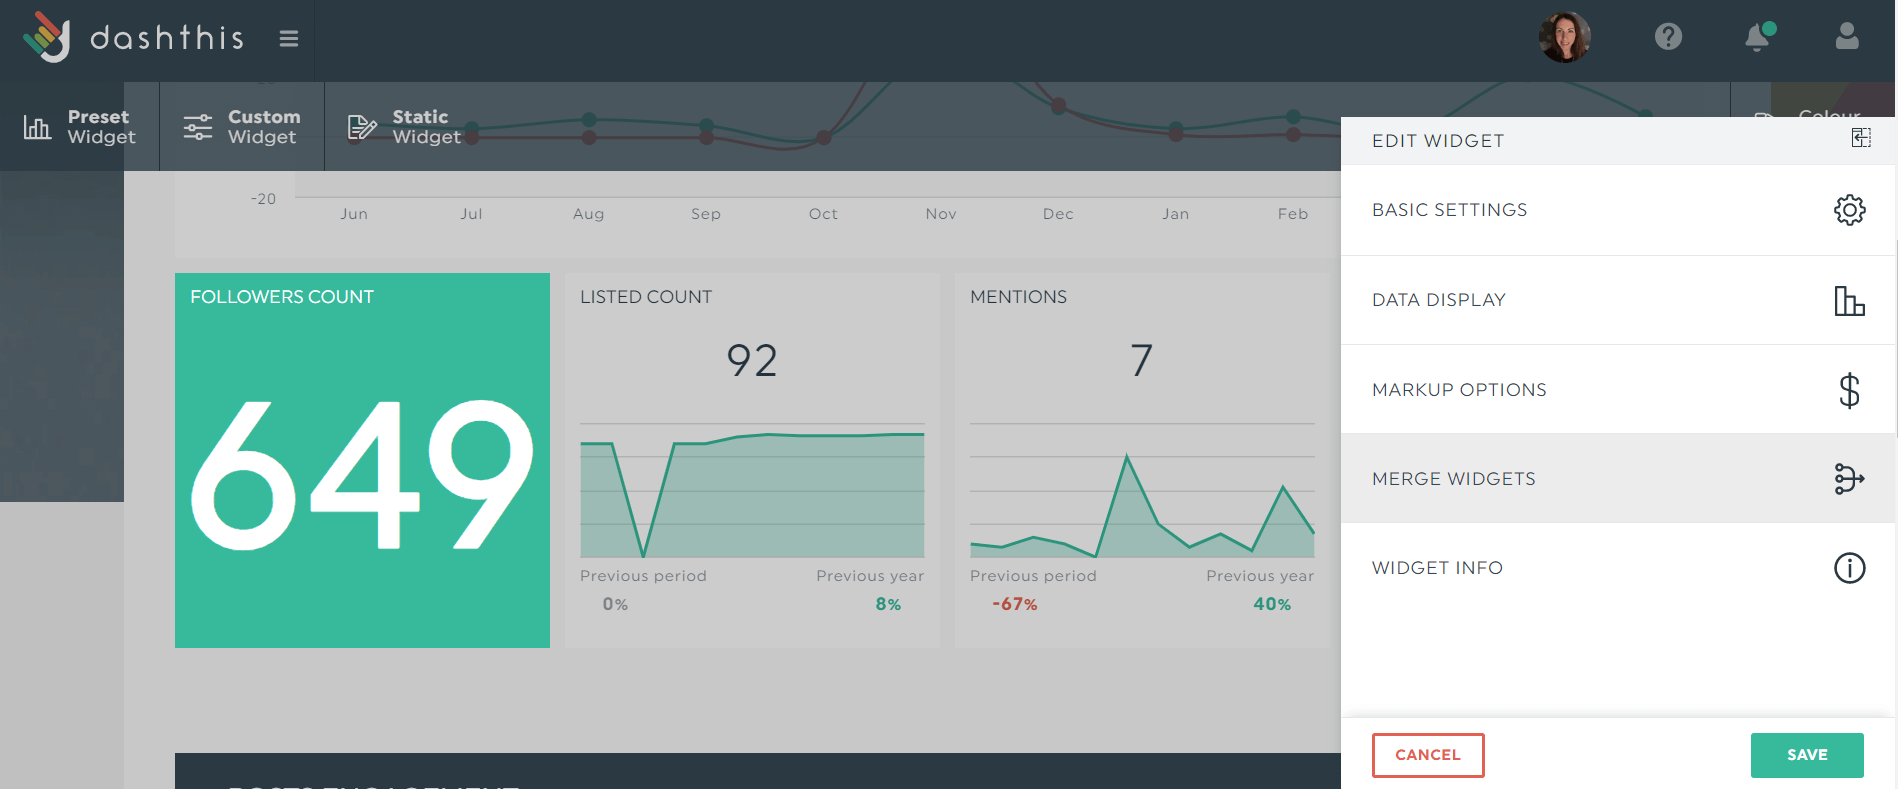
After selecting the right metrics, click Save.
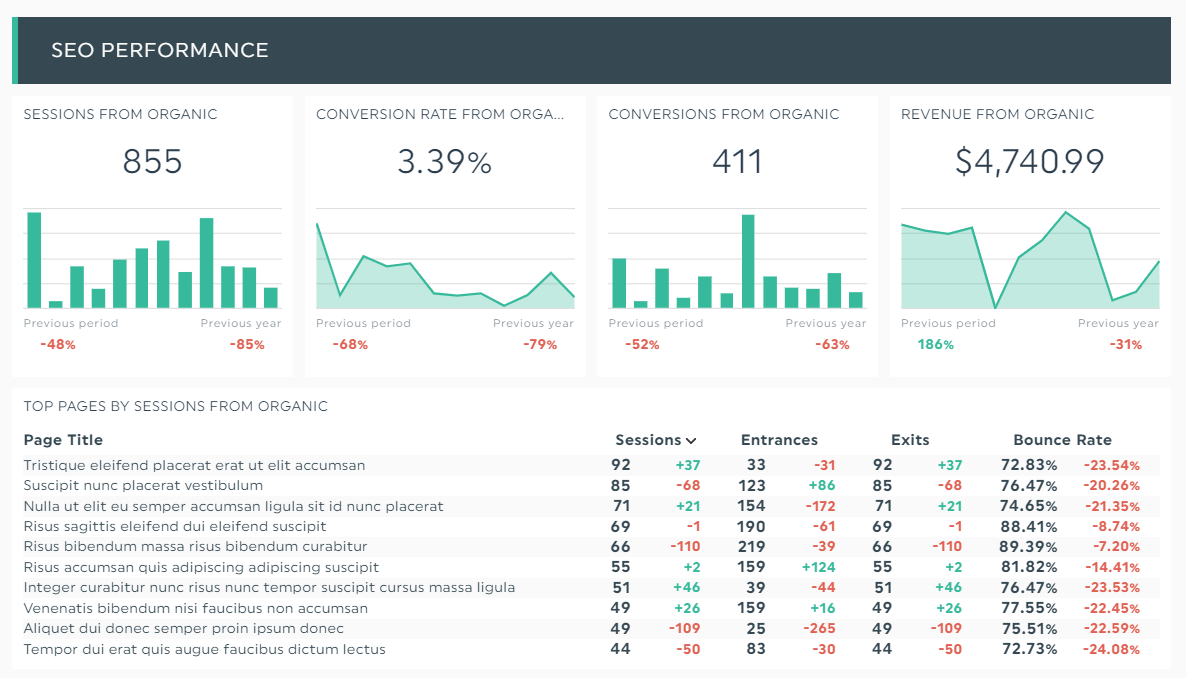
Ecommerce Report Template
Generating sales via SEO and paid ads for an ecommerce store with hundreds of products requires strategic planning.
This report below gathers all your priceless data to help you determine your bottom line and dominate a saturated market.
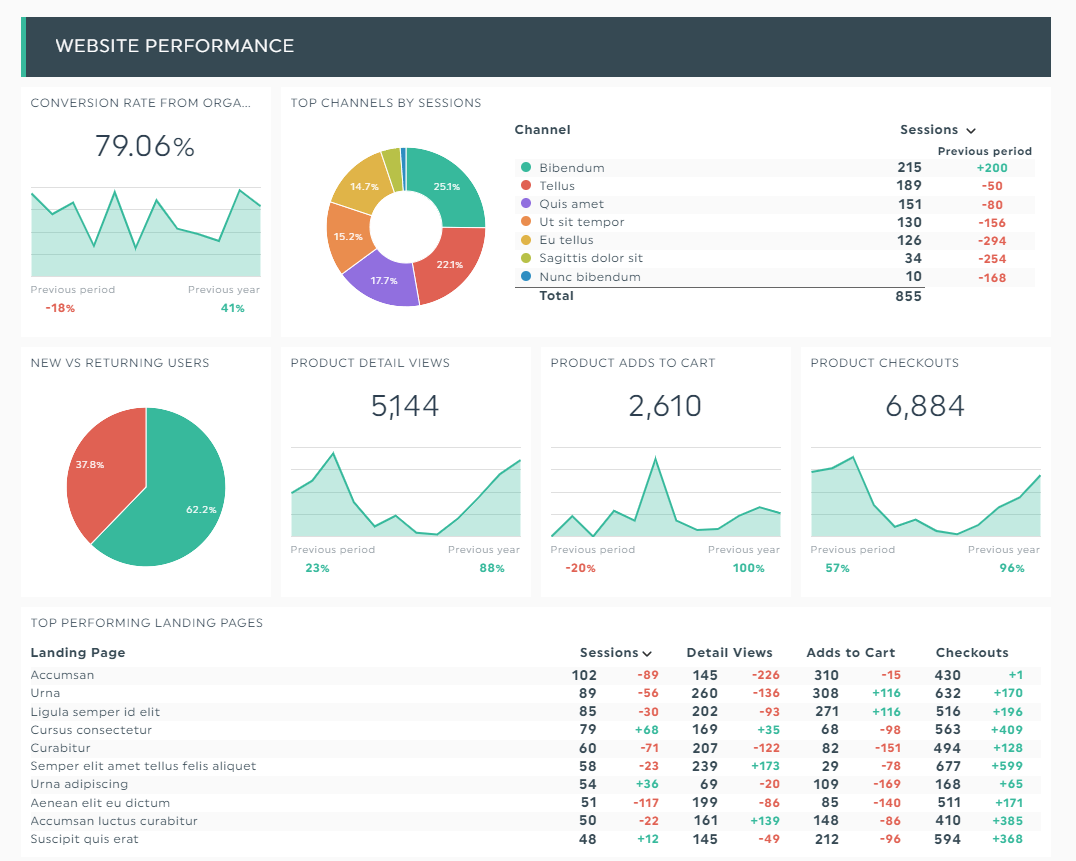
Grab this ecommerce report with your own data!
Given the complex nature of ecommerce marketing, clients without expertise might not understand your strategy and how it fits in the bigger picture.
If that’s the case, add comments within the report to provide additional context. This saves you the extra step of emailing them—or worse, recording a lengthy video—to explain your strategy.
Hover to a widget and click Add Note to share your insights and click Save.
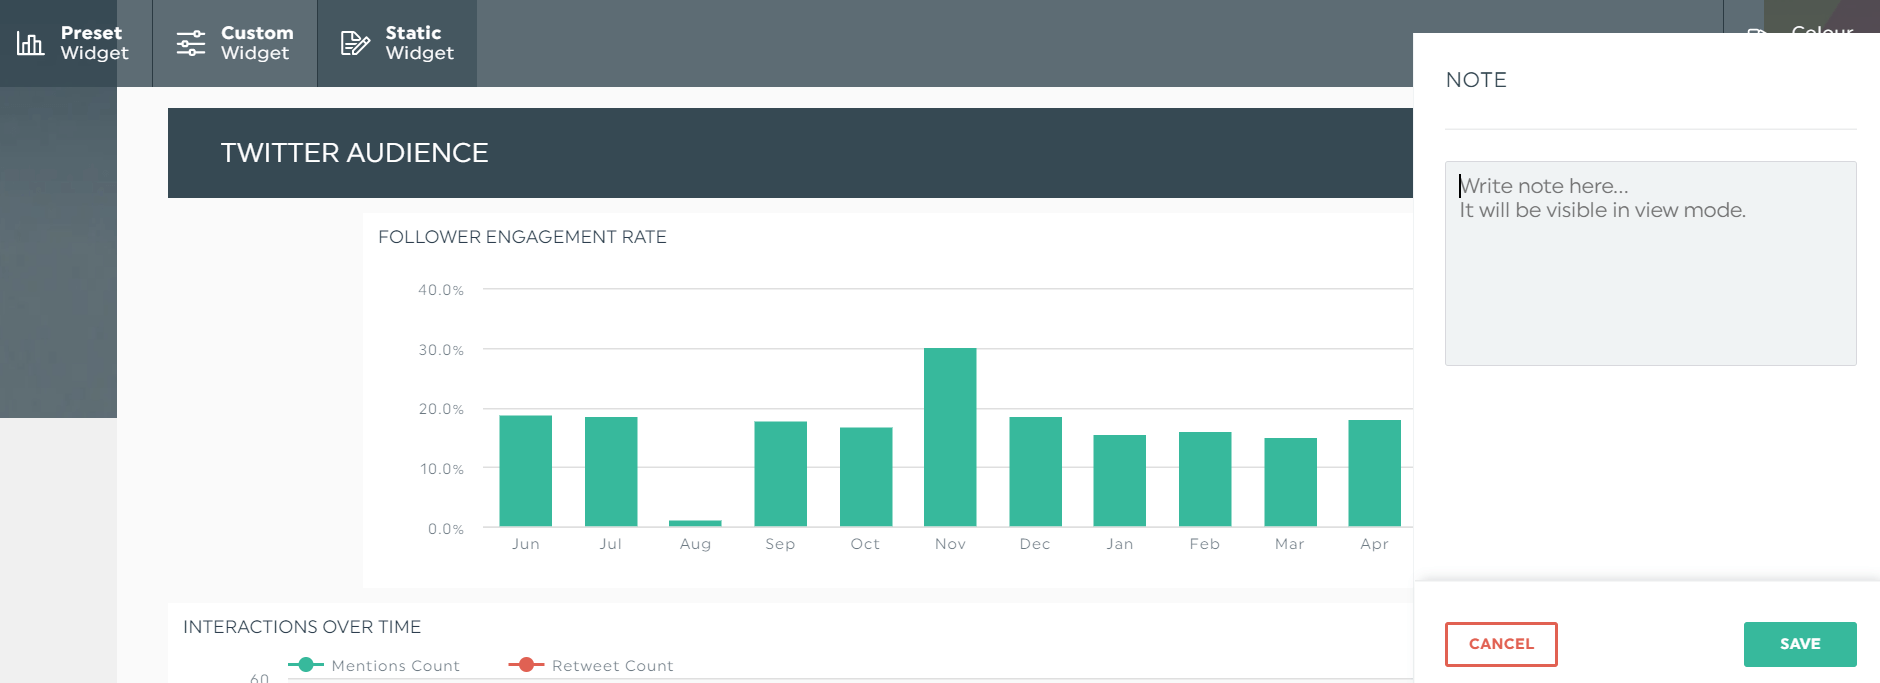
When clients view the report in view mode, they can access your note by clicking the orange tab next to the widget.
How to Create a KPI Scorecard with DashThis
There are two ways you can create a KPI scorecard.
One, track KPIs on Excel and turn them into charts and graphs on PowerPoint manually. Or, gather all the data you need across channels automatically via a reporting tool like DashThis.
Here’s how it works:
- Connect your favorite marketing tools
- Select a pre-made template
- Pick a time frame
- Choose your metrics under Preset Widgets
DashThis will proceed to grab your data and turn them into one customizable dashboard. Drag and drop the metrics as you desire, edit the graphics, and change the color theme to fit the client’s branding.
Combine these multiple KPI scorecards to identify root causes, trends, and rooms for improvements before implementing initiatives for specific goals with stakeholders.
DashThis also lets you gather data from multiple channels into one report (e.g., if you’re an all-in-one marketing agency, connect Ahrefs, LinkedIn, and Google Ads, etc. into one dashboard). Our reporting tool currently supports 30+ integrations.
Grab Your Free Balanced Scorecard Template Now
KPI scorecards inform how close or far off you are in achieving your business objectives. Without these quantitative records, you’re blindly creating one campaign after another without knowing what works.
DashThis is an automated marketing reporting tool. Add it to your existing project management stack to gather data across channels into one customizable dashboard.
Sign up for your free 15-day trial to unlock 30+ free templates, impress clients with beautiful reports, and over-deliver your business goals today.

Ready to track your most important metrics?
Read More

Don’t miss out!
Follow us on social media to stay tuned!
Automate your reports!
Bring all your marketing data into one automated report.
Try dashthis for free