Advertising Insights: What It Is & Expert’s Tips

Imagine running a home decor eCommerce store with these results in your PPC ads:
- 15% click-through rate
- $10 cost per acquisition
- 500% return on ad spend
- $200 customer lifetime values
Pretty good, right?
Now what if we told you the conversion rate sits at 5%?
“Maybe that doesn't sound too alarming, but we had set our benchmark at 10%,” says Ryan Robinson, founder and CEO of Right Blogger, who spearheaded the PPC campaign for the home decor store.
Clearly, the customer experience on the landing page wasn't fully optimized.
“This highlights the importance of looking beyond surface-level success. Metrics that look good at first can hide problems in the customer journey.”
By examining other advertising metrics in detail and improving the landing page design, Robinson and his team doubled their conversions—proving there's always room (pun intended) for improvement.
If you want to achieve similar results, you’re in the right place.
This guide recommends five advertising metrics to get you started. To make it more valuable, we’ll also share a few real-world advertising insights, along with expert-backed suggestions on what to do next.
- Understanding Advertising Insights & How They Impact Your Next Move
- Why You Should Track Your Advertising Analytics
- Start With These Top 5 Advertising Metrics If You Don’t Know Where to Begin
- How to Auto-Track Your Advertising KPIs with DashThis
- Automate Your Ads Reports Today!
Understanding Advertising Insights & How They Impact Your Next Move
Advertising insights are strategic or tactical learnings extracted from your ads performance.
For example, a milk delivery store that consistently sees high and low conversions for its soy and almond milk respectively might deduce customers are becoming more eco-friendly (ICYMI, almond milk is bad for the environment due to its excessive water consumption). Brands that take an environmentally and socially responsible approach will win market share (insights).
Since data back insights, you can quickly determine your next move with zero guesswork. Instead of strategizing based on gut, or worse, copying competitors.
This means better decision-making, faster teams, and results in less time.
By recognizing the subpar conversions were caused by the landing page experience, Robinson and his team knew what to focus on:
- A complete overhaul of the landing page design to create a more intuitive, conversion-friendly UX
- Meticulous A/B testing of every pixel—from headlines to images to CTA buttons
- A fine-tuning of the ad copy to align the target audiences' interests
Eventually, the team increased the conversion rate from 5% to 12%.
Why You Should Track Your Advertising Analytics
Before distilling data into consumer insights to drive decisions, you need to track your PPC advertising campaigns with a reporting tool like DashThis. Not convinced about the importance of measurement? Here are four reasons to change your mind.
You know what to improve on
Optimizing ad campaigns shouldn’t be done on a whim.
That’s your data’s job.
Note the image below—it gathers your entire Bing ads data into a visual data-driven dashboard. At just a glance, you know where to optimize. For instance, you might start with your bidding strategy to raise the number of impressions and measure how it affects the remaining metrics.
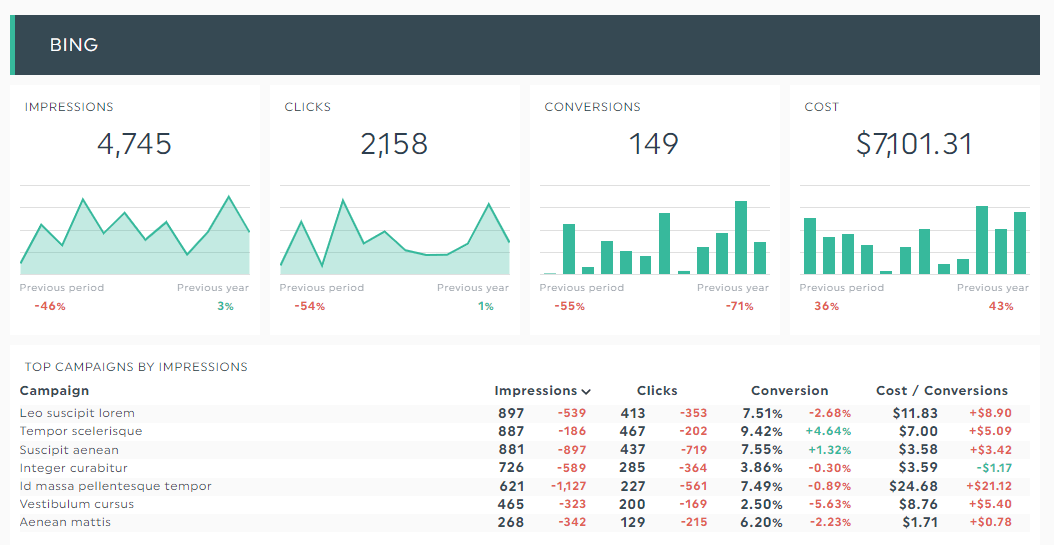
Grab this free advertising insights report template with your own data!
You know who makes up your best customers
By measuring your ad analytics, you pin down an audience segment that’s more likely to engage with your ads and take action.
Who knows, it might even inspire new marketing ideas.
For one agency, discovering its best customer segment in a campaign performance prompted it to target beyond the basic demographics—it teamed up with communities to drive more awareness!
You ensure your ad spend is efficiently used
Your advertising metrics tell you which ads have the highest chance of succeeding. Double down on what works and pull back on what clearly doesn’t.
That’s exactly what one of the PPC specialists we spoke to did in an ad campaign.
Upon discovering a stark contrast in acquisition costs across different countries, she allocated a bigger budget for the top-performing regions and ended up with better ROI in her marketing campaigns.
You get better ROI
Duh!
Tick all the boxes above, and you’ll find yourself improving your ROI.
Start With These Top 5 Advertising Metrics If You Don’t Know Where to Begin
Here are five advertising KPIs and metrics to measure today, plus expert-backed tactics to improve them.
Customer lifetime value (CLV, CLTV, or LTV)
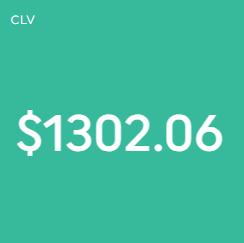
What it is: The total worth of a customer over the course of their relationship with your business
Why it’s important: Maximize revenue from your highest customer segments and improve profitability
How to improve your CLV according to PPC experts:
👉🏼 TREAT CUSTOMERS DIFFERENTLY
Yes, seriously.
One of the most startling observations Ascendant discovered early on was just how wide the disparity in CLVs is across its customer base.
While the IT company’s average CLV hovered around $25,000, its remaining cohorts left much to be desired:
CLVs under $10,000: Almost 30%
CLVs over $100,000: around 5%
“This really opened my eyes,” shares Matthew Franzyshen, a business development manager at Ascendant, with DashThis. “Not all customers are created equal in terms of their long-term value.”
To dig deeper, Franzyshen and his team analyzed their CLV drivers across cohorts, focusing on data like initial contract size, engagement level, support inquiries, and product usage.
Here are the insights they discovered:
- Customers often using premium features boast a 3X higher median CLV. They consistently renewed at higher rates and expanded into larger deployments over time.
- A dismal <10% adoption meant most users will churn within 12 months
- Some of the lowest initial contract values (i.e., customers spending <$5,000) might be the highest potential CLVs if Ascendant could drive stronger adoption
To better highlight premium and stickier features right off the bat, the IT company redesigned its onboarding and training programs. And as for its modestly budgeted customers, Ascendant implemented new low-touch education campaigns and in-app guidance.
Within 18 months, it:
- Boosted >$100K customer segment from 5 to 12%
- Reduced <$10K customer segment from 30% to 18%, and
- Increased average CLV by 37%
We approved!
Click-through rate (CTR)
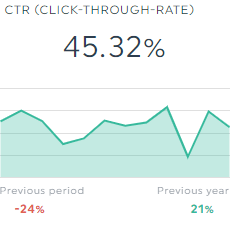
What it is: The percentage of clicks your ad receives from all users who see it
Why it’s important: High CTR indicates people are engaging with your ad. The more visitors land on your website, the better your odds are in converting them to customers.
How to improve your CTR according to PPC experts:
👉🏼 SPOTLIGHT CUSTOMERS
The difference between a high-performing and low-performing ad often comes down to finding the right ad creative, says David Miles, the founder and CEO of The PPC Machine.
When Miles ran a campaign for a B2B software product, he tested two ad creatives: one that focused on the product’s features and capabilities, and another that highlighted the customer’s frustrations.
Guess which ad performs the best?
If you pick the second ad, you’re right.
Customers are more likely to buy from brands that show they understand them (insights). While the first ad flopped with a <1% CTR, the second achieved a 3% CTR.
👉🏼 ADAPT BASED ON PLATFORM
When ads specialist Stefan Valentin was promoting a new range of wigs for Irresistible Me, he couldn’t figure out why the same ad performed differently across different platforms.
“We thought we had everything dialed in—catchy headlines, great visuals, and what we believed were irresistible calls to action,” shares Valentin with DashThis. “After digging into the data, we realized while our ads were super engaging on Instagram, they weren't hitting the mark on other platforms.”
Valentin and his team then tailored the ads to better fit each platform’s audience and format (insights). For example, user testimonials and detailed information on Facebook; and visually compelling and lifestyle-oriented content on Instagram.
“This more targeted strategy paid off,” Valentin says. “We saw a significant uptick in CTR across the board.”
Conversion rate (CVR)
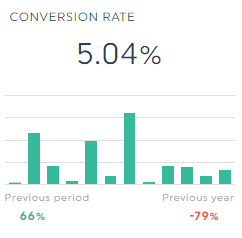
What it is: The percentage of users completing a desired action measured against the total number of visitors over a period
Why it’s important: High conversions usually mean your product resonates with customers. Track your CVR to calculate profitability and spot the key actions searchers complete across the customer journey.
How to improve your CVR according to PPC experts:
👉🏼 ACKNOWLEDGE THE EMOTIONAL ELEMENTS IN EVERY USER EXPERIENCE
What happens when your target audience’s journey is unpredictable and gut-wrenching?
That’s the situation FPGrowth found itself in when it worked with an IVF clinic.
“Because IVF is such a sensitive topic, trust is everything,” explains Pushkar Sinha, the head of digital marketing at the agency. “We made sure every step of our campaign builds trust and addresses any worries folks might have (insights).”
Before taking this compassionate approach, the number of people reaching out for consultations was low.
“It's like we were grabbing attention, but hitting a roadblock when it came to turning that interest into action,” laments Sinha.
To improve the CVR, Sinha rewrote the ad copy “to acknowledge the emotional journey folks go through when considering IVF.”
He says, “We wanted these folks to know we understand their concerns and are here to support them every step of the way.”
Sinha’s agency went beyond copywriting edits.
It targeted people actively seeking fertility-related info online and teamed up with communities that connected them with relevant folks.
On top of changing the visuals to be “more hopeful and family-oriented,” it also created a landing page specifically for IVF inquiries, laying out the clinic’s process, success rate, costs, and anonymous case studies from happy patients.
👉🏼 CHECK EXTERNAL FACTORS
Sometimes poor conversion rates are out of your control.
At least in the beginning.
“Conversion rate is vulnerable to external factors (insights), notably online reputation,” reveals Dan Ben-Nun, the founder and CEO of Adspace.
When Ben-Nun worked with an educational SaaS client, conversion rates dropped dramatically from 5.1-5.5% to 1.3%.
“The drop occurred four months after launching and steadily scaling a PPC campaign. Competitors attacked our client's reputation. They spread negative reviews and manipulated ratings on Trustpilot.”
Ben-Nun and his team responded with a comprehensive reputation management offensive. They disputed the negative reviews; since they were from fake accounts, moderators removed them in about two weeks.
“We also asked satisfied users to share their positive experiences on Trustpilot.”
Three weeks later, the CVR returned to its normal 5.12%.
Cost per acquisition (CPA)
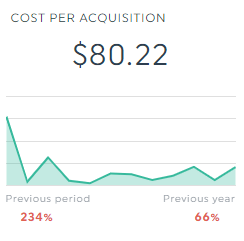
What it is: The cost paid for every customer you acquired
Why it’s important: It’s never a good idea to overspend on a customer. Your CPA keeps your ad spend in check and helps you make the most of your campaigns.
How to improve your CPA according to PPC experts:
👉🏼 ADJUST BUDGET ACCORDING TO REGION
Reactionpower decided to optimize a SaaS client’s landing page after discovering its lead gen ads were generating a high cost per acquisition.
At first, it looked at improving the call to action, social proof, and lead-gen form. Then it looked at geo-segmentation.
“Different regions have different advertising costs because of differences in competition, audience behavior, and purchasing power (insights),” explains Elsie Achieng, the director of paid social at Reactionpower. “High-income regions are usually more expensive compared to emerging markets.”
When Achieng and her team targeted both markets individually, they discovered that not only was CPA was higher in countries like the USA and Canada, but CLV was also substantially greater.
“This led us to allocate our budget more strategically across different geographies, optimizing not just for lower CPA,” says Achieng.
“But for higher overall ROI.”
Return on advertising spend (ROAS)
What it is: The revenue you gain for every dollar spent on advertising
Why it’s important: It’s really easy to burn through the ad budget. By measuring your ROAS, you can quickly evaluate how your ad campaigns impact the bottom line.
How to improve your ROAS according to PPC experts:
👉🏼APPLY THE TACTICS ABOVE
No kidding.
The metrics above impact ROAS.
Low CTR, for instance, leads to ads with low-quality score, which ultimately results in you paying more for fewer impressions and burning through your ad spend like there’s no tomorrow.
Try these expert-backed tactics to improve the metrics above.
It should bump up your ROAS in return.
How to Auto-Track Your Advertising KPIs with DashThis
If you manage multiple ad accounts with hundreds of campaigns, you need a breezy PPC reporting tool like DashThis.
Automatically grab your entire advertising data across your favorite channels into one beautiful report, instead of manually grabbing them from one account or platform at a time.
Agencies that automate their reports on DashThis enjoy features like:
- All-in-one dashboard that tracks data across all advertising channels in one place (e.g., Microsoft Bing ads, Google Ads)
- Unlimited users, client accounts, and data sources—no matter what plan you’re on
- Native integrations with 40+ popular marketing channels (e.g., social media platforms like Instagram)
- Over 40 beautiful templates with pre-built popular advertising metrics
- Multiple sharing options for different preferences (e.g., automatic email dispatch for busy marketers)
- Built-in notes and comments to provide more context and share actionable insights
That’s all fine and dandy…so how does streamlining your ads reporting look like on DashThis?
Here’s a taste:
- Select a PPC report template
- Connect your ad account(s) with DashThis
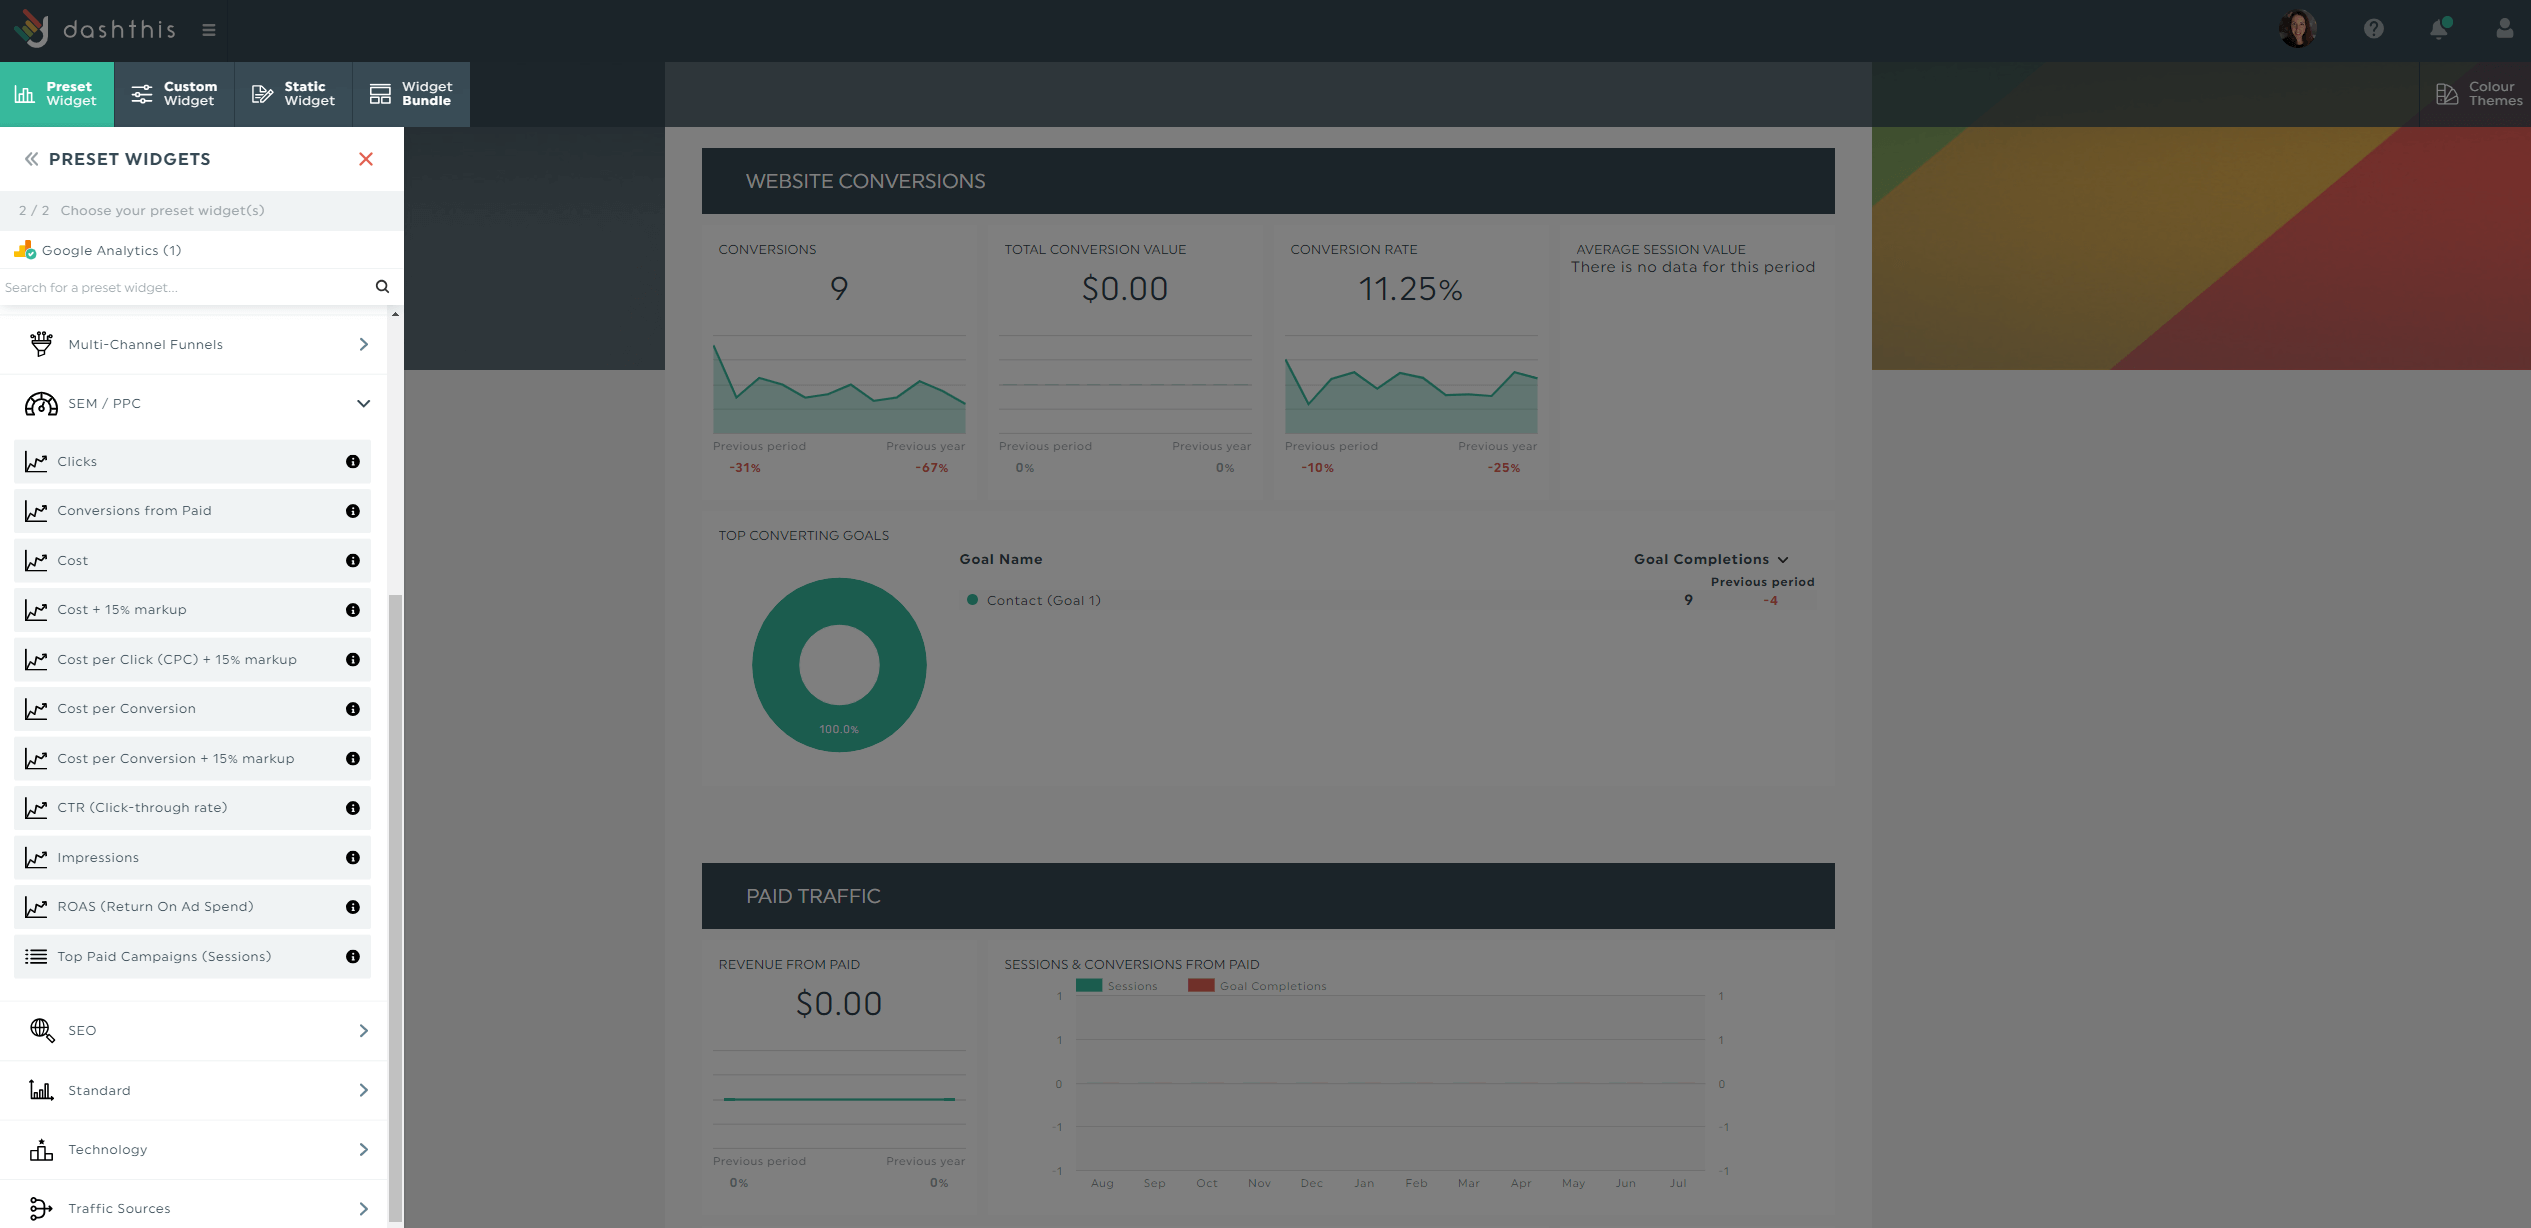
- Pick your metrics in Preset Widget
DashThis will automatically gather the metrics you selected into the report. Drag and drop them to form a cohesive look (e.g., Instagram Ads in one section, Facebook Ads in another).
Customize the PPC report.
From logo and color themes to headers and custom dimensions, you can tailor every report down to a granular level to fit every client’s unique needs.
Suppose you’ve conducted market research to gain a deeper understanding of an untapped customer segment. Use the built-in comment box to share your key insights (or explain your marketing insights in layperson terms).
Click Static Widget > Comment > Save.
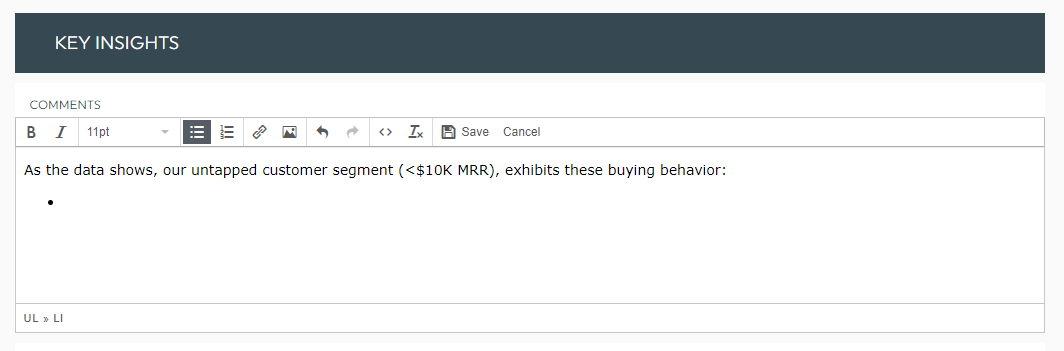
You can also share your recommendations here. Like how you’ll A/B test messaging variations based on customer’s challenges, reduce ad spend with negative keywords, or shape next week’s PPC campaign based on the new customer insights you’ve gathered.
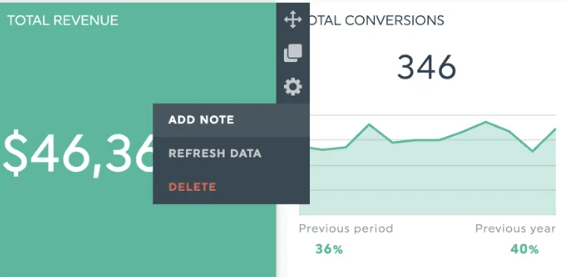
For bite-sized information (e.g., marketing acronyms, 1-3 sentences to explain the context behind an erratic graph), use our notes widget.
Hover to the metric and click Add Note > Save.
Once you’ve completed customizing the report, schedule an automated email dispatch. That’s right, you no longer need to manually send and update reports for every campaign!
Here’s how it works:
- Hover to the Sharing Options icon on the top right
- Click Share by Email
- Set the dashboard period and frequency
- Click Schedule
Add an optional note and include the report as a PDF attachment.
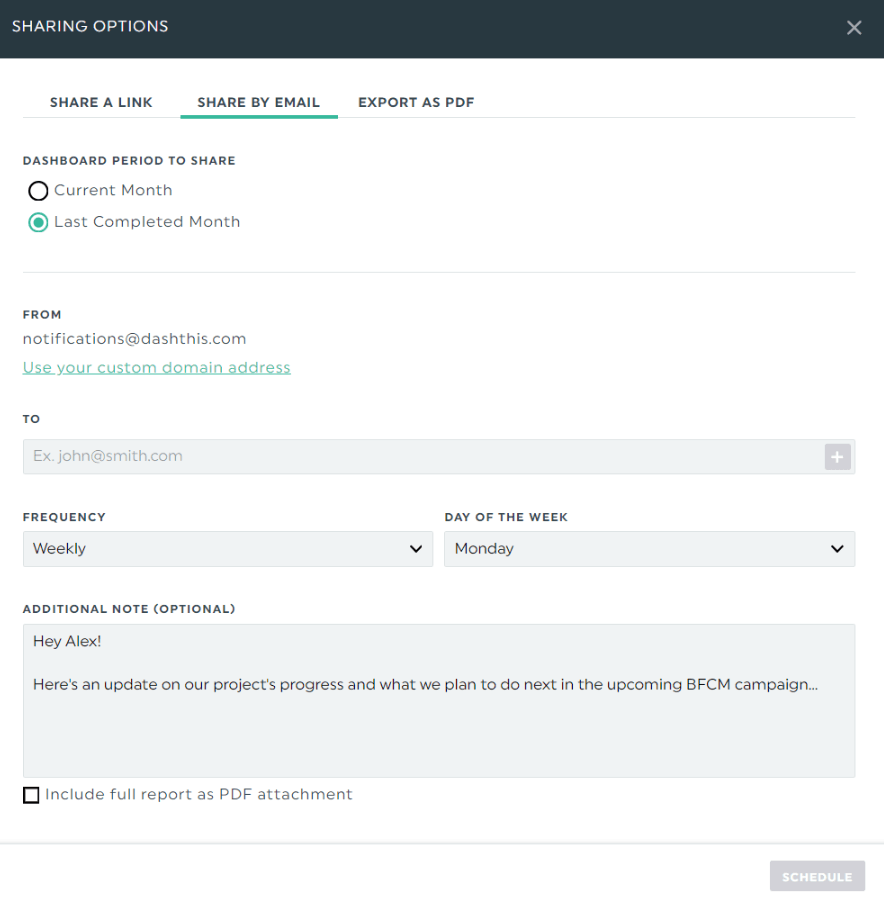
Alternatively, send over the report via a shareable URL link.
Both options let clients view the reports in real time.
Start your free 15-day trial to automate your PPC reports today.
PPC report template
How do your PPC ads stack up in the overall digital marketing strategy? This dashboard helps you decide if you should ditch or double down on them.
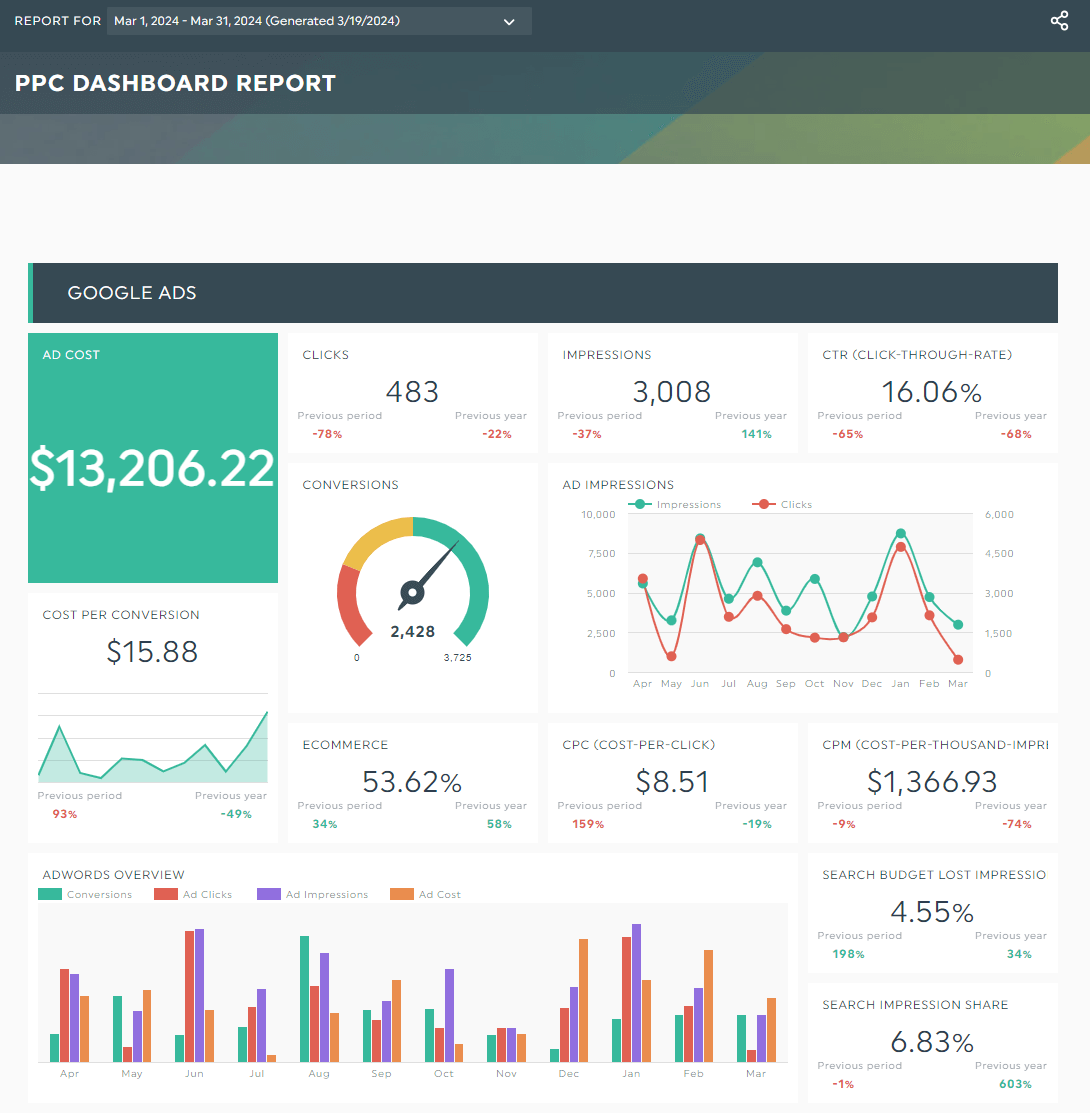
Grab this free advertising insights report template with your own data!
Automate Your Ads Reports Today!
There are many factors—some obvious, others unclear—that impact your advertising metrics. This guide gives you a few ideas, helping you narrow down the culprits behind your under-performing ads.
To echo Robinson’s words, never settle.
“Even when the metrics look good, there's always room for optimization,” says the founder.
“The marketers who really thrive are the ones who blend creativity and analytics in equal measure. They're constantly tinkering, testing, pivoting, and harnessing the insights that allow them to deliver increasingly resonant experiences.”
DashThis is the easiest reporting tool. Combine your entire ads performance across Google, Facebook, LinkedIn, and more into one beautiful report. Start your 15-day free trial today.

Ready to track your advertising insights?
Read More

Don’t miss out!
Follow us on social media to stay tuned!
Automate your reports!
Bring all your marketing data into one automated report.
Try dashthis for free