Analytics Keyword Report: How to Track and Optimize Your SEO Keywords

Table of contents
- Introduction + Table of Contents
- What is an analytics keyword report?
- How to segment keyword data for more practical reporting
- Key metrics to track in your keyword analytics report
- Tools you’ll need for a comprehensive analytics keyword report
- How to build an SEO keyword report with DashThis
- Automate your SEO keyword reports with DashThis
Introduction + Table of Contents
If you’ve ever wondered:
- "How do I track my keyword performance?"
- "My organic traffic is declining - which keywords are causing this drop? Could other issues in my digital marketing strategy be responsible?"
- "How do I show keyword ROI to my client or boss?"
Then, an analytics keyword report could solve this.
This guide walks you through creating a keyword performance dashboard and applying its insights to strengthen your on-page SEO strategy.
What is an analytics keyword report?
An analytics keyword report shows how specific search terms perform across search engines, social media or AI chatbots. Simply put, it compiles the keywords that bring visitors to your website through organic searches, pairing each term with performance metrics like clickthrough rate (CTR), position, impressions and clicks.
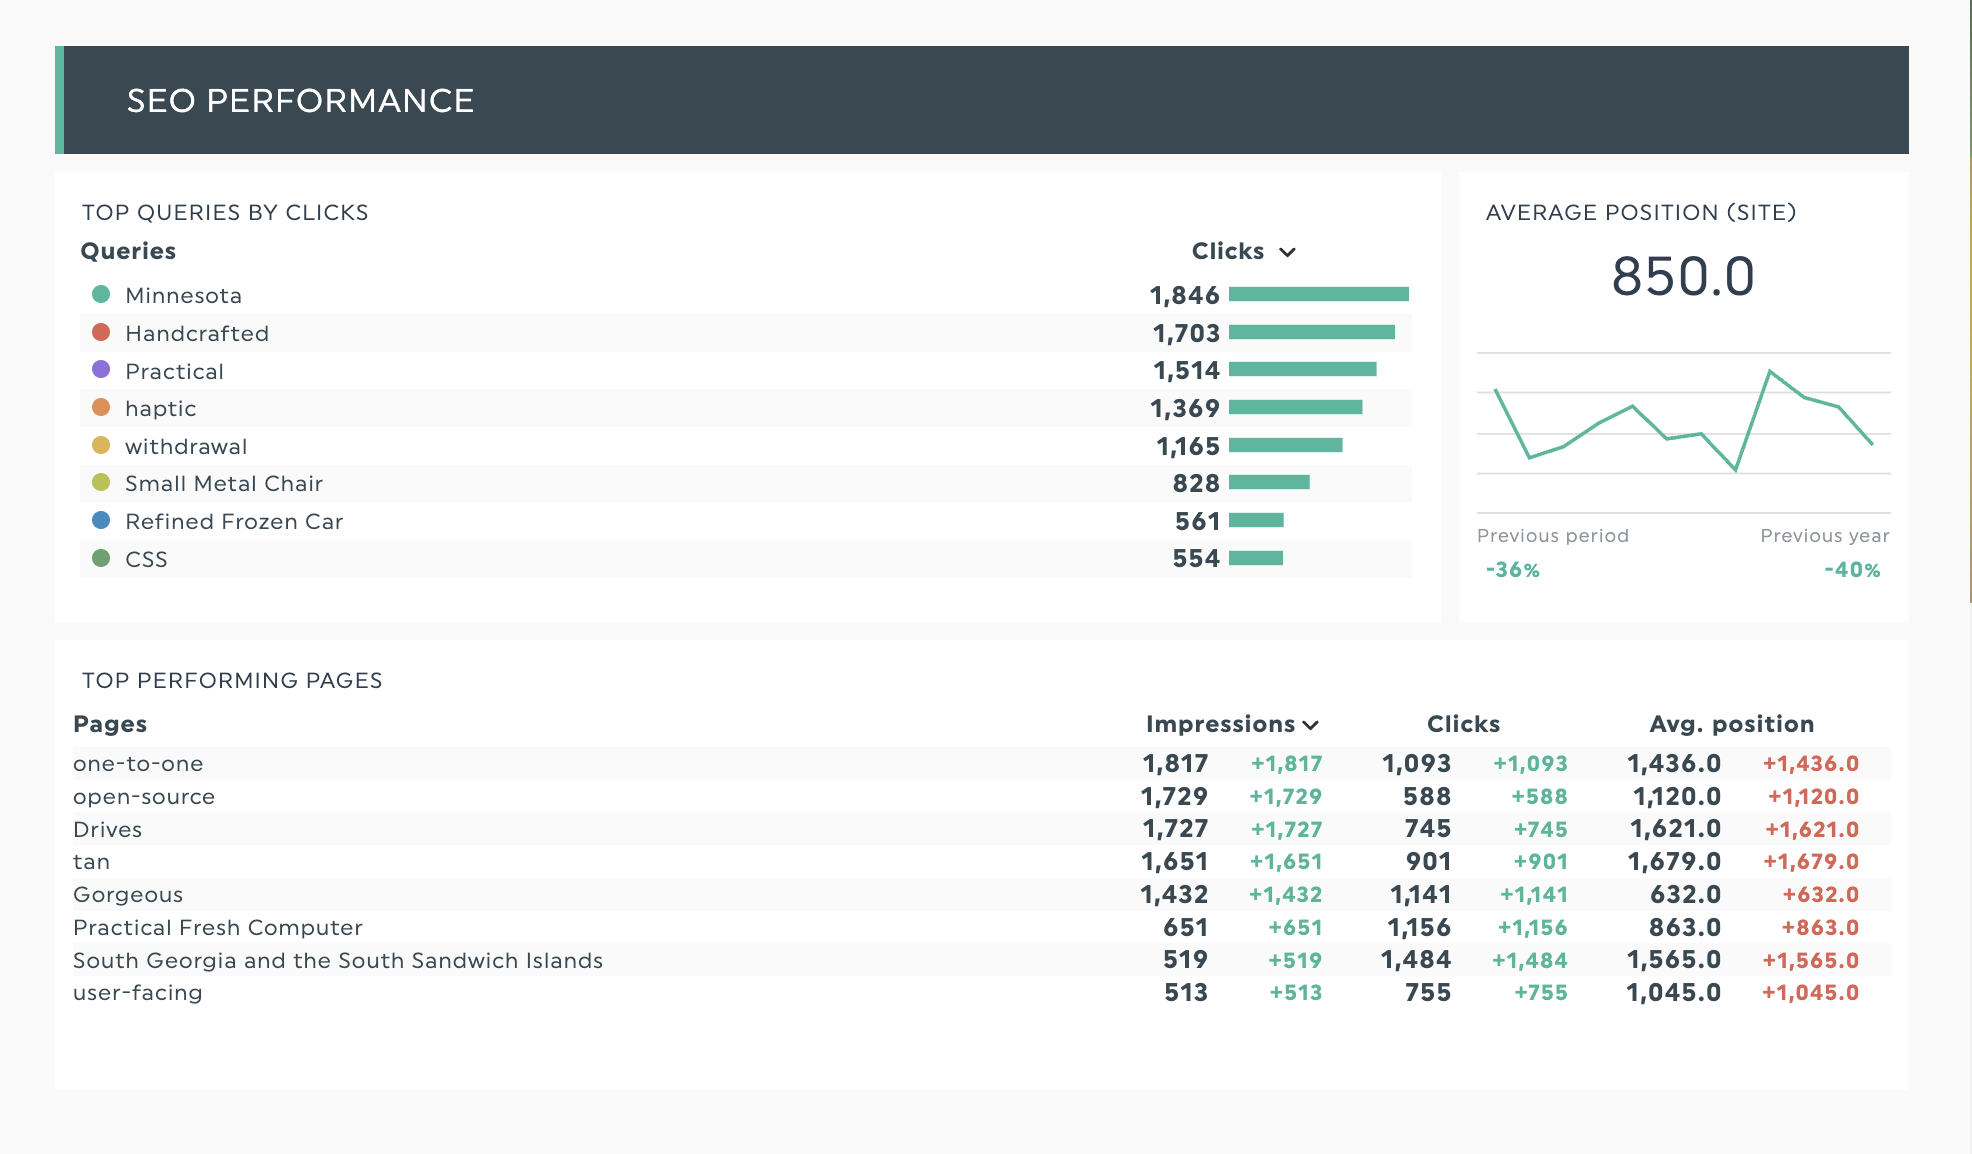
Get this SEO dashboard template with your own data!
Google still dominates with 89.54% of search traffic, yet search behaviors are evolving. HubSpot's research shows people now search on social media and AI chatbots. Regardless of traffic source, the core challenge stays the same: when organic performance drops, you need to figure out what went wrong.
Analyzing keyword data can provide the answers you need.
Your SEO performance depends heavily on where you rank in search results. When important keywords slip, say from third position to eighth, both traffic and sales typically decline. By monitoring keyword performance through analytics, you can spot and fix ranking drops before they hurt your business. The data reveals which search terms bring in real customers rather than just website visitors. Skip this tracking, and you'll be left in the dark about whether rankings fell due to algorithm changes or shifting search patterns.
This is particularly relevant for questions such as:
- Are we showing up for searches that matter most?
- Why aren’t customers finding us in search?
- Are competitors outranking us on our most valuable terms?
Applications of an analytics keywords report
- Content gap identification: Find topics where you rank well for how-to searches but need more thorough resources to help readers at different stages of their journey
- Performance troubleshooting: Find out if traffic drops are because of lower rankings, more competition, or algorithm changes
- Competitive analysis: Find specific keywords where competitors rank just ahead of your client's website
- Content optimization: Update content that gets views but few clicks
- Campaign evaluation: See if your new content is actually ranking for the keywords you targeted
How to segment keyword data for more practical reporting
Breaking down keywords into smaller clusters helps identify specific problems and opportunities that could get lost in a broader view.
When you split keywords by type, it’s easier to spot problems and opportunities to improve rankings. For example, you might find your how-to content drives traffic but no sales, while product pages convert well but get little visibility.
Bonus: you’ll get clearer reports, and are less likely to overwhelm your clients with massive keyword lists, which translates to an easier job trying to communicate your hard work to your clients.
Try these proven keyword segmentation strategies.
Branded vs. non-branded keywords performance
A branded keyword is a search query that includes your website’s brand name, product name, or variations of these terms - making it unique to your domain. Optimizing for these keywords help shield your brand from competitors and maintain your reputation.
People searching these keywords tend to be:
- Familiar with your brand
- Have already interacted with your content
- More ready to buy
- Often face less competition, making them easier to rank
Non-branded keywords may reference your product category or type without mentioning specific brand names. These terms often get more searches but reach people who aren’t ready to buy yet. Such searches come from people who:
- Aren’t aware of your brand
- Haven’t visited your website
- Want to research before they make a purchase
- Are comparing you to similar companies and products
Let’s look at an example in the marketing automation space:
Branded keyword: 'HubSpot pricing': Shows high purchase intent from people already familiar with HubSpot. These search keywords have lower competition and higher conversion rates, but limited growth potential.
Non-branded keyword: 'marketing automation tools list': Captures early-stage researchers comparing multiple solutions. These features have higher search volumes and more opportunities to drive traffic growth, but require more nurturing to convert.
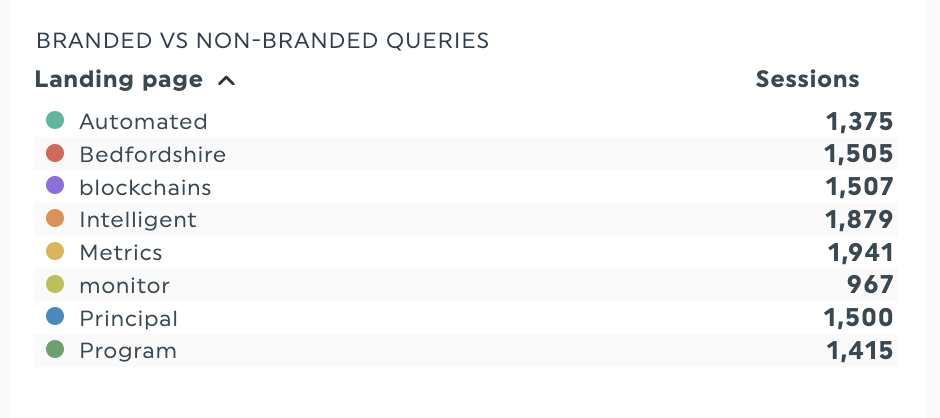
Separate these two target keyword types to pinpoint why traffic dropped. Did internal reputation changes spark the decline, or did market shifts cause it? This analysis helps reveal the answer.
To report on branded vs non-branded organic sessions, use tables showing organic traffic from branded and non-branded searches, broken down by search query and landing page. Add key data points like click rates, number of conversions and position changes to get a clear view of search performance.
Search intent
When people type words into a search engine, what are they trying to find? That’s the essence of search intent. Some want to learn about a topic, others aim to find specific websites, buy products, or compare different options.
Understanding search intent becomes crucial when creating keyword reports that actually drive business decisions. Rather than lumping all keywords together, try segmenting your data by where searchers are in the specific context.
This approach turns keyword reports into a plan for what content to create next. It helps you decide which topics are worth your time and which keywords actually bring in customers, not just website visitors.
The key is organizing your data to support strategic decisions. M. Kande Hein, Director of Marketing & Sales at SEOTA uses this exact approach with his agency's clients.
Keyword segmentation plays a major role in how we present reports. We divide keywords into branded vs. non-branded, but more importantly, we organize them by user intent and funnel stage. Informational terms guide top-of-funnel content while decision-stage terms focus optimization around service or product pages. This structure supports smarter content decisions and provides clarity during monthly reviews.
We also use keyword performance trends to adjust resource allocation. If a group of transactional keywords starts declining, we may shift budget from general awareness campaigns to page refreshes or technical SEO. If a niche category shows strong growth, we use that momentum to expand cluster content or recommend a new landing page.
For step-by-step guidance on search intent and SERP analysis, check out this guide
Business impact
Another method of keyword segmentation is to appeal directly to what your client is interested in by highlighting what matters to their business. You’ll capture your client’s attention when you put their interests first.
This business-first approach transforms overwhelming keyword lists into actionable priorities. Adam Watson, Founder of Hollywood Mirrors, has refined this strategy over decades of client work. Rather than segmenting by search intent alone, he organizes keyword data around business impact:
“I segment keyword data into short-term revenue opportunities, longer-term market growth opportunities, and competitive threat monitoring. My "Revenue Impact Matrix" tells clients which 15 keywords drive 78% of their revenue potential and which competitors are gaining traction in their most critical markets. Generic lists of keywords overwhelm clients, but when I tell them 12 specific phrases are driving £340,000 in revenue per year and must be addressed immediately, they act, I discovered through decades of client experience.”
Which segmentation approach aligns with your clients’ needs? The right keyword strategy depends on your client’s business model, understanding of customer search behavior, and market position.
Analyzing keyword data by search urgency helps prioritize time-sensitive topics like health questions. Local businesses benefit from distinguishing between local and national searches to improve their local SEO and identify expansion opportunities in new markets.
Key metrics to track in your keyword analytics report
1. Organic keyword rankings
The crux of organic keyword positions is pretty straightforward: rank higher for a keyword, get seen by more searchers, earn more clicks and traffic. But the reality is more complex; not all keyword positions carry equal value.
The first organic search result receives 10 times more clicks than a listing in the tenth position, according to Backlinko data. The study also revealed that CTR gains differ significantly depending on initial and final rankings.
Climbing from position three to two typically boosts CTR significantly, since you enter the prime spots that capture most searchers' attention. Conversely, moving up a spot from the tenth position rarely affects click rates much, as both rankings sit below where most users look.
Some ranking improvements have a bigger impact than others, so focus your time where it'll actually pay off.
2. Keyword clicks and impressions
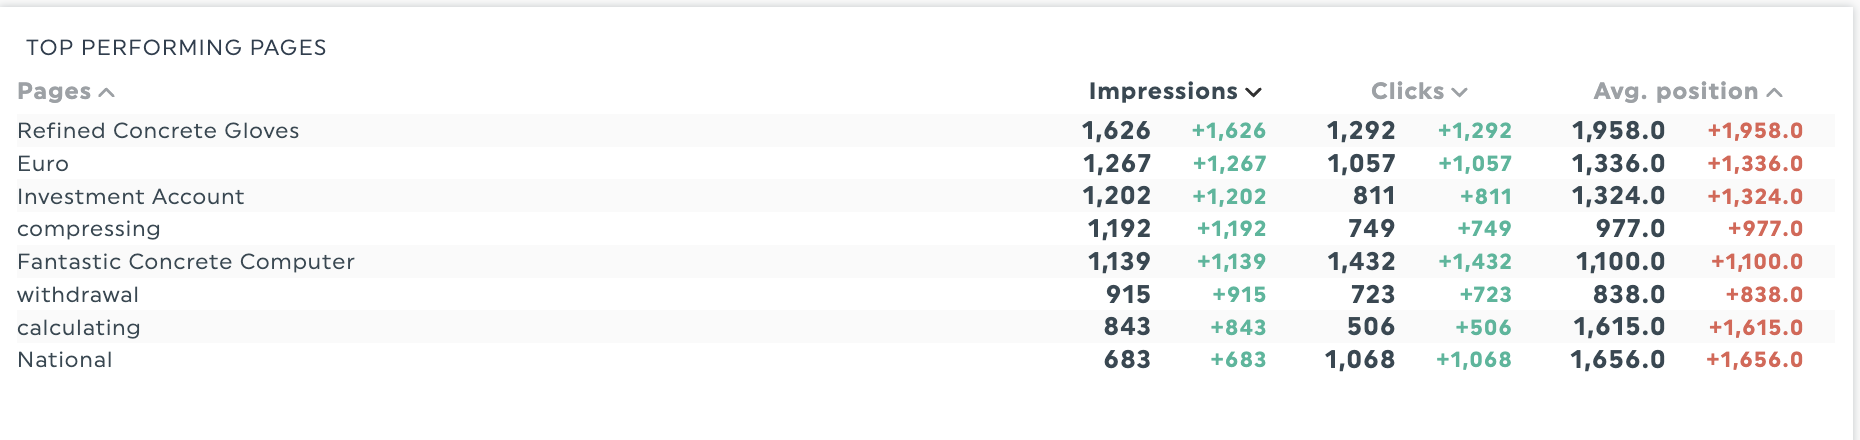
Clicks reveal how often someone clicked a link from Google to your site, whereas impressions show how often someone saw a link to your site on Google.
Together, they diagnose performance issues and guide content priorities. By examining keywords with high impressions but weak conversions, we can spot opportunities to refine existing pages or create targeted new content. When certain topics attract clicks despite limited visibility, it signals successful content ready for broader keyword expansion.
Display clicks and impressions side-by-side in a sortable table. Identify underperforming pages by sorting to reveal high-impression, low-click content that may need better titles and meta descriptions. Reverse the sort to spot high-converting pages with limited visibility, as these could benefit from broader keyword targeting.
3. Average position
Average position shows you where your site typically appears when people search for a specific keyword. Since your pages might show up in different positions throughout the day or for different searchers, Google calculates an average to give you a clearer picture of your overall visibility in search results.
For example, if your page ranks #2 for some searches and #4 for others, your average position might be around #3. This gives you a more realistic view of how visible you are compared to just looking at a single ranking snapshot.
Keep in mind that your actual visibility might differ from what the average position suggests. SERP features like featured snippets, knowledge panels and 'People Also Ask' (PAA) boxes can push organic results lower on the page, even with strong ranking positions. Average position serves as one metric among many for keyword analysis. Looking at clicks and impressions alongside position data provides a more complete picture of your search performance.
4. Click-through rate (CTR) by keyword
CTR reveals how well your title tags and meta descriptions attract clicks compared to competitors. It also shows if your content aligns with searcher intent. When diagnosing performance issues or identifying growth opportunities, CTR data provides valuable insights to guide your strategy.
What good CTR looks like varies by position and industry. The average first-position search results typically get around 27.6% CTR, while position #3 gets 11% based on Backlinko's data. These numbers look different across industries, though. Local businesses often see more clicks, while crowded markets may get fewer clicks, even at the top. To understand what's normal for your field, check industry standards or look at how your past campaigns performed.
Tools you’ll need for a comprehensive analytics keyword report
Now that you know what metrics matter, here’s how to source this data.
Start with these key tools to help track your SEO metrics: GA4 tracks website traffic and user behavior. Search Console provides data on your site’s Google search performance. SEO platforms like Ahrefs, Moz or SEMRush let you monitor keyword rankings, identify valuable search queries, and analyze competitor data.
Need more specific data? Content optimization tools like Clearscope or SurferSEO help. For local service businesses, Google Business Profile data reveals location-specific keyword insights.
With your data gathered, you’ll want to compile it into a cohesive report. Many SEO professionals begin with free tools like:
- Excel and Google Sheets: Works well for tracking a small set of keywords, but pulling data manually gets cumbersome with larger lists.
- Google Looker Studio (formerly Data Studio): Free with direct GSC and GA4 integration. Setting up takes some expertise, and keyword segmentation options are basic.
- Screenshots from tools: This provides a quick reporting solution. But this approach has drawbacks for ongoing tracking since it lacks historical keyword performance data.
Free tools work great when you're just getting started. But things get messy fast when handling lots of clients or projects without the right software to stay organized.
Juggling different SEO tools creates reporting headaches when data lives in separate places. Pulling keyword data from Search Console, rankings from SEMrush, and traffic from GA4 reports means dealing with scattered numbers across multiple spreadsheets. This disjointed workflow wastes time hunting down data instead of uncovering meaningful patterns.
For agencies juggling multiple client reports, DashThis’s reporting features help automate your workflow, saving you hours in reporting time.
How to build an SEO keyword report with DashThis
Now that you understand the key metrics and tools, let's walk you through building your first automated keyword report in DashThis. Our reporting automation tool brings all your keyword data together in a single dashboard.
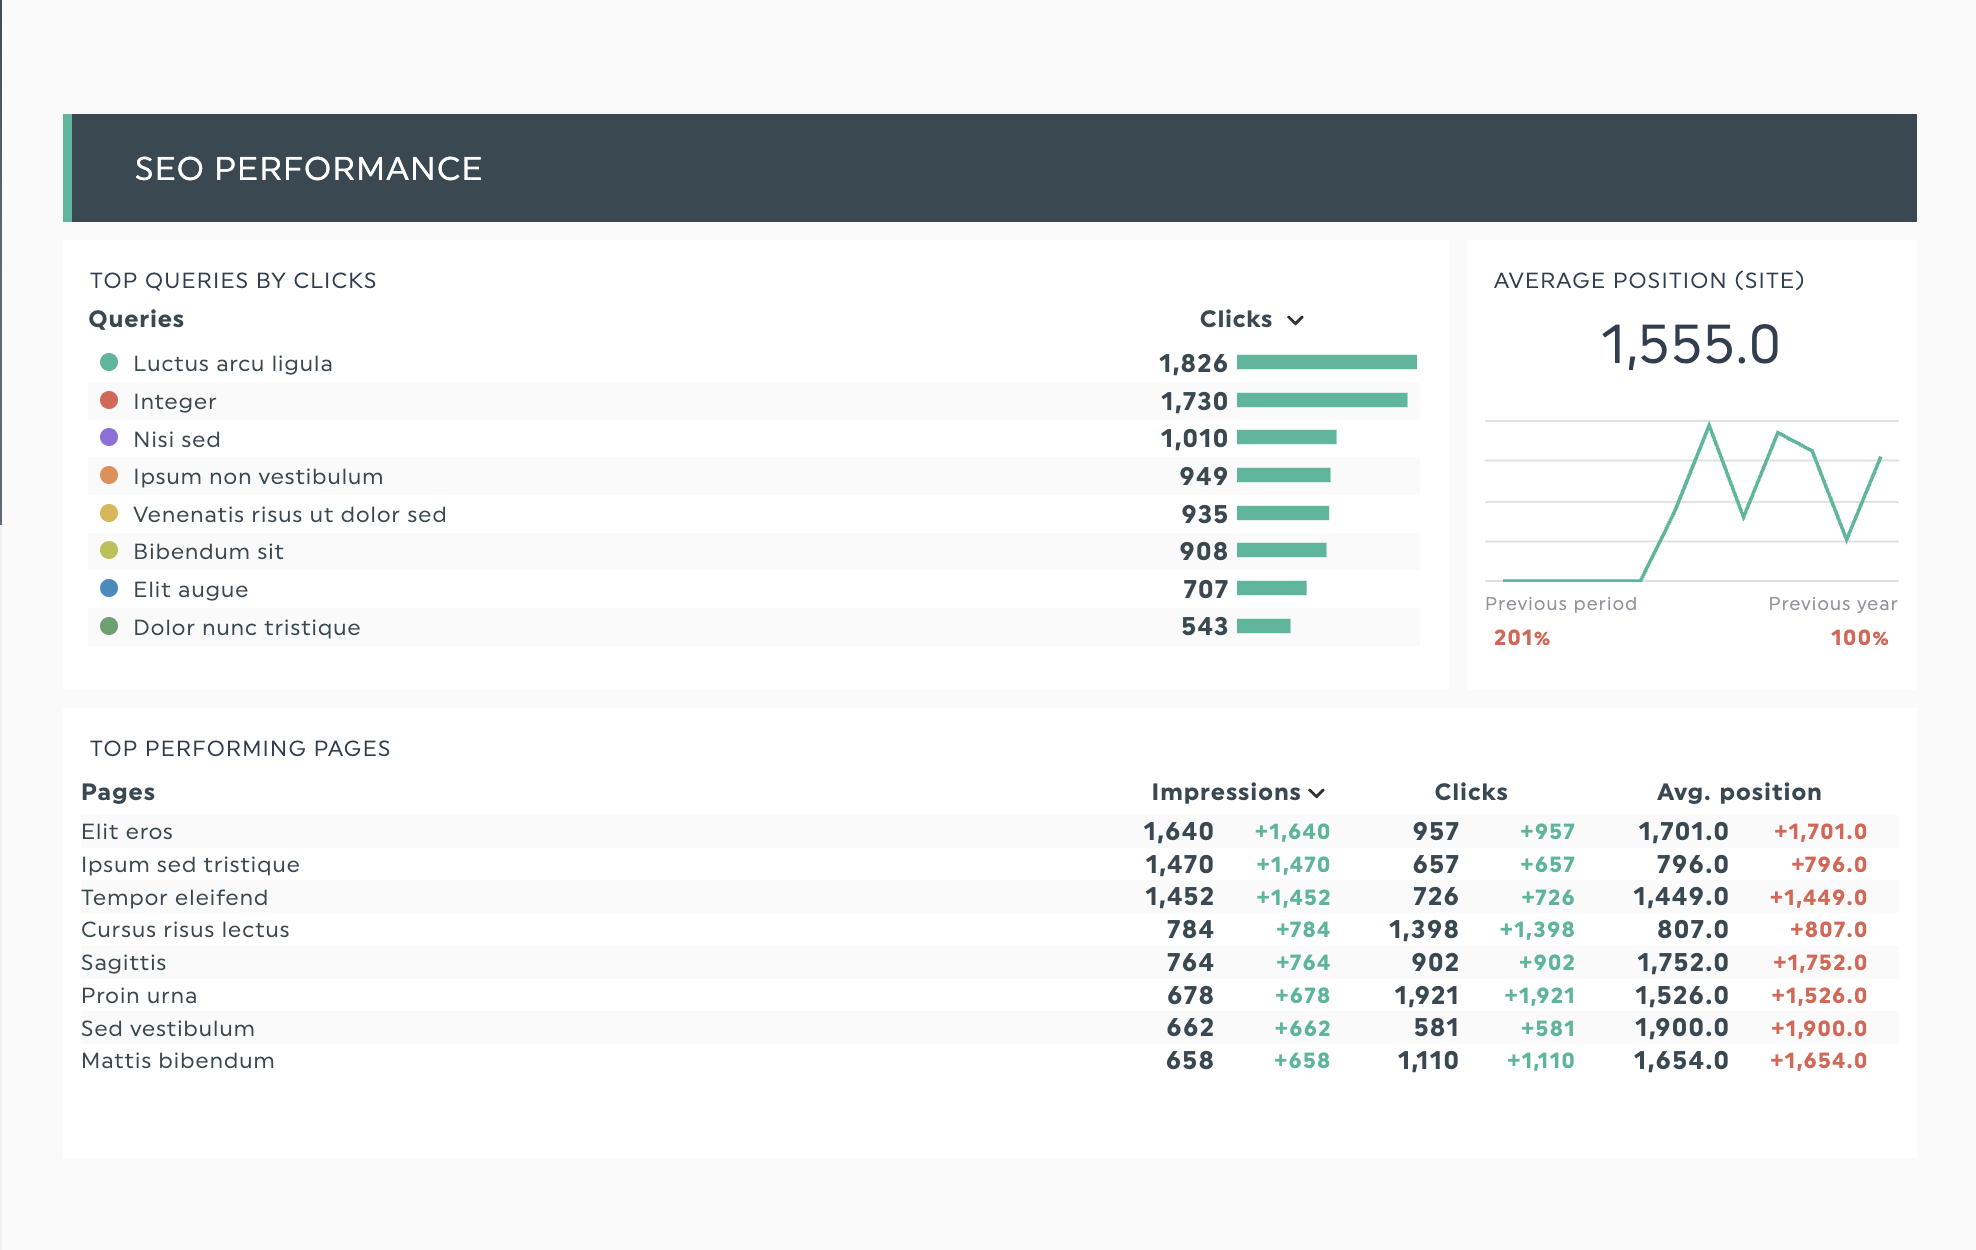
Get this SEO keyword report template with your own data!
Step 1: Sign up for your 14-day DashThis trial, no credit card required. You'll have full access to all features, so you can build and test your keyword reports in real-time before committing.
Step 2: Set up your SEO tools, like:
- A Google Search Console account for search performance data
- Google Analytics 4 for traffic and conversion metrics
- A SEO platform like SEMrush, Ahrefs, or Moz for ranking, keyword research tools and competitive data
Just give DashThis the permissions needed and your data moves right into the platform, no more manual exports and API hassles.
Step 3: Browse our keyword report templates or build one that fits your needs. Our SEO keyword-focused templates include key metrics that agencies commonly track, and you can customize any template to match your requirements.
Step 4: Build your dashboard: Add widgets by dragging them into place and adjust how your data appears. You can sort information by dates, keyword groups, or landing pages.
And that’s your reporting process sorted. This frees up your time to plan rather than wrestle with data.
Tip: Don't pack your reports with every tracked keyword. Your clients don't need to see all the keywords with minor ranking changes, they need to see the ones that actually impact their business. Focus your reports on three types of keywords: those with strategic importance to their goals, terms that drive the most conversions, and any keywords with significant position changes (good or bad). This keeps your reports focused rather than overwhelming.
Automate your SEO keyword reports with DashThis
Analytics keyword reports become a fantastic tool in your repertoire when you connect keyword performance to revenue goals. So, frame ranking improvements as business wins: more leads, higher conversions, expanded market share. This way, clients immediately understand the value of SEO and are more willing to approve larger SEO budgets or a retainer extension.
Building detailed custom reports takes hours. Why not automate the process? DashThis pulls your data from Google Search Console, Google Analytics 4 and your preferred SEO platform into a client-friendly dashboard. You can apply custom filters to track key metrics, from top search terms to specific keyword groups.
Start automating your SEO reports and save time on manual reporting. Try DashThis free for 14 days.

Start tracking your SEO with Dashthis now!
Read More

Don’t miss out!
Follow us on social media to stay tuned!
Automate your reports!
Bring all your marketing data into one automated report.
Try dashthis for free