9 essential B2B marketing KPIs to include in your next client report

Key performance indicators (KPIs).
The three words can make anyone sweat, whether fresh graduates or seasoned marketing VPs.
Why? KPIs affect promotions, compensation, and other things directly affecting our work lives.
But wait, hold up.
KPIs also help guide you on how best to serve your clients and what to do next. Well-chosen KPIs make you feel more in control and minimize stress. You know exactly what results you’re aiming for and how to get there.
This guide will help you select the right KPIs for your B2B marketing dashboards, why they’re important, and how to use the data to drive client results (and make yourself the most valuable partner for your clients, ever).
What is B2B marketing?
Business-to-business (B2B) marketing involves any company that sells to other businesses. From operational staff to senior management teams who approve budgets, you sell to people who determine or influence business purchasing decisions.
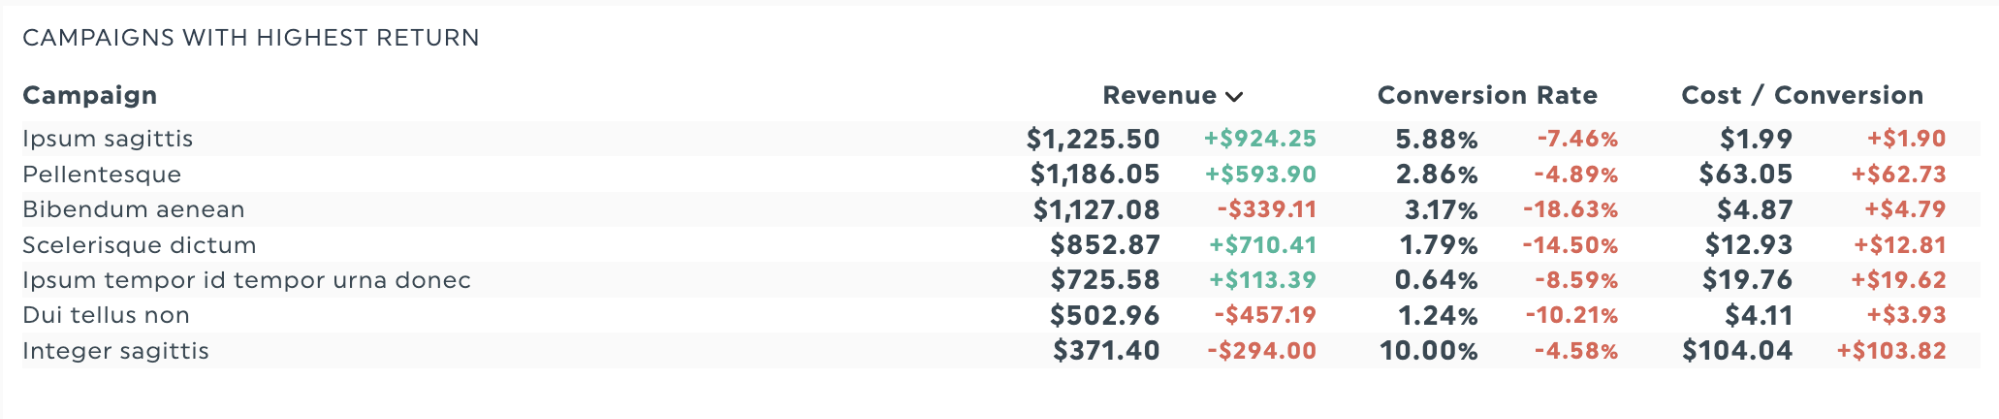
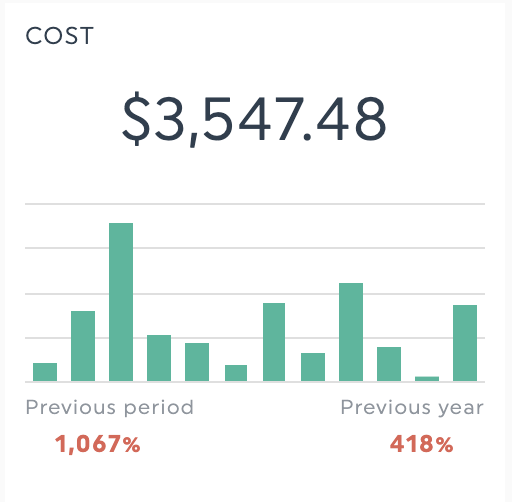
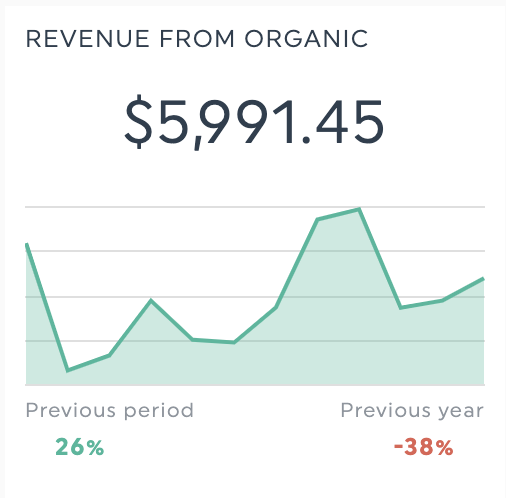
To illustrate, here’s a report showing a B2B company’s SEO and PPC performance.
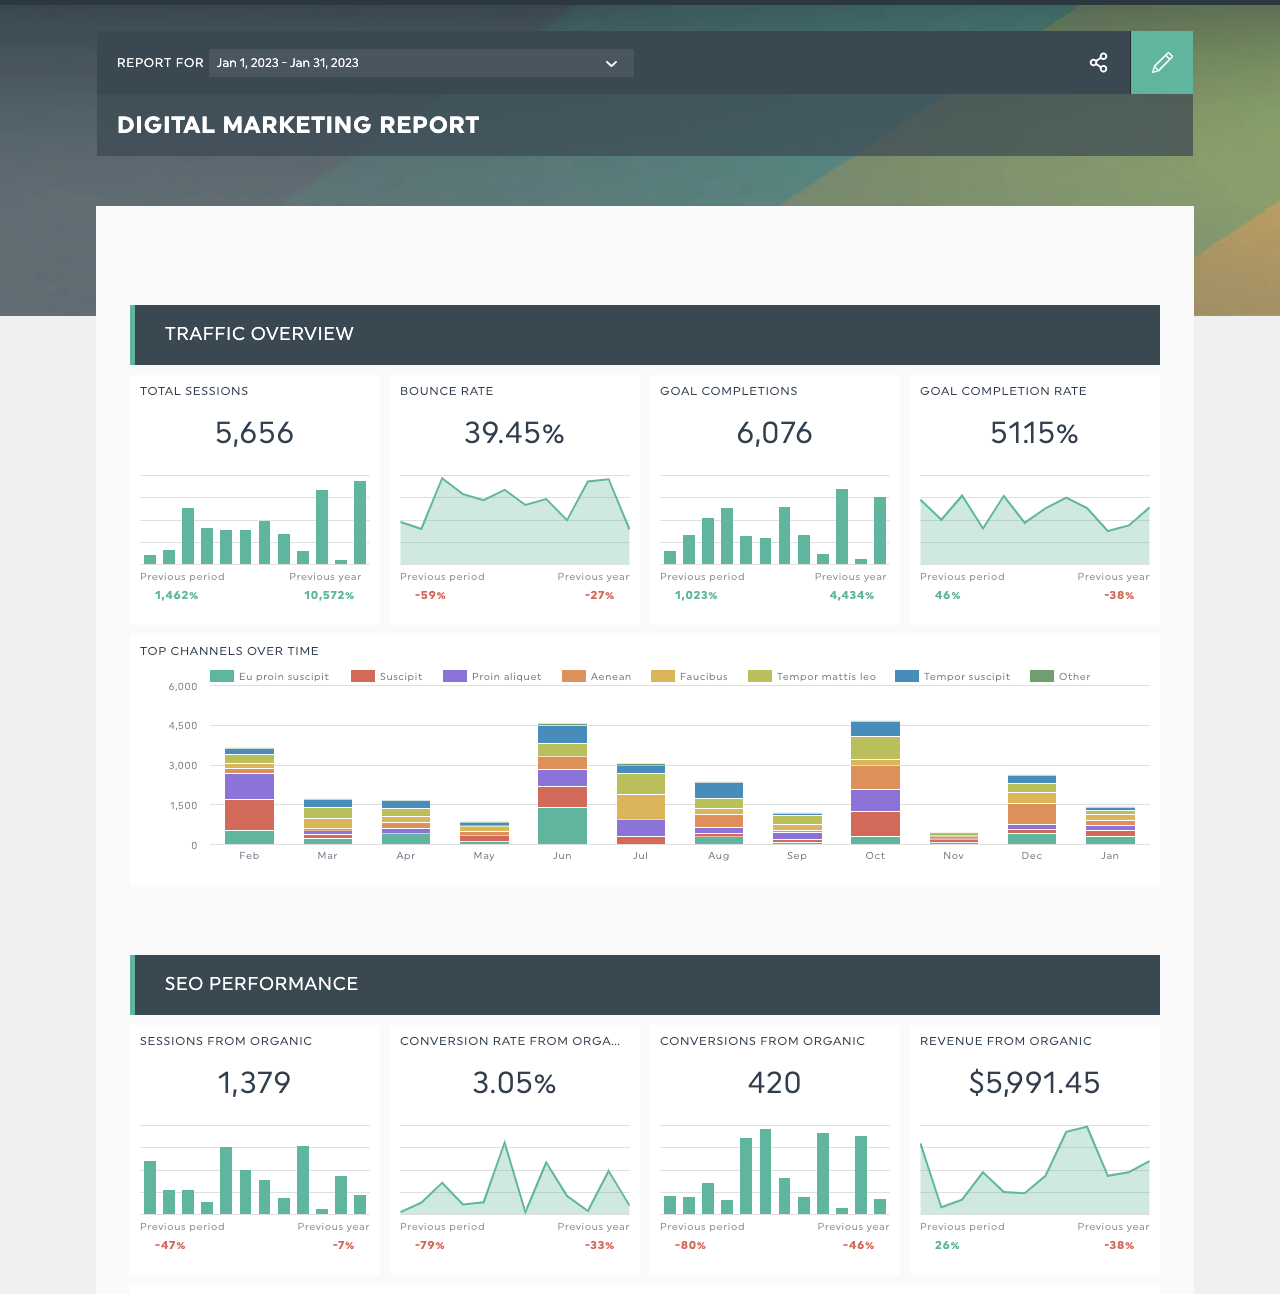
Get your B2B digital marketing report template with your own data!
Why track and report on your B2B KPIs?
- Budget allocation and decision-making: Tracking marketing KPIs like cost-per-lead, lead quality, and conversion metrics helps you identify which marketing campaigns to invest in.
- Track operational marketing progress: Analyze leads/MQLs generated and how much they cost over time to measure the effectiveness of your B2B marketing campaigns
- Identify and nurture high-value customer segments: How much money do your customers spend with you over time? Track customer lifetime value to identify ideal customers and net promoter score (NPS) to turn more of your customers into loyal, engaged customers.
Read more: What is a KPI and how to use it to scale your business.
Top 9 B2B marketing KPIs to track for success
1. Traffic metrics
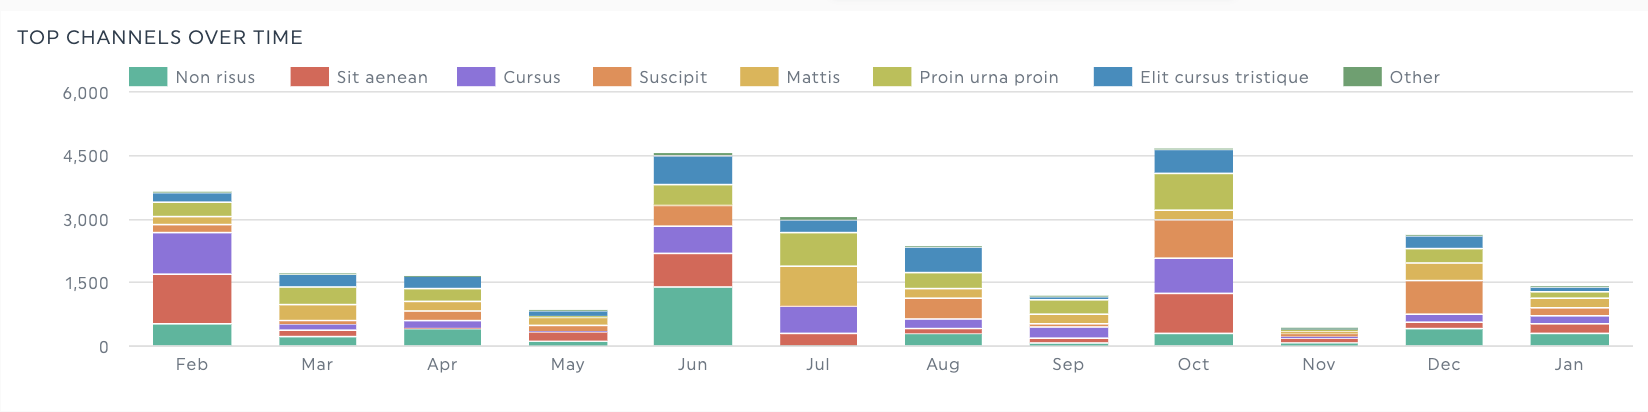
Using traffic metrics as a B2B KPI works best in two contexts within your marketing funnel.
- Comparing channel-specific traffic to new leads generated or customers closed: Helps determine the most effective acquisition channel for your business and keep marketing efforts focused on generating leads
- Analyzing traffic trends over time: Some marketing activities like content marketing and SEO take time to be effective, and comparing traffic over a 3-6-month period helps you gauge your progress accurately.
2. Bounce rate
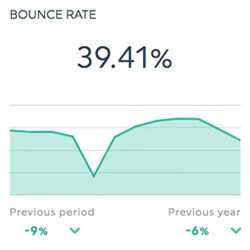
Track the bounce rate to see if your audience engages with your site’s content.
Like traffic metrics, bounce rate KPIs depend on the type of page you’re tracking and the industry you’re analyzing. Data from SimilarWeb shows average B2B web pages bounce rates hover around 41%. But these averages may or may not work for you, depending on the context.
How do you know if you have a healthy bounce rate? Ask these 2 questions.
- What is the visitor’s intention? Single-page sites with a specific CTA, like a contact us page, an e-commerce checkout page, or a campaign landing page, should have a lower bounce rate than a news site or blog where the visitor leaves after finding the specific information they need.
- Where do they come from? Visitors arriving through email or referral sources have the lowest bounce rate, whereas traffic from display ads or social media has the highest. It’s worth segregating your bounce rate data by traffic source to ensure it’s within expectations.
To give bounce rate metrics more context, look at these metrics
- Page load speeds: Understand if people are bouncing off your site from slow site speeds
- Pages viewed per session: Applicable to content-rich pages, this metric assesses if people stay on your blog beyond their initial search query, or bounce after getting what they need.
- Page exit rates: High exit rates on a thank you page is OK, while high exit rates on crucial conversion points like a checkout or form submission page deserve more attention.
3. Conversion metrics
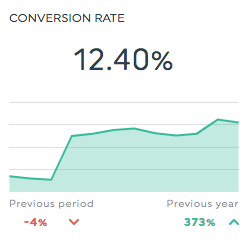
Ah, conversions, the sweet sound of people converting on your site, like signing up for a newsletter or requesting a free trial.
Besides looking at overall conversion rates, monitor a few conversion ratios to ensure you’re turning the right potential customers into paid ones.
- Marketing qualified leads (MQLs) to sales qualified leads (SQLs): Qualified MQLs will delight your sales team, and measuring this ratio analyses how many MQLs move on to become SQLs—determining the lead quality or whether the sales and marketing team’s definitions of a qualified lead line up correctly.
- Lead-to-closed sale conversion rate: Review your overall lead generation capabilities with this ratio. How many leads from marketing eventually turn into paying customers?
- View to conversion by channel: Which traffic source or channel converts the most leads? Note that this isn’t always your highest traffic-generating channel.
4. Cost per lead (CPL)
Besides monitoring operational metrics for your paid marketing campaigns like click-through rates (CTR), be sure to analyze your campaigns through another perspective - what’s the number of new customers brought in, and how much does each lead cost?
This brings us to the cost-per-lead metric - how much you spent in your paid advertising platform like Google Ads or TikTok Ads for a new lead. Monitoring this metric helps determine the return on investment for paid advertising campaigns.
5. Customer acquisition cost (CAC)
While we marketers get that sweet dopamine hit seeing that ping of a “New contact form submission” notification, here’s a sobering thought: leads alone don’t bring in revenue for your business; customers do.
So while you might want to look at cost-per-lead to optimize channel efficiency, monitor customer acquisition cost to maintain a broader view of your sales cycle.
This metric covers the following:
- Creative costs: Headcount/time cost of the team (like your designer, copywriter, or digital marketing specialist) who created your ad or content piece
- Operational costs: The cost paid to your paid marketing tools and any SaaS subscriptions like prospecting tools
6. Customer lifetime value (CLV)
Another critical metric for the long-term sustainability of your business, tracking customer lifetime value helps you answer these critical business questions:
- Am I spending too much to get a new customer? Knowing how much a customer earns for you enables you to adjust your spending to make sure you’re still turning a profit
- Which customer segment should I prioritize? Segment CLV data by company size, use case, or location to find the most (or least) profitable segment to see if you can make strategic decisions to serve your highest-value customers better.
CLV formula: (Customer Value) X (Average Customer Lifespan)
See it in action - How to calculate CLV for 3 business models:
- Subscription-based businesses: If your subscription cost $20/month and a customer stays with you for a year, your CLV is $240 (2012)
- Agencies: If a client pays you $5000 a month for your services and stays with you for 3 years, your CLV is $180,000
- E-commerce stores: If your customer spends $100 per order (Average order value), orders 5 times a year and stays with your brand for 2 years, your CLV is $1,000
7. Monthly recurring revenue (MRR)
MRR is the predictable total revenue generated by your business from all the month’s active subscriptions.
Besides expenses, MRR gives you visibility on business cash flow and its financial health - hence it’s an essential metric if you’re presenting to anyone responsible for making marketing budget decisions. MRR helps to:
- Forecast revenue and set marketing & sales goals
- Identify channels that bring in the most revenue
- Adjust marketing budgets or customer retention efforts
8. Net promoter score (NPS)
How likely would you recommend our company or product to a friend or colleague?
Loyal customers stay longer and spend more with your company, and answering this question to calculate NPS helps companies understand how their customers perceive them.
Customers usually fall into 3 groups, depending on their NPS scores:
- Score 9-10: loyal customers
- Score 7-8: passive customers
- Score 0-6: detractors, or unhappy customers
OK cool, but how do I use NPS data? Here’s 3 examples.
- Get honest feedback from existing customers:
- Measure effectiveness of your digital experiences and content
- Predict customer churn
9. Churn rate
Churn rate refers to the total number of customers you lose each year. It’s an essential metric to keep as low as possible. Higher churn rates can mean your customers aren’t satisfied enough with your services to renew with you.
Calculation: (Lost Customers ÷ Total Customers at the Start of Time Period) x 100.
To calculate churn rate, you’ll need:
- A time period (either monthly, quarterly, or annual)
- Starting number of customers
- Customers lost at the end of time measurement
But what can you do to improve your churn rate? Some suggestions.
- Review how you engage with your customers. Maybe it’s training for your customer support team, listening and taking action on customer feedback, or reviewing your onboarding/engagement processes.
- Educate your customers on your product: If you’re a software company, your customers may not know how to use your product to its fullest potential. Identify what your customers want to do with your product and address any gaps in education by providing resources.
Need more KPI examples? We’ve got a growing list here.
How to create a B2B marketing report in 3 steps with DashThis
Tracking your B2B KPIs doesn’t need to be tiresome or time-consuming. Here’s how automated reporting tools like DashThis can help you turn your marketing data into actionable data points in minutes, with no Excel spreadsheet or complicated setup needed.
Step 1: Sign up for your 15-day free trial with DashThis
Step 2: Select your dashboard template or create one from scratch
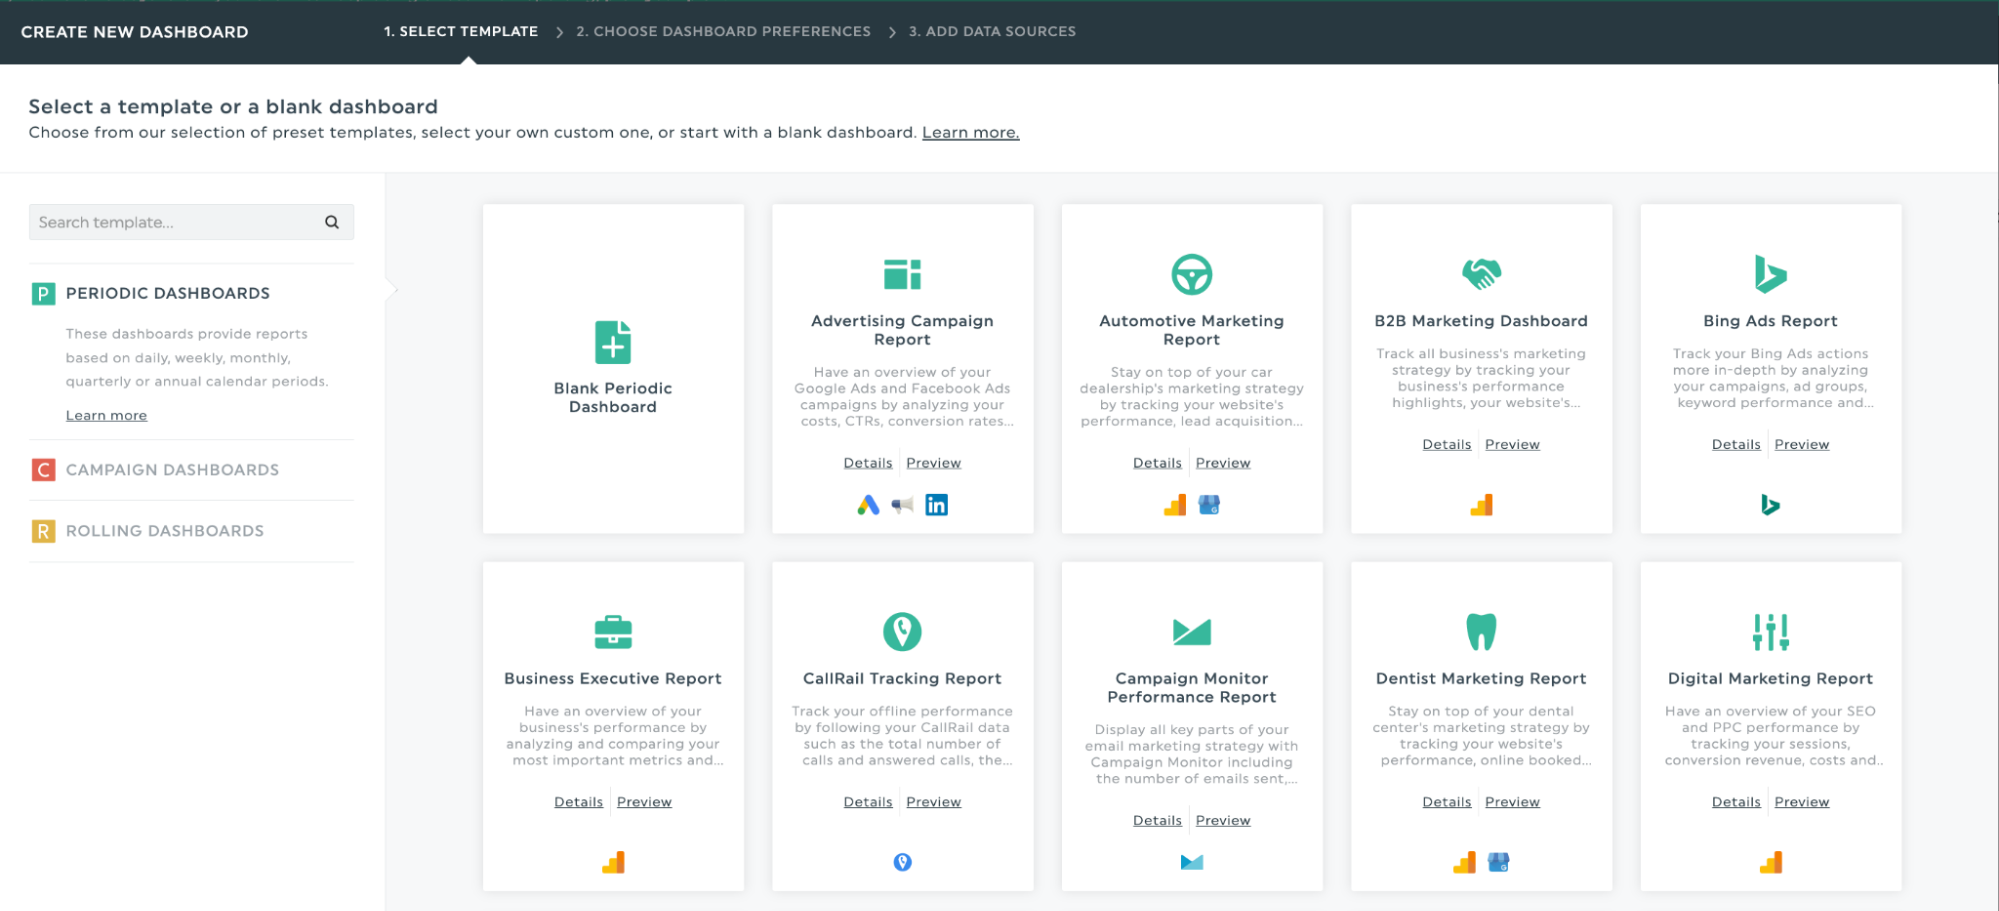
Part of DashThis’s library of dashboard templates
Step 3: Connect your marketing tools and import data to DashThis. Take advantage of our 30+ integrations with top-rated B2B marketing tools like Google Analytics 4, Ahrefs and more and showcase all your data in one report. We’ve also got a CSV file import to add your own custom data, including tools without an official DashThis integration.
Step 4: Select the metrics to include from our Preset Widgets to drag and drop as you desire.
Once you’ve created your report, share it with your stakeholders through a sharable URL, or automate a regular email dispatch to speed up decision-making.
Having trouble getting started? Try our preset templates to simplify your reporting.
Generate a B2B marketing report in minutes with our preset templates
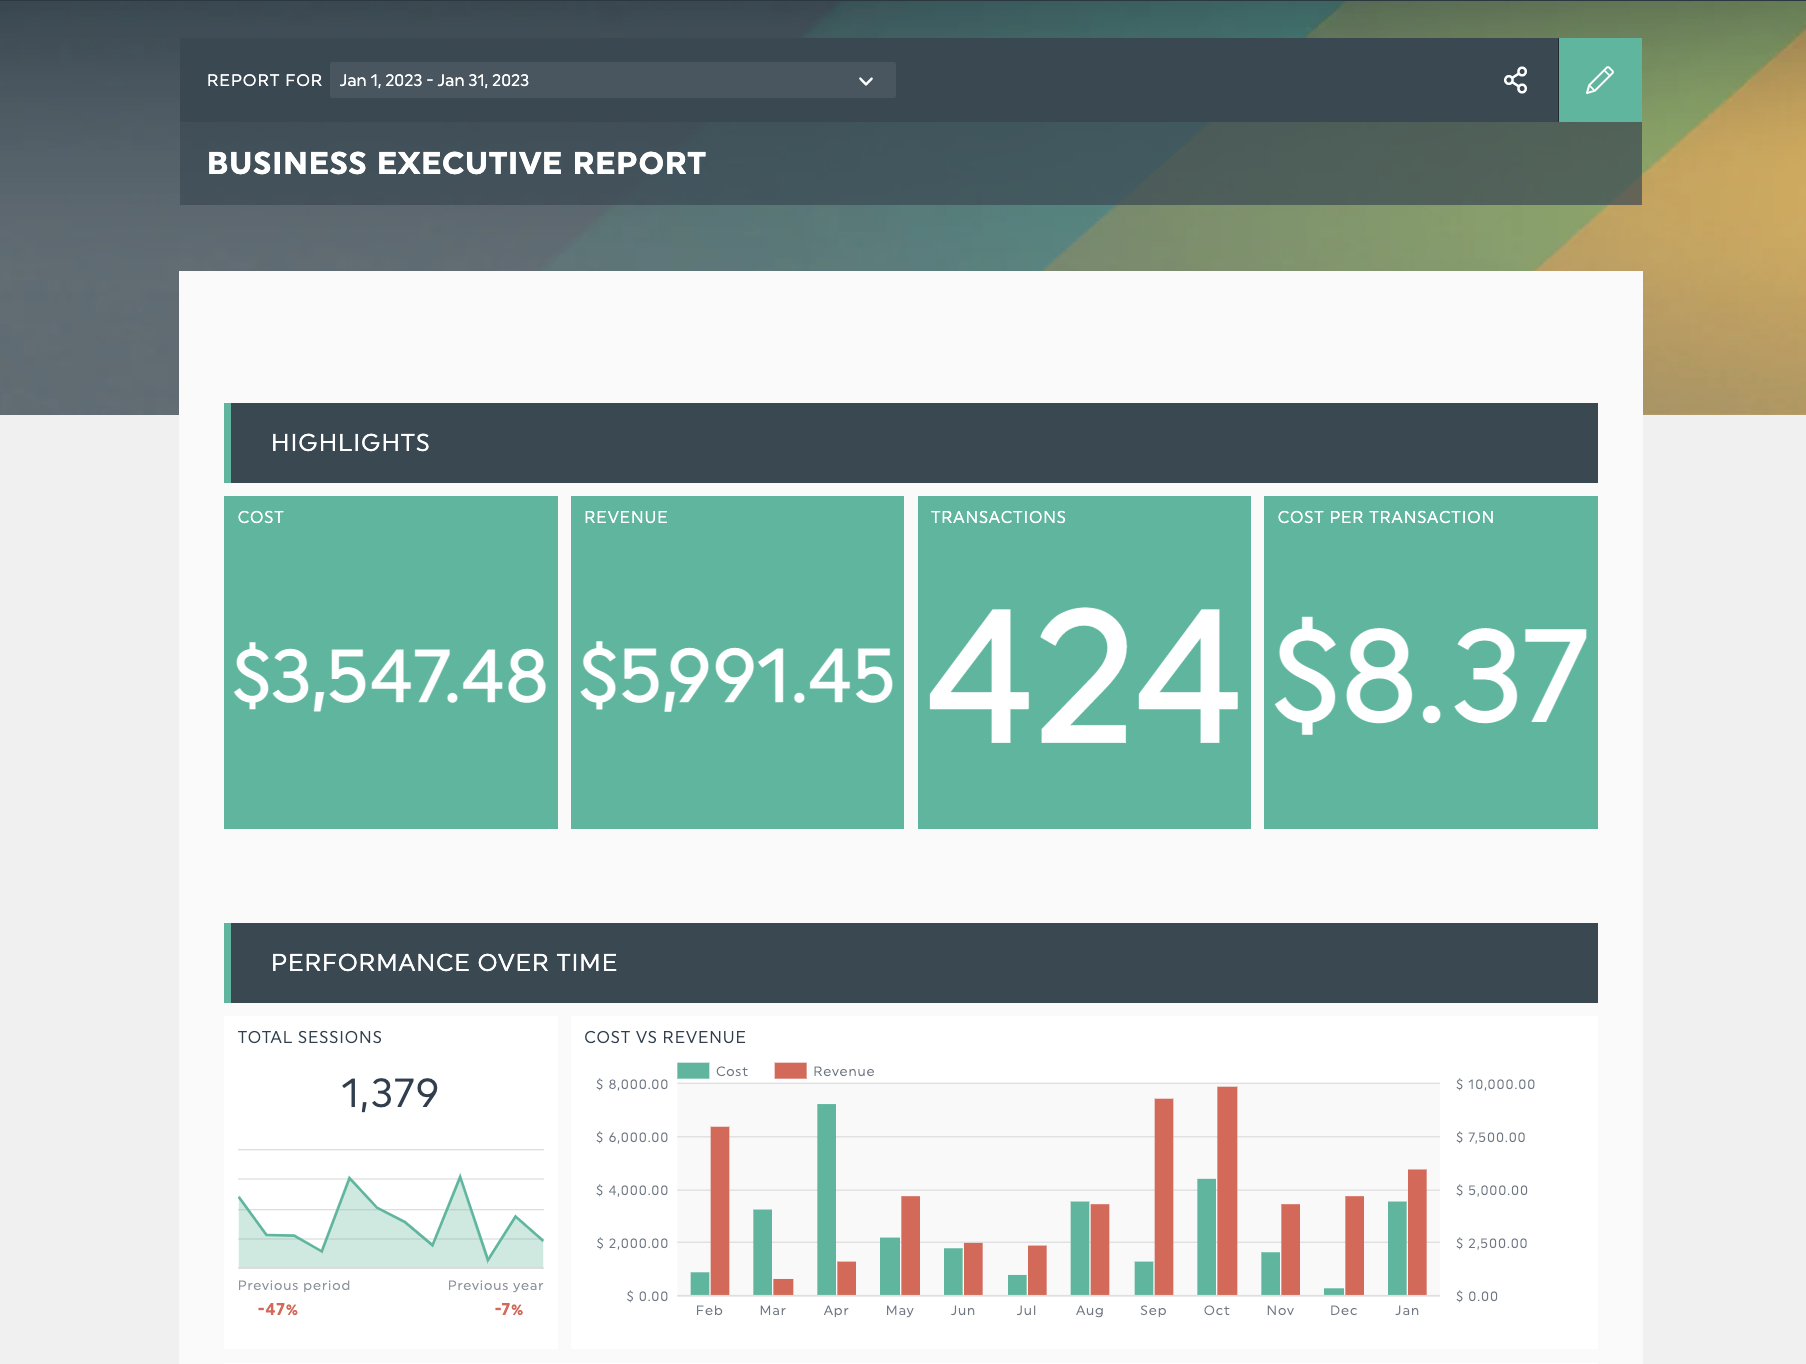
Get this business executive report template with your own data
Reporting this month’s sales and marketing report to your manager, senior executives, or board members unfamiliar with marketing? We've got you covered with our executive report template.
Template features:
- Our highlights section summarizes B2B KPIs like cost/revenue metrics or progress toward goals. This helps keep your report focused and your audience engaged.
- Editable widget to track a custom business goal like average customer lifetime value, track trial sign-ups or growth in market share for a go-to-market campaign
Simplify and automate your reporting with DashThis
Manage your reports less and invest more time driving results for your B2B clients. With the right insights, you’ll be able to plan the right content and drive the results your clients want - a win-win for everyone involved!

Ready to track your most essential B2B marketing metrics?
Read More

Don’t miss out!
Follow us on social media to stay tuned!
Automate your reports!
Bring all your marketing data into one automated report.
Try dashthis for free