Data vs Metrics vs KPI: Understanding the Differences (+ Examples)

“Is it just me, or does everyone use data, metrics, and KPIs interchangeably?”
You got that right.
There’s so many subtle nuances to these three quantifiable measures that many marketers struggle to tell the differences.
This quick guide explores the differences between data metrics and KPIs and shows you how to automate reporting in the blink of an eye.
- What is Data?
- What are KPIs?
- KPI Examples
- - Google Analytics metrics
- - Social media metrics
- - SEO metrics
- What are Metrics?
- How to Gather Data, KPIs and Metrics into a Single Report?
What is Data?
Data is a collection of facts or figures that provide information.
Qualitative (facts): User interviews, open-ended surveys, etc.
Quantitative (figures): Revenue, heatmaps, etc.
What are KPIs?
Key performance indicators (KPIs) are a set of high-impact metrics that monitor your progress in achieving your business goals.
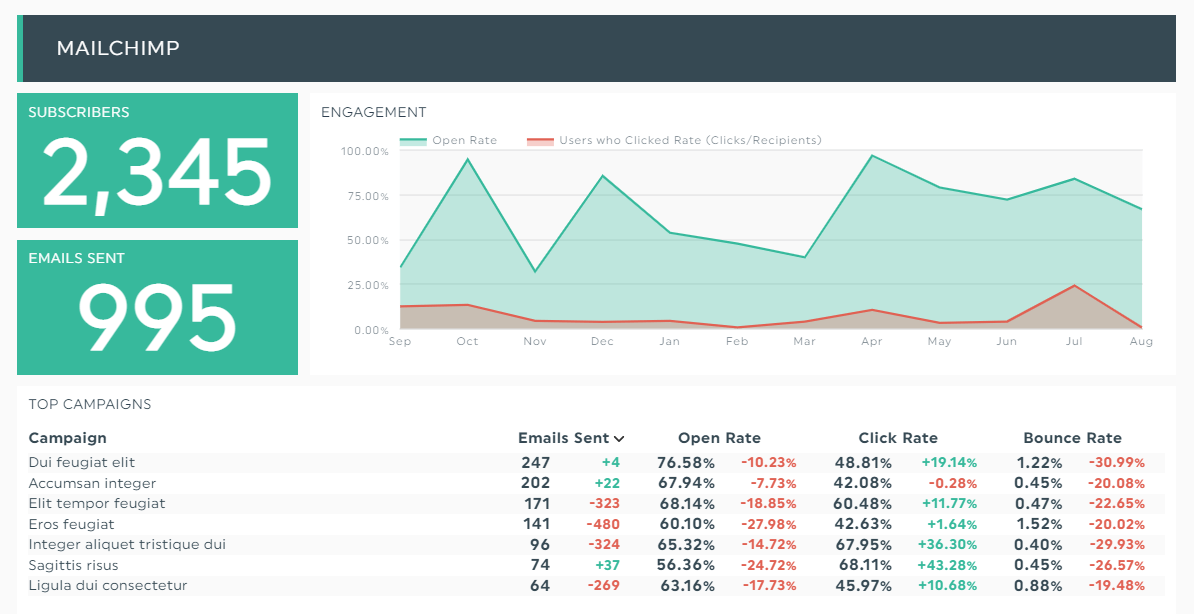
Grab this email analytics report with your own data metrics!
Common examples of KPIs include: number of monthly leads, sales growth rate, and percentage of increase in average order value.
KPI Examples
Meaningful KPIs lead to actual business results. Here’s how you can choose the right metrics based on your business goals.
Google Analytics metrics
Google Analytics tracks over 200 metrics in the entire funnel.
Whether you’re acquiring quality leads or converting them to customers down the funnel, it’s a wildly popular tool to measure the success of your marketing efforts from beginning to end.
Let’s imagine you want to measure the total revenue (KPI) for an ecommerce store. To determine how far along you are in hitting your goals, you might track the following: conversion rate, retention, and average order value (metrics).
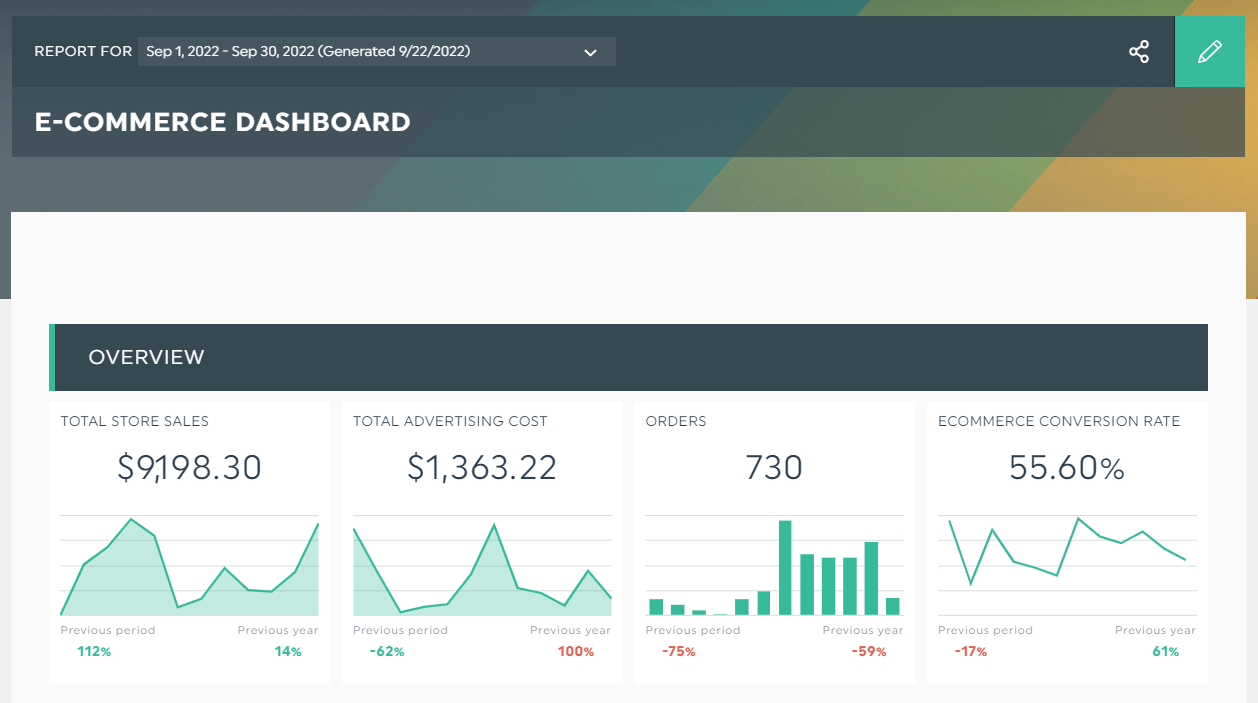
Grab this Google Analytics report with your own metrics and data!
These metrics determine your ecommerce marketing strategy for the next period.
For example, if the average order value is lower than the previous month, you might decide to improve it through cross-selling customers in abandoned cart emails or setting up order minimums to unlock incentives (e.g., discounts, free express shipping).
Share your recommendations for the next month or quarter within the report. On DashThis, click Static Widget > Comments.
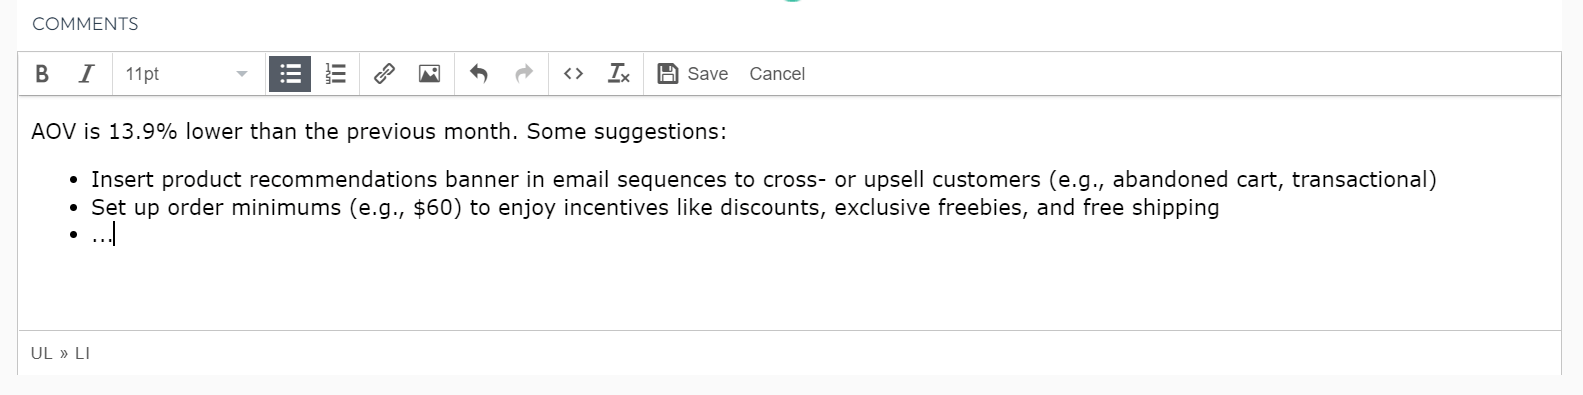
Click Save.
Now clients can view your recommendations without leaving your dashboard.
Social media metrics
Measure beyond your website performance to better understand your overall digital presence.
Social media platforms are excellent at building brand awareness and retargeting customers who left your website without completing transactions.
In this fictional scenario, you want to measure the number of leads acquired through Facebook Ads (KPI). And you decide to measure click-through rate, return on ad spend, and engagement rate, among others (metrics).
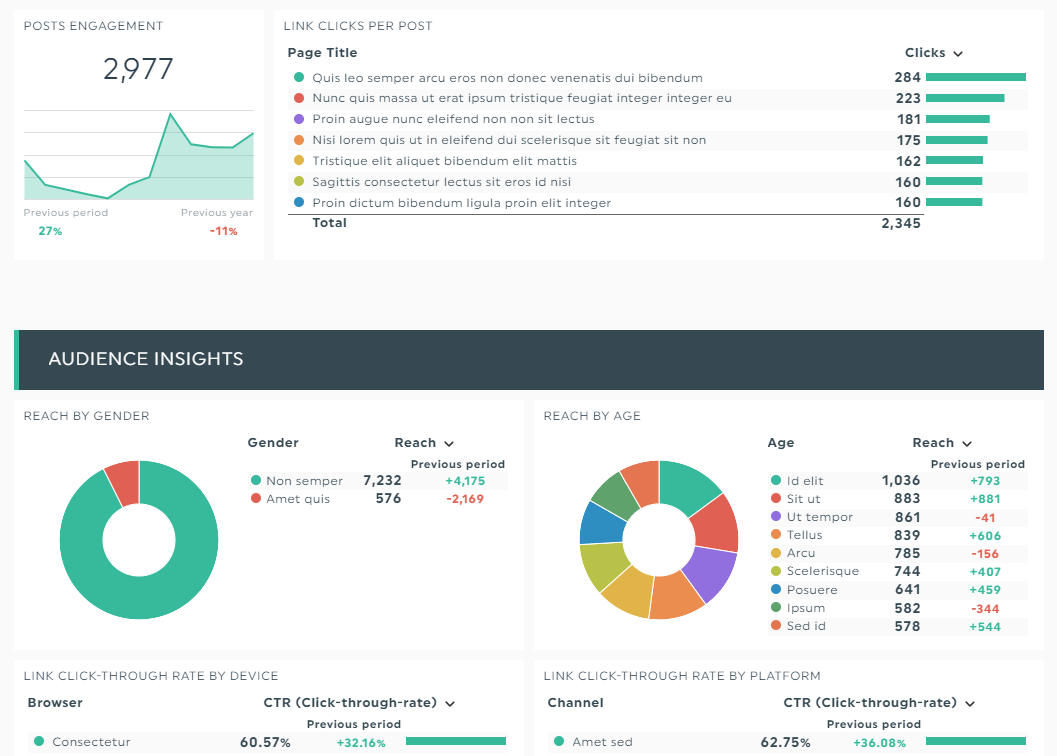
Grab this Facebook report with your own data and metrics!
These important metrics provide a goldmine of insights.
For example, a high click-through rate on ads and a high bounce rate on landing pages might indicate a problem. It could be caused by slow speed, a long lead generation form, or a missing call-to-action button.
You can easily explain these erratic results and assure clients with our Notes tool.
Hover to the metric’s dropdown icon and click Add Note. Briefly explain what’s causing the drop or rise in the metric and share how you plan to improve it in the next period.
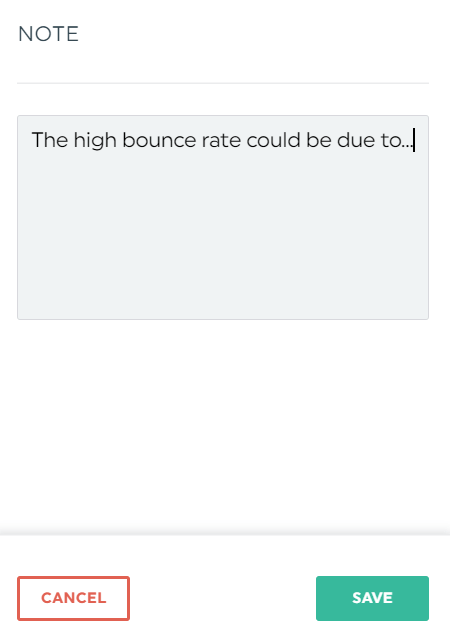
Click Save.
Your note will appear as an orange tab in view mode. Stakeholders will be able to access it in one quick click.
SEO metrics
SEO is the most cost-effective way to acquire and retain customers, despite it being a long-term game.
When you rank high on the SERPs, you gain free and consistent traffic on autopilot. That’s a steady stream of new leads without you doing any massive legwork.
Let’s say you want to increase the number of demo requests from your content efforts (KPI). You decide to measure page views, conversation rate, number of backlinks, etc. (metrics).
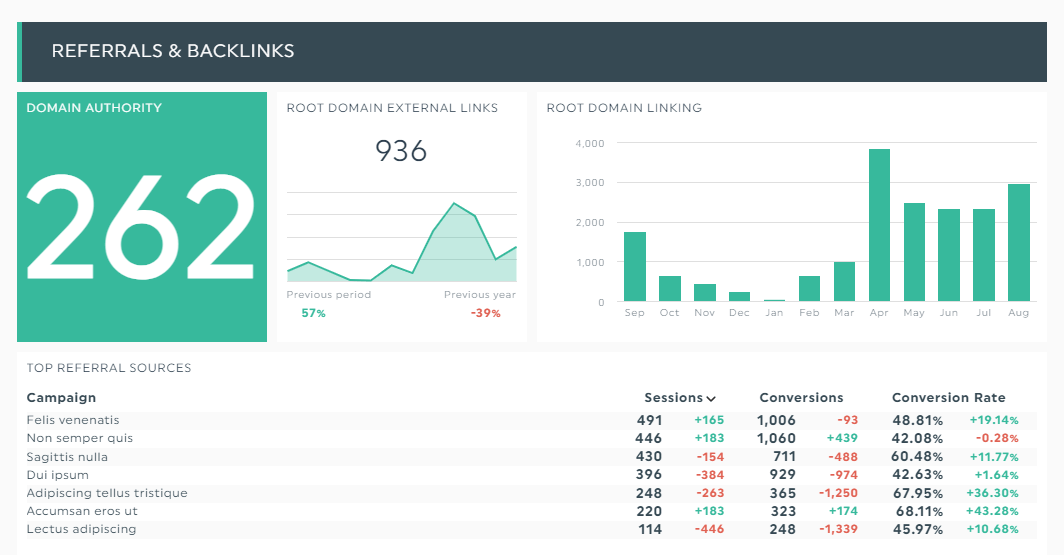
Grab this SEO report with your own data metric!
Metrics like these help you decide the type of content marketing campaigns to focus on.
Say you notice your best-performing post dropped to the ninth spot on the SERPs. To bump it back up to its original spot, you could optimize it by adding more keywords or generating more authoritative backlinks.
What are Metrics?
Metrics are a group of data points that track the performance of a specific function.
Examples of metrics include top landing pages, number of link clicks, and win rate.
The fundamental difference between KPI vs metrics lies in the focus, but they are nonetheless both essential to track.
While KPIs focus on business goals, metrics focus on the processes or activities that may or may not relate to said business goals.
As Austin Chia from AnyInstructor says: "Metrics reveal the true condition of your business's health. By measuring metrics, you quantify the direct output of your business processes into numbers – which can help identify inefficiencies in your business. Without measuring metrics, your business might miss out on these hidden opportunities to optimize efficiency."
How to Gather Data, KPIs and Metrics into a Single Report?
An insightful report includes multiple building blocks: the right metrics, easy-to-understand graphics, and high-level recommendations for the next period.
Unfortunately, it's challenging to create these reports from scratch when you’re dealing with hundreds of data metrics across different channels and clients.
With DashThis, you can easily gather any type of data into one beautiful report in the blink of an eye.
Here's how it works:
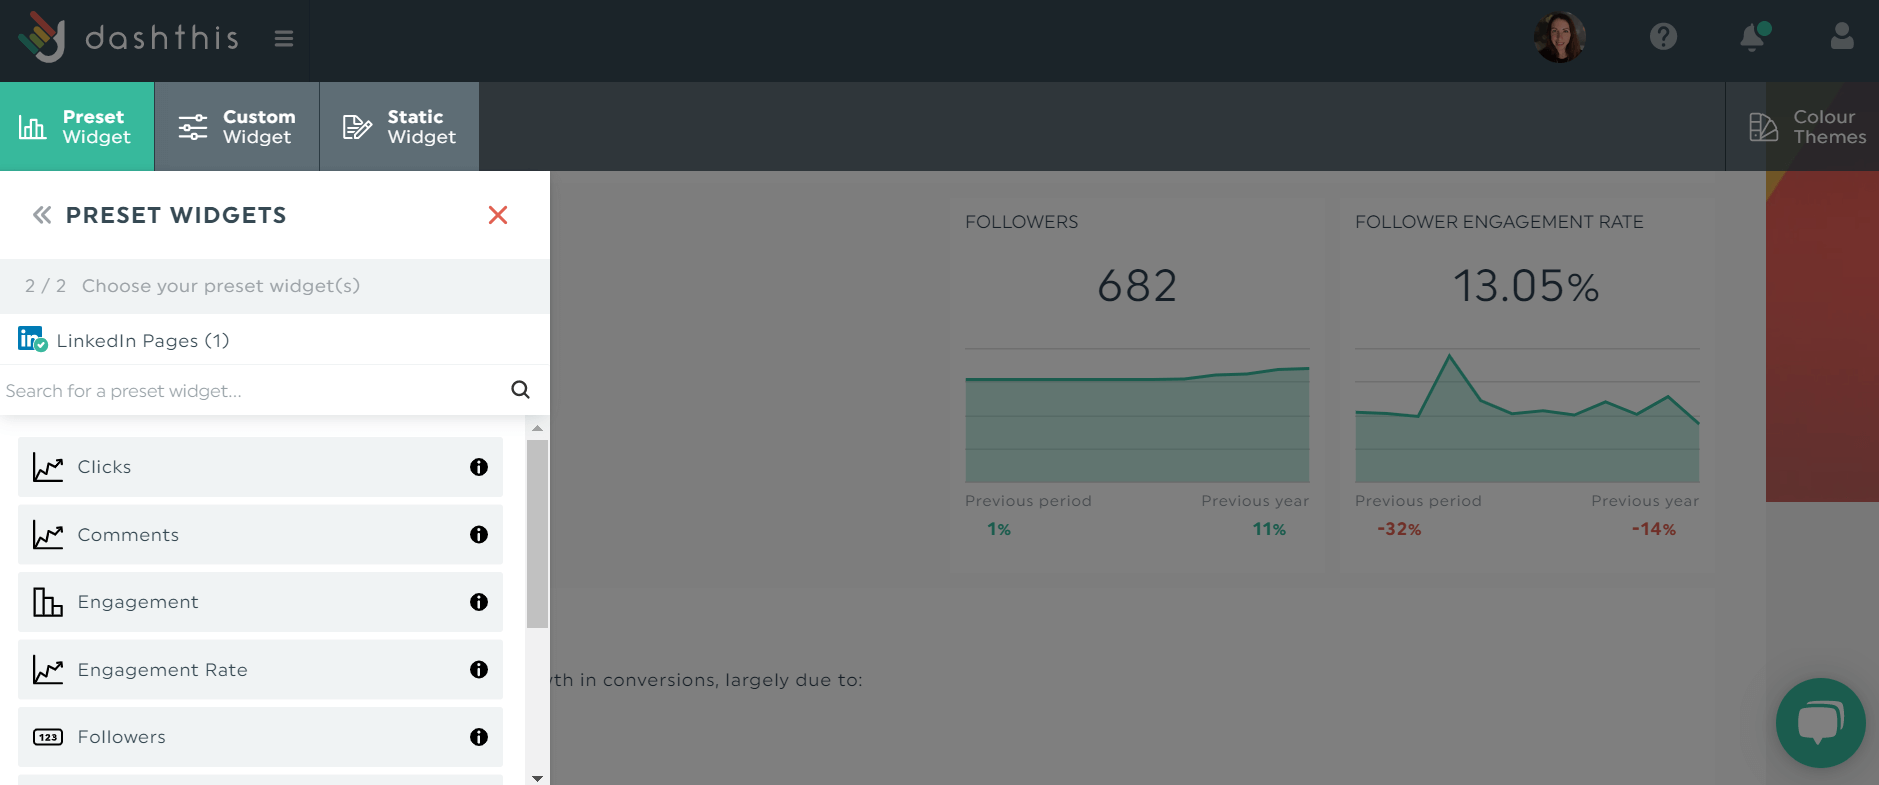
- Select a dashboard from 40+ report templates
- Connect your favorite marketing analytics tools (e.g., Campaign Monitor API)
- Pick your metrics from Preset Widgets
DashThis will proceed to grab the marketing data from your selected data sources, turning them into graphs and charts automatically.
Drag and drop your dataset as you desire to form a cohesive look. You can use headings to organize them and change the color theme to reflect the client’s branding.
After you finish creating the report, share it with stakeholders via an URL link.
Or automate report distribution with real-time access. That way, every team member or client can review the dashboard in a single glance and compare past performance quickly within the same interface.
Measure what matters.
The right data, metrics, and KPIs speed up decision-making and determine the company’s initiatives for the next time frame.
DashThis is an automated marketing reporting tool that gathers your data across different channels and turns them into one beautiful report.
Start your free DashThis 15-day trial to automate your reporting today.

Ready to track your metrics?
Read More

Don’t miss out!
Follow us on social media to stay tuned!
Automate your reports!
Bring all your marketing data into one automated report.
Try dashthis for free