Scorecard & dashboards: What's the difference, best practices & how to

Scorecards and dashboards, aren’t they the same thing?
They both track performance, but how do these two methods of tracking business performance differ? Which method is suitable for your business?
In short, dashboards excel at monitoring performance in real time, while scorecards serve as goal management tools. But you can use them together.
Read on if you’ll like to know how.
- What is a dashboard?
- - When is best to use a dashboard?
- - 3 best practices to create an engaging business dashboard
- What is a scorecard?
- Scorecards vs. dashboards: What are the differences?
- How to create a business dashboard with DashThis
- Elevate your measurement game with dashboards and scorecards
What is a dashboard?
Dashboards are a set of data visualizations and charts arranged logically in one overview.
They bring together all relevant company metrics and key performance indicators (KPIs) in one place for easy reference. Besides text and numbers, dashboards can also include visual aids like graphs, charts, and gauges to monitor and compare business performance in real-time.
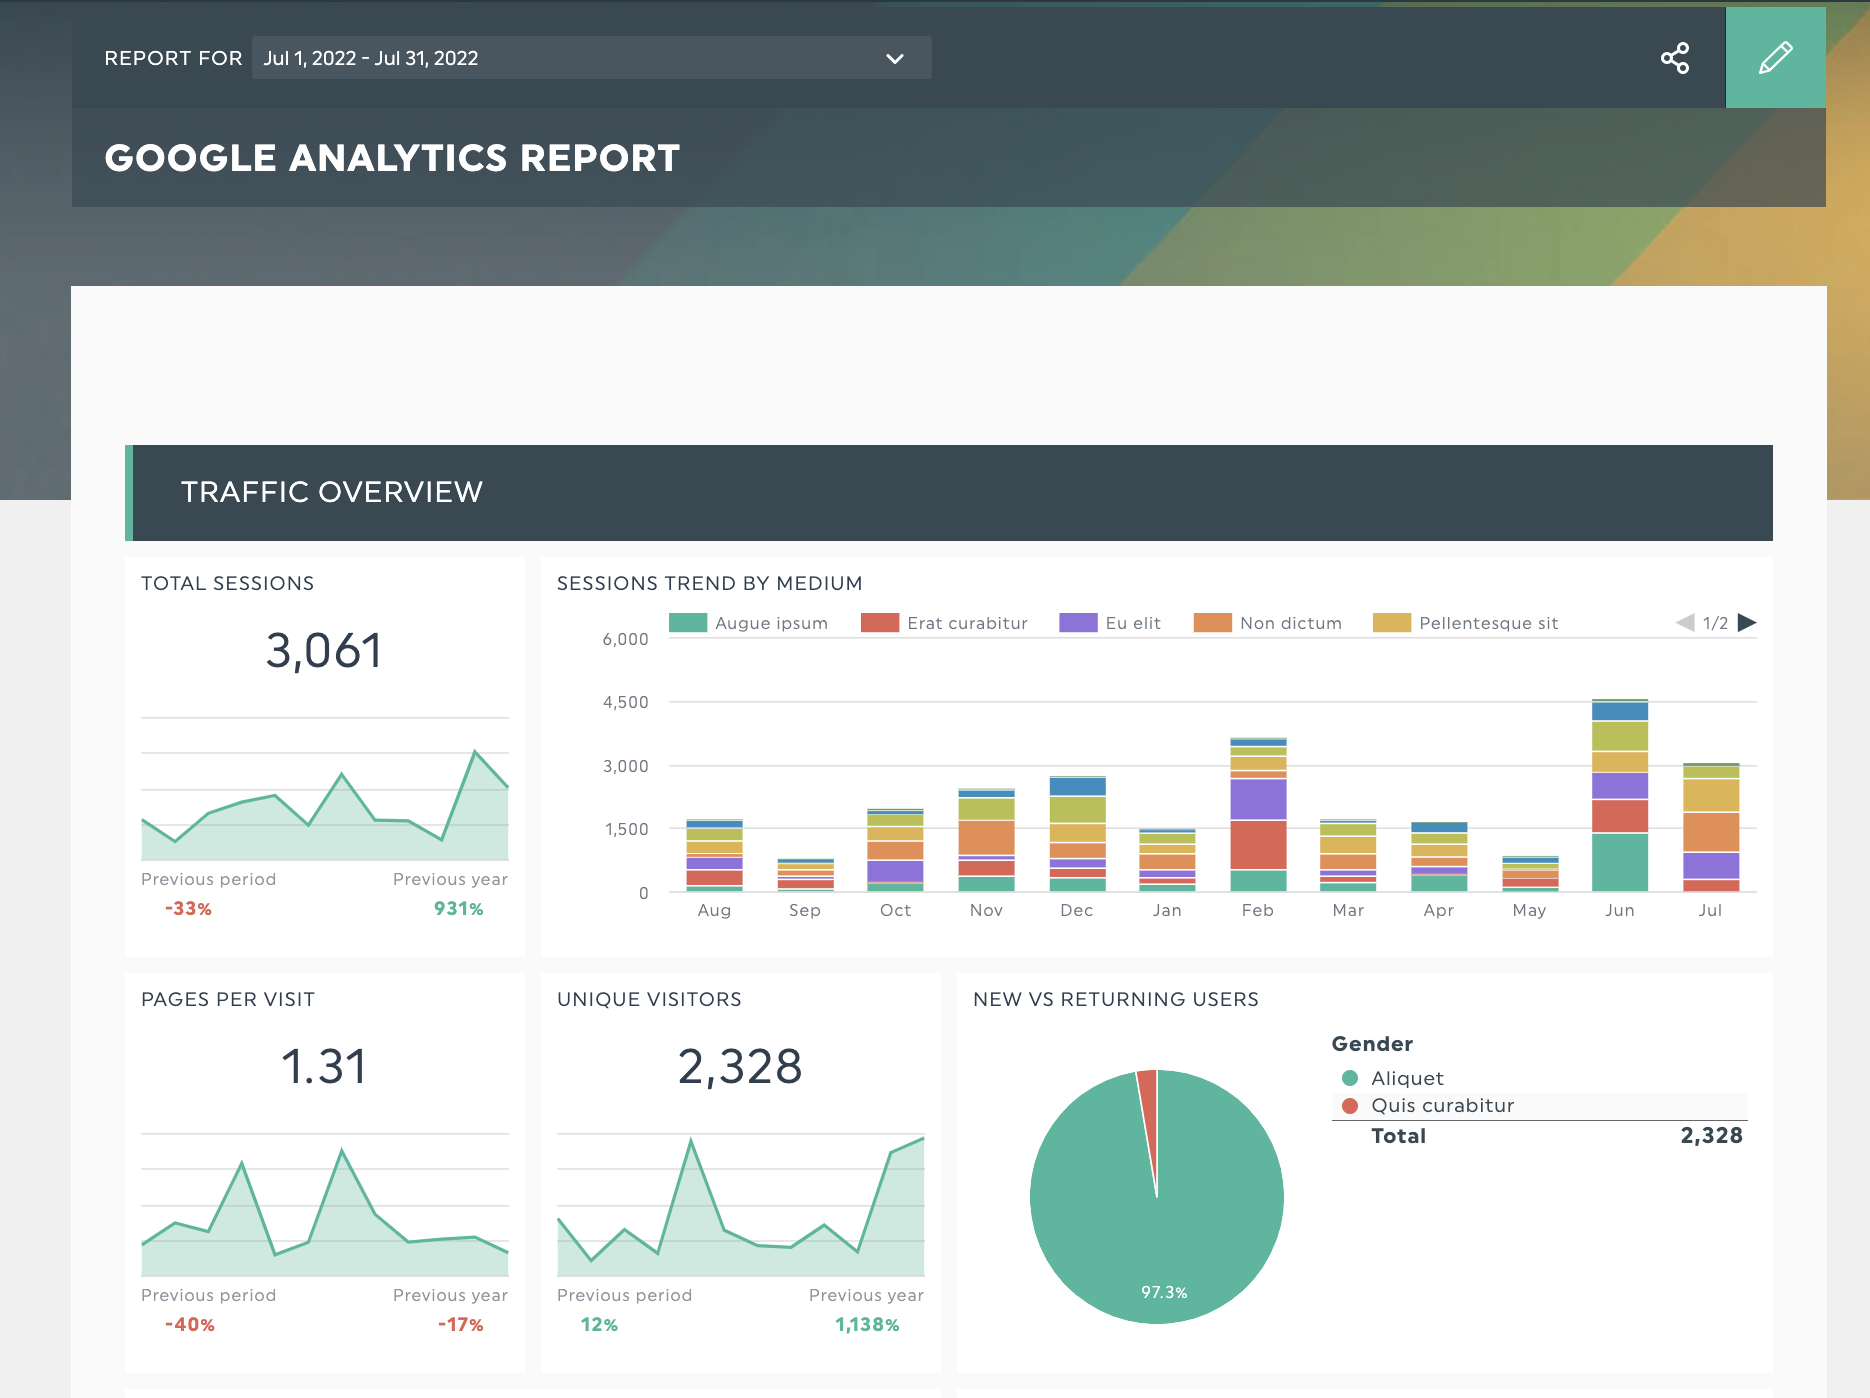
Dashboard example: Look at DashThis’s call tracking reporting dashboard for sales or customer support teams.
![]()
Get this call tracking dashboard with your own data!
Suppose you’re leading a sales or customer call center team, and want to review your team’s performance in the month.
Using a dashboard, you’ve got the highlights at a glance, helping you answer questions like:
- How many calls have your team made?
- Where are these calls coming from?
- How does the volume of calls vary over time?
Are calls spiking in a particular month? The same people calling in multiple times a day? Now you’ve got all the data in one place to help you recognize and respond to issues quickly.
When best to use a dashboard?
Real-time visibility to make short-term to medium-term operational decisions
Dashboards are effective for rapidly changing situations that require decisive action.
Some example situations:
- You’ve launched a multi-channel marketing campaign and need to monitor how each channel performs.
- You see an unusual spike in customer support calls from a specific region.
- You want to understand the performance of the marketing for your small business.
You need to centralize data across multiple data sources
With the average midsize business holding 238 SaaS subscriptions, we now expect to review various data sources.
Imagine trying to gather all that data and making an informed decision. You'll be wasting hours manually exporting data without a tool to aggregate all the data and put it in an easy reference point. Not to mention you might miss out on critical insights from different sources.
A dashboard address this issue. Dashboard tools like DashThis offer a range of data integrations from marketing tools, helping you import your data into a dashboard with a few clicks.
3 best practices to create an engaging business dashboard
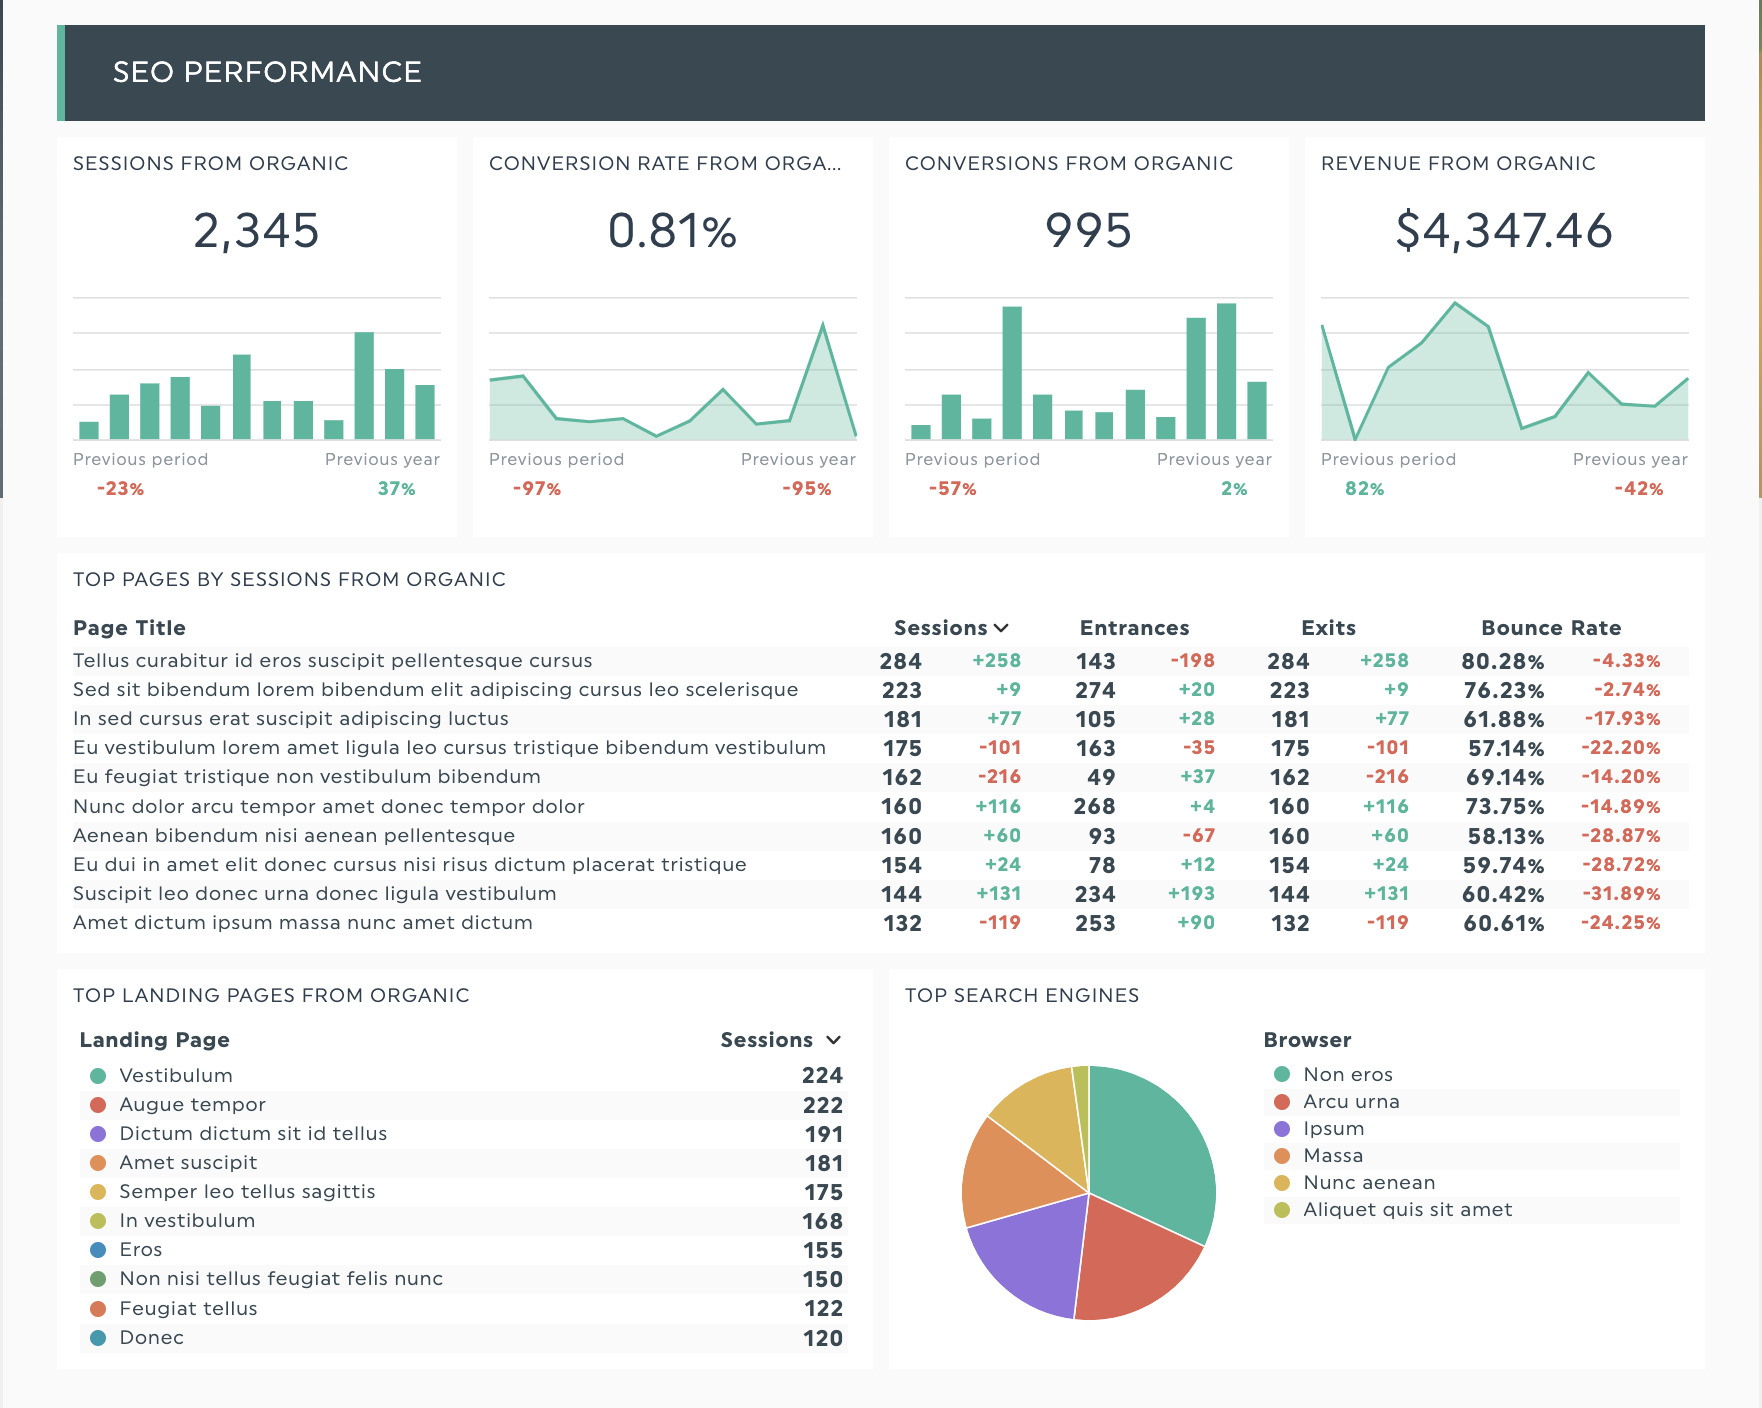
Get your e-commerce dashboard with your own data!
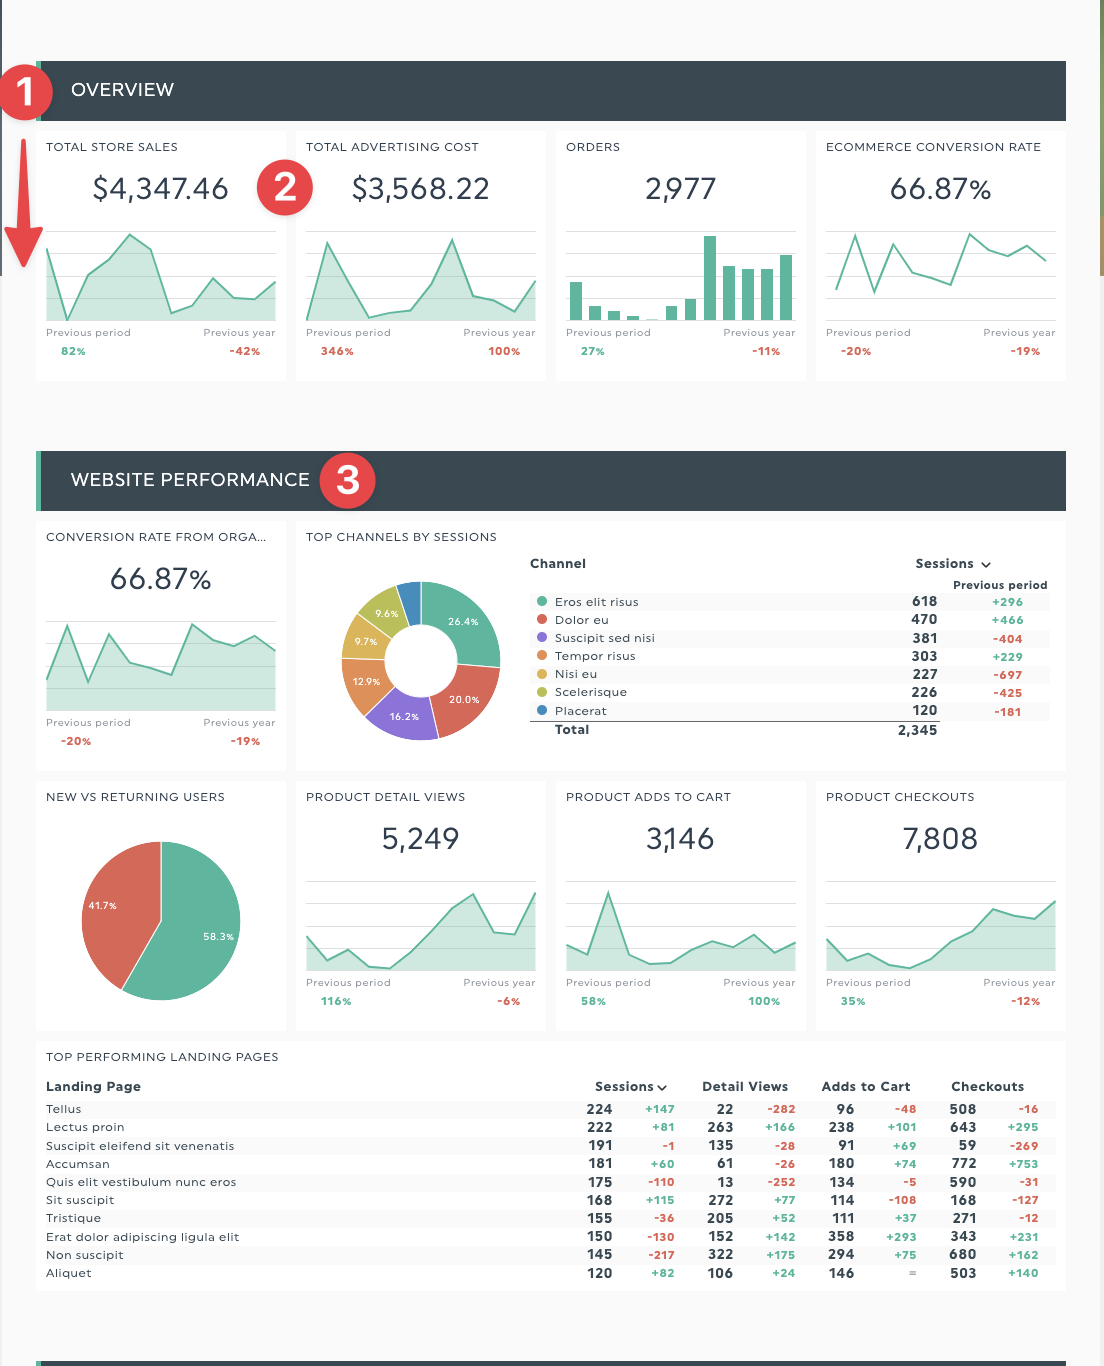
- Give your business dashboard a logical structure and layout. Place key insights on top, with supporting information towards the middle and end. In our e-commerce dashboard, we’ve placed critical KPIs like revenue numbers and conversion rates on top. Ideally, the person reviewing your report should be able to find the information they need within 5 seconds.
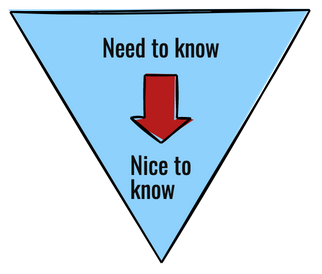
Tip: This structure is like the inverted pyramid used in journalism, which states important information at the beginning of an article.
- Use visuals to depict data. Visuals communicate information 60,000 times more effectively than words and numbers. Use the right charts to show the data you need. For example, line graphs are great for showing a change in metric over time, whereas a pie chart effectively shows the detailed composition of a data set. (E.g., top traffic channels by sessions)
- Be brief but focused. We’ve included white space between sections, with clear headers and subheads, to guide our readers to important information. Start by understanding your dashboard’s aim and including KPIs that provide the information.
What is a scorecard?
Scorecards answer “how are we doing on X against our target?”
Like aiming for a gold star at a competition, scorecards track your progress against a goal, helping decision-makers understand how an initiative performs against its target.
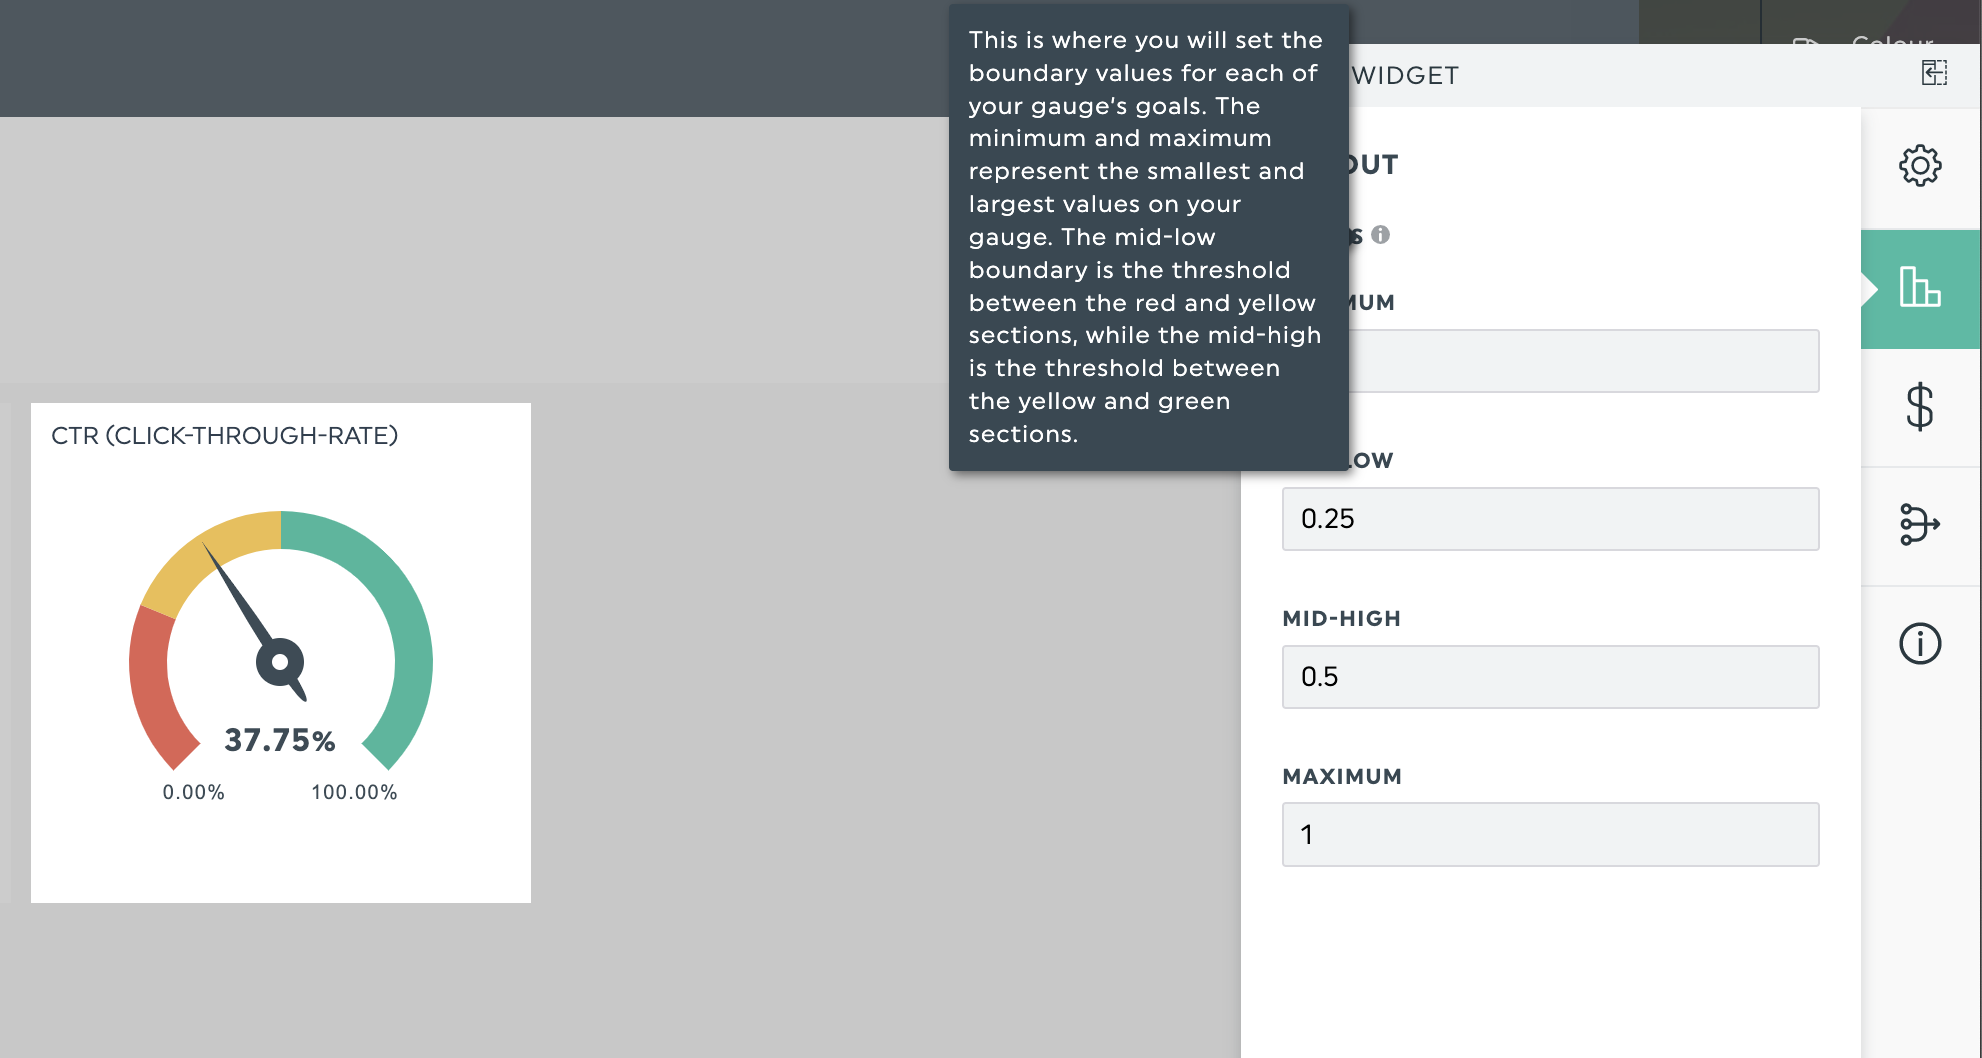
Tip: Gauge widgets are an easy visual way to show progress towards goals and establish benchmarks. Set your boundaries to define the widget's red, yellow, and green areas.
This keeps your team aligned and focused on current progress towards business objectives. Go further by pairing gauges with a concise explanation and propose a few solutions.
2 ways scorecards help you manage business goals.
- Zooming into a specific area of your business. Track the overall performance of a department. Launched a new go-to-market campaign? Track key metrics like acquisition costs and monthly recurring revenue to measure progress.
- Get a bird's-eye view of your overall business performance. Also known as the balanced scorecard (BSC), this management tool analyzes organizational performance from 4 holistic perspectives; financial, customer, internal, and employee growth. Helps in communicating strategic objectives across the organization.
Read more: 5 KPI scorecard templates to keep your business on track
2 best practices for using a scorecard
1. Ensure a clear link between scorecard metrics and strategic goals.
For example, if one of your primary goals is to improve regional sales, you’ll want to track revenue-related goals and how much profit you’re making.
This scorecard helps you see these essential metrics at a single glance.
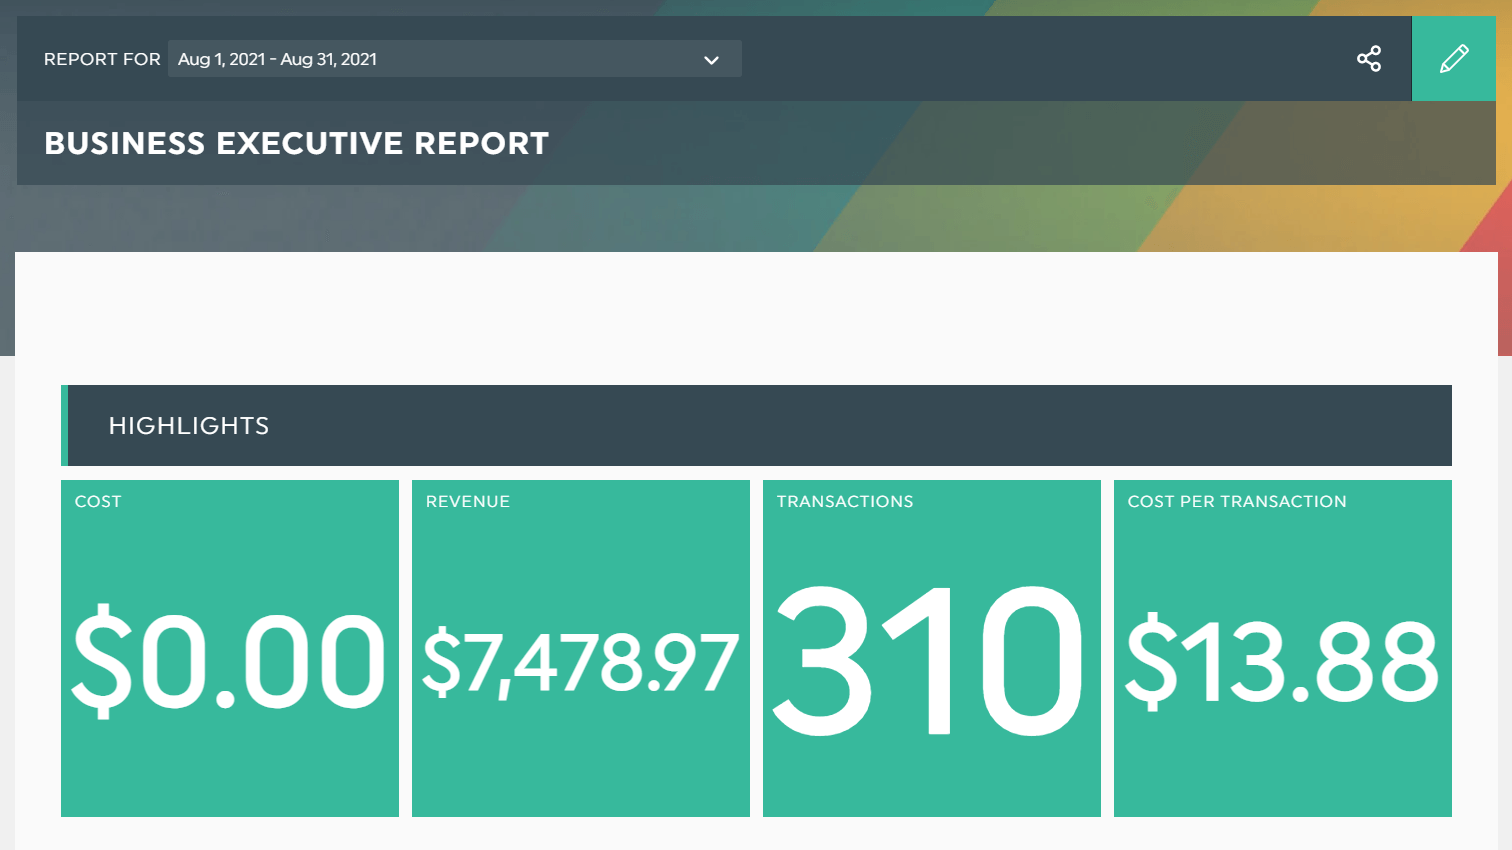
Grab this scorecard template with your own data!
Add context for your scorecard with notes covering:
- How close you are to a goal (either % or numerical value works fine)
- Change compared to the previous report
- Notes on what worked/what didn’t this month, assuming a monthly report cycle.
2. Review your chosen metrics regularly (once every 6 months at minimum)
Shifts in competitor strategy.
Drastic shifts in the market.
A global pandemic changing the way of life for many.
Businesses need to adapt to these changes to stay relevant.
In these situations, it’s essential to stop and take stock. Do your scorecard metrics still relate to your chosen strategy?
Scorecards vs. dashboards: What are the differences?
Dashboards are better at performance monitoring, whereas scorecards excel at performance management.
If dashboards monitor metrics in real-time, scorecards measure progress towards a goal.
Use dashboards to track ongoing campaigns or to get a snapshot of business performance.
Take this SEM dashboard, for example.
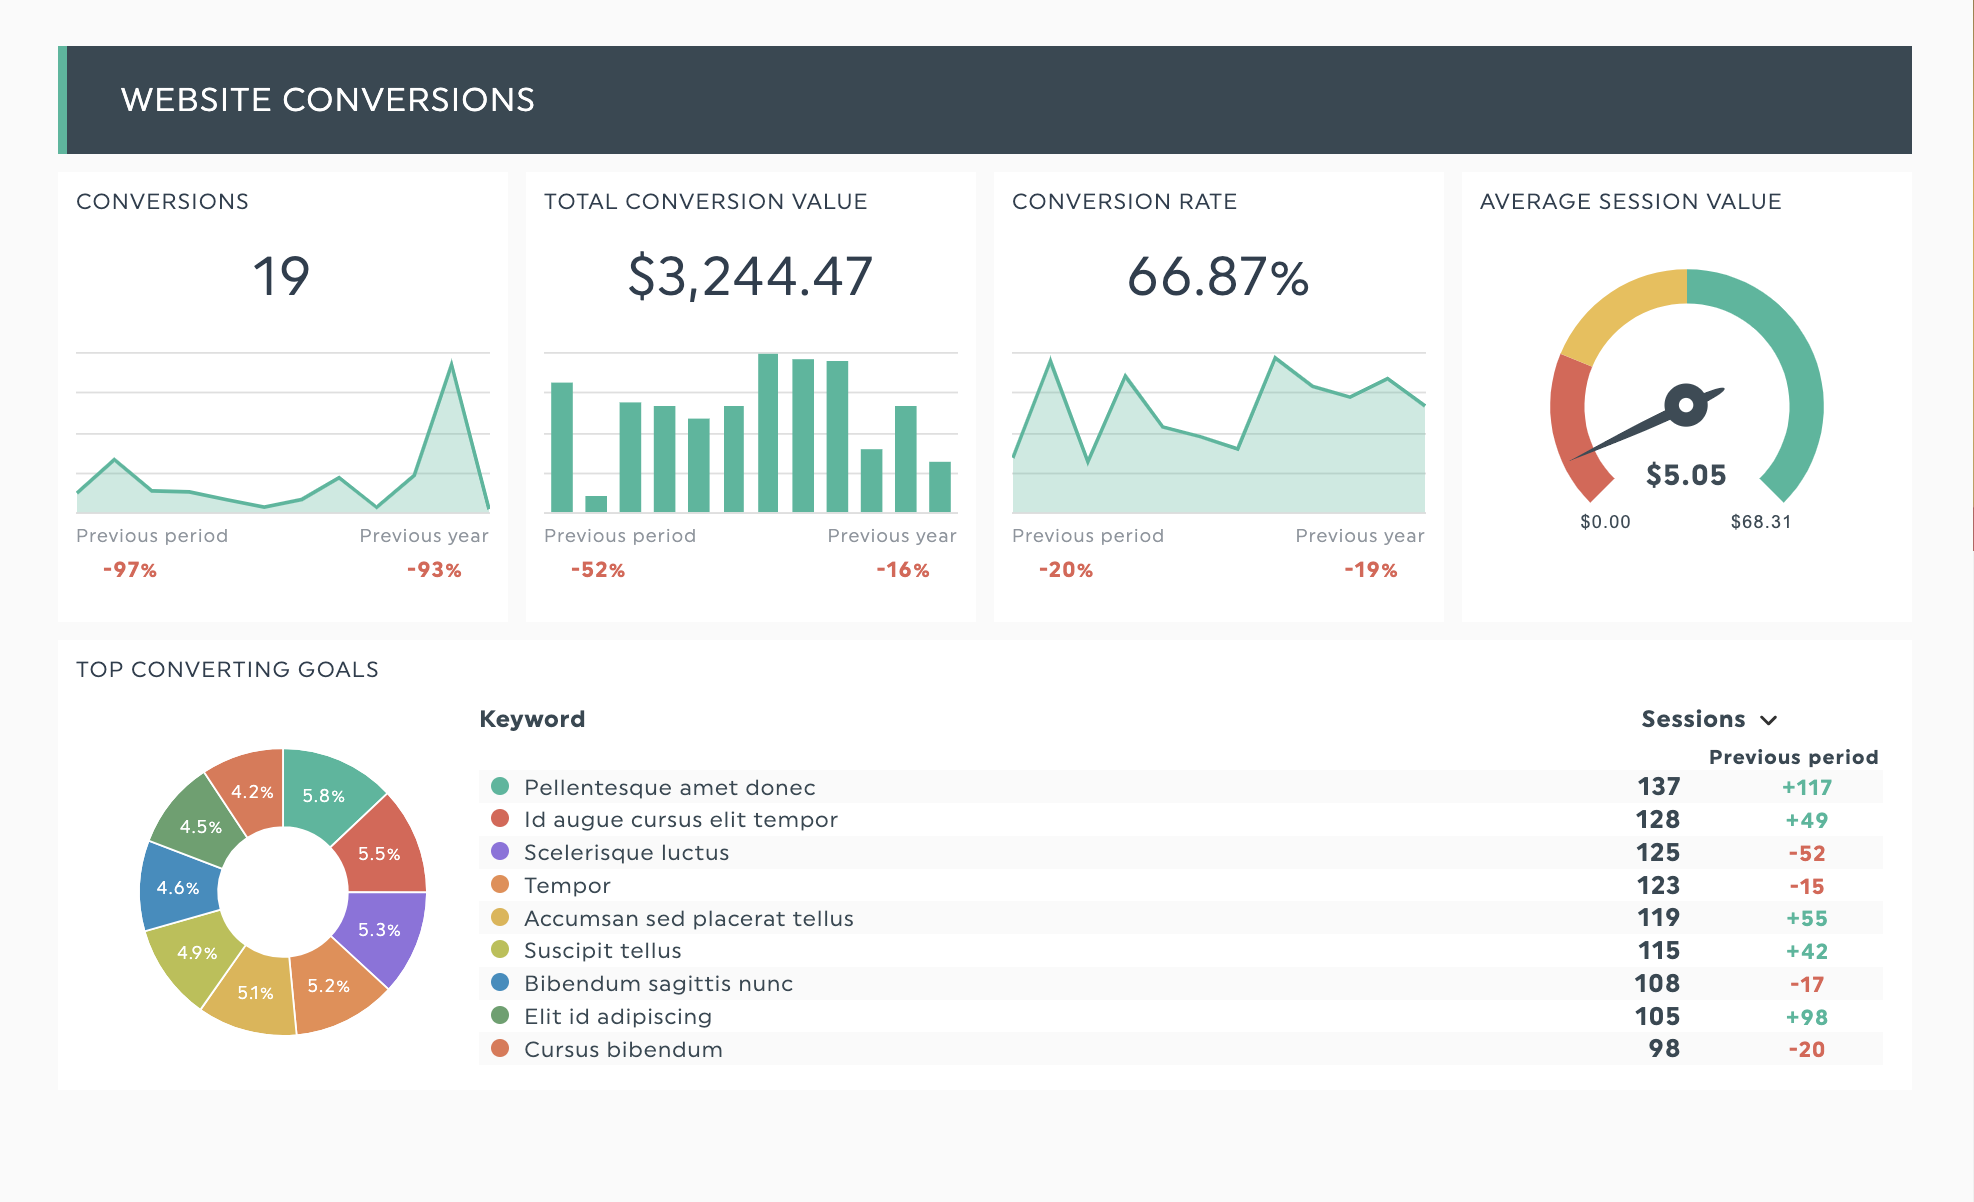
Grab this SEM dashboard template with your own data!
Graphs and charts measure key campaign metrics like conversions and average conversion values, giving you insights on your SEM campaigns.
Scorecards excel at concisely measuring progress with strategic goals.
These come in handy during strategic planning sessions to forecast performance effectively and communicate company progress to employees, shareholders, or clients without getting bogged down with too many metrics.
Dashboards support operational decisions, while scorecards are better suited to support longer-term strategic planning.
Dashboards are more suited for team managers who need a view of operational metrics.
In contrast, scorecards are more useful for people involved in strategy or who want to review an overview of performance.
As scorecards connect company objectives, KPIs, and actions to reach a target value, they complement popular goal-setting methodologies like OKRs or the SMART goal methodology to define success criteria and measure progress.
Which measurement model does your business need?
Hint: you don’t need to choose between the two.
Here’s how you can use dashboards and scorecards to streamline your reporting.
Let’s say you’re a marketing agency that needs to measure a multi-channel marketing campaign to drive qualified traffic and generate leads across SEO, PPC, and email marketing channels.
Use a scorecard method to summarize your key metrics.
In the example image, we’ve tracked total sessions and bounce rate to measure our progress towards our goal of generating qualified traffic, while goal completions and goal completion rate track how many leads our campaign has brought in.
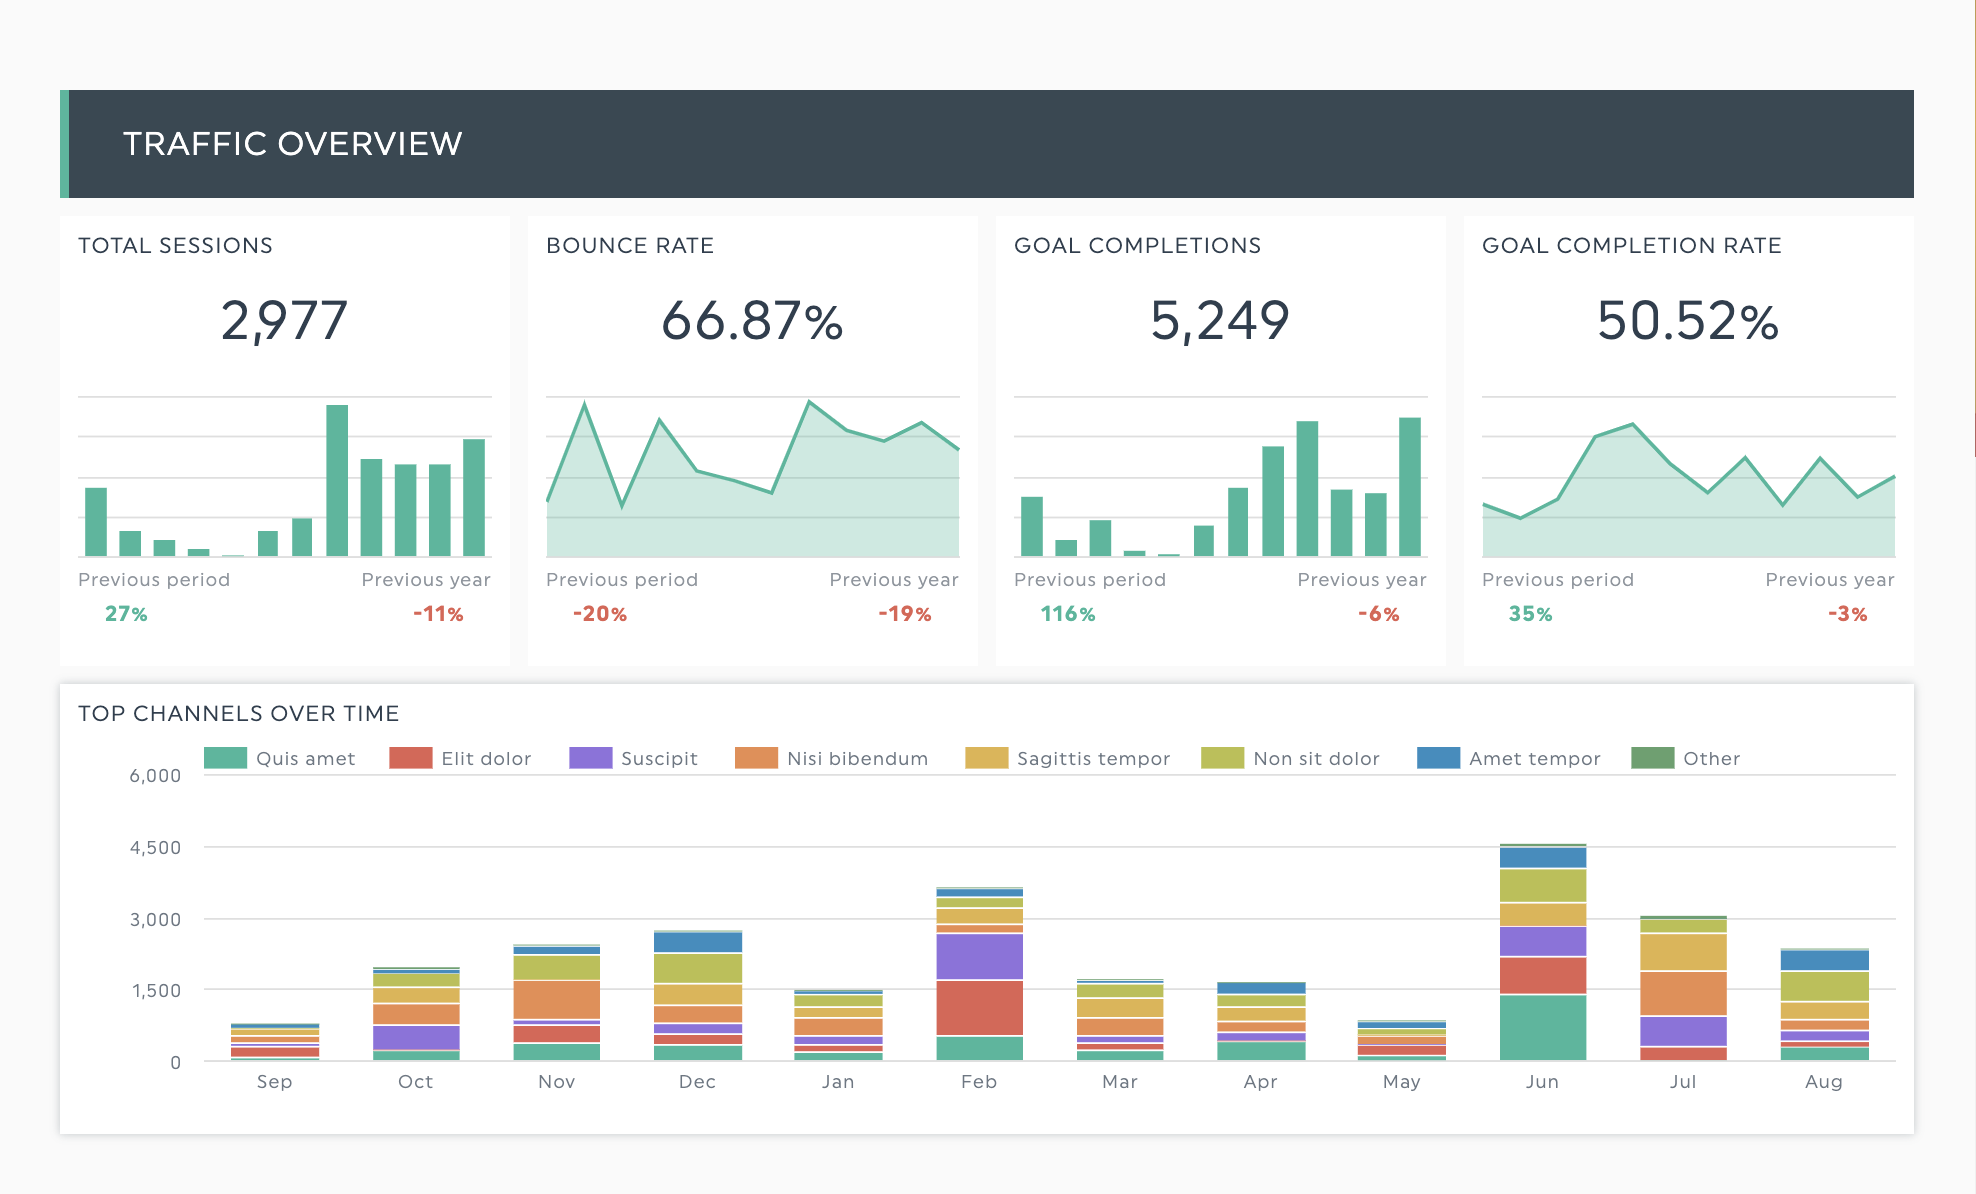
Grab this digital marketing dashboard template with your own data.
You can either use gauge widgets to visualize goals, or add in your targets using the notes and comments feature besides a numerical widget.
A chart aggregates the performance of all marketing channels over time, helping us see which channel is most effective at hitting our goals.
While dashboards help you monitor the performance of each channel
While scorecards track goal progress, dashboards help you drill down into the specifics of each campaign. You can monitor metrics beyond those directly related to your KPIs for more context to ensure your campaigns perform as expected.
Combining the two methods helps you view the day-to-day activities and align your tactical decisions with strategic goals.
In short, it is possible to have the best of both worlds.
How to create a business dashboard with DashThis
Get 20+ dashboard templates just like this one with DashThis. Try it with your own data here.
You can get started in minutes. All you need to do is.
- Sign up for an account with our free 15-day trial
- Connect your marketing tools with our 40+ integrations
- Select the metrics to include from our Preset Widgets
Elevate your measurement game with dashboards and scorecards
Remember, dashboards and scorecards are tools. Feel free to mix and match them for your reporting needs!
Automate your reporting and save hours with DashThis. Try it here.

Ready to track your most important metrics?
Read More

Don’t miss out!
Follow us on social media to stay tuned!
Automate your reports!
Bring all your marketing data into one automated report.
Try dashthis for free