9+ Facebook ads KPIs & metrics to track for success in 2024

With close to 3 billion Facebook accounts, it’s safe to say that Facebook is one of the most popular social media platforms. You've probably dabbled into Facebook advertising if you’re a marketer or a business owner.
What’s incredible about online advertising is how easy it is to get real-time data from your Facebook campaigns. Meta’s Facebook ads manager provides insightful information about the audience, demographics, and important metrics you want to track.
In this guide, we will explore the most important Facebook ads KPIs.
- What are Facebook Ads KPIs
- - Why it's important to measure your Facebook ads results
- Top Facebook ads KPIs to track
- - Engagement metrics
- - Unique Link Clicks
- - Cost per click
- - Click-through rate (CTR)
- - Return on ad spend
- - Cost per lead
- - Conversion rate
- - Ad relevance
- How to create the perfect Facebook ads report
- Make Facebook ads reporting fuss-free
What are Facebook ads KPIs?
Advertising Facebook KPIs are performance measures that allow you to track critical data and ad success with specific data points. They also give you insight into your ad performance and what to do next!
When advertising on Facebook, there are tons of ad metrics you could track, but as we all know, quality is better than quantity. You want to pinpoint the most important Facebook metrics according to the campaign objectives.
For example, adding too many vanity metrics (look spectacular on the surface but don't necessarily translate to any meaningful business results) can make you think your ads are doing much better than they are. You can have tons of impressions on specific ads that result in no conversion, and if your goal is to bring people to your eCommerce website to purchase, you might want to return to the drawing board.
Why is it important to measure your Facebook ads results
To succeed, your ads need to do more than engage people’s attention; they also need to drive desired actions, like a purchase. Having successful Facebook ads can not only drive astounding results while keeping costs low, but it can also build brand awareness. It is a powerful tool for any marketer who wants results fairly quickly, and pairing it with other platforms’ ads or a strong social media marketing strategy can be very lucrative.
Top Facebook ads KPIs to track
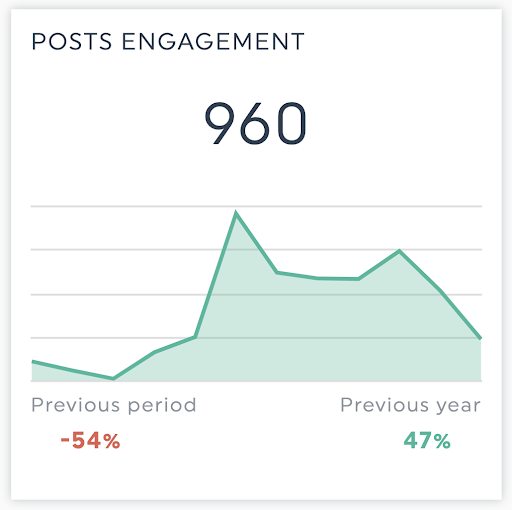
Engagement metrics
Before you analyze user behavior, like clicks and conversions, you want to measure how people interact with your ads. That's why you should be tracking key performance indicators like views, number of impressions, shares, and likes.
Engagement rate is often used to measure a post's success, whether it’s an ad or a Facebook page post in the newsfeed. While these can be vanity metrics, they give good general insights if your ads are attractive to potential clients.
Unique Link Clicks
Link clicks measure the total number of clicks on your ad's link. This metric is a crucial component of the click-through rate and can reveal insights into the success of your call-to-action verbiage. By counting the number of people who click your link, you can understand the type of behavior associated with your page views and the success of your ROI for an ad campaign.
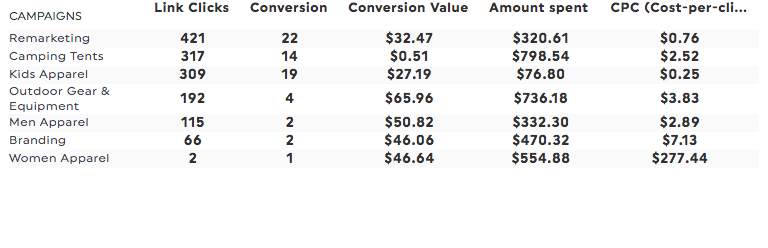
Cost per click
Cost Per Click is a KPI that can be described as the price you pay for each click on your ad. Cost-per-click, or CPC, is calculated by dividing the advertising cost by the number of clicks an advertisement generates. Typically, you track your CPC alongside other click advertising metrics like click-through rate, cost per action (CPA), cost per conversion, and CPM (cost per mile).
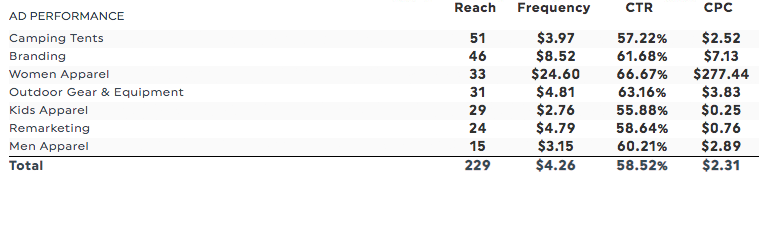
Click-through rate (CTR)
Click-through rate is one of the essential KPIs a marketer will track, especially with ads. Rodney Warner, CEO at Connectivewebdesign.com, said: “The click-through rate is a metric I diligently track when looking at the performance of my Facebook Ads. Of course, other KPIs like conversions and engagement are also important. But the click-through rate helps me see how well a particular Facebook ad performs.
After all, it shows how many people clicked on our ad campaign to visit our website and buy from us. A higher click-through rate signifies the success of our ad. It also results in higher conversion rates, sales, and profits. So, we always aim for a higher CTR - ideally, 5% or more - for maximum results”.
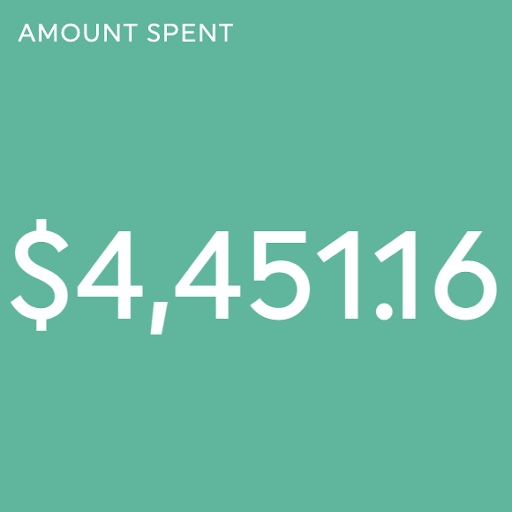
Return on ad spend
ROAS stands for return on ad spend, or return on advertising spend - a digital marketing metric that calculates the amount of money your company gets for each dollar it spends on advertising. To measure the return, you must first analyze the ad spend, which is the total amount you pay for a specific ad.
Although the benchmark varies according to industry, type of business, etc., an average ROAS of 3X or more is generally considered "good" This means that every dollar spent on Facebook advertising generates three in revenue.
Looking at the return on ad spend allows you to measure engagement and concrete investment results.
Cost per lead
“Our favorite metric to track the performance of Facebook ads is cost-per-lead. It is the amount paid when someone fills out a contact form on a company’s website to attain more information. Here is the general formula of CPL:
Cost Per Lead = total cost/number of leads generated.
This metric is used to gauge the effectiveness of any advertisement. For instance, let's say you spent $700 and received two leads from it; your CPL would be $350. Therefore, cost per Lead is a crucial metric for us, as it makes it easier to figure out how much we would need to spend on leads while also showing our projected return on investment.
With CPL, we can see the average number of leads our ads generate and how much each piece of information costs. Using this method, when one ad has a higher price per lead than another, it might be less effective at generating conversions for our company. - Cody C. Jensen is the CEO & Founder of Searchbloom.”
Conversion rate
When you create an ad, you probably have a goal or objective. When speaking about conversion rate, we call them “desired action.” A conversion rate is the number of converted users (people who completed the desired action) compared to the number of clicks on a single post.
What is a good conversion rate? It all depends on your industry; different industries have significantly different benchmarks. The average conversion rate ranges from 3% (apparel, electronics, hobbies) to 8% (automobile, law & government). So, more than 10% is a higher conversion rate than average!
Ad relevance
Ad relevance, formerly known as relevance score, is still a mystery metric because we don’t know exactly how it’s measured. Still, we know it’s based on how users interacted with the ads after 500 impressions. The more relevant your ad is, the more likely they will click through and take the desired action.
Bonus
James Bancroft, Head of PPC at 21 Degrees Digital, believes that “for a more in-depth look into what’s going on beyond CPA and ROAS, we may use any of the metrics within Facebook ads. A few of our favorites are:
- Video view %. If we’re using video ads, this will let us know how engaging the video is and even at what stage we may be losing our target audience’s attention
- Landing page views. While clicks are a long-standing favorite for a lot of Facebook marketers, landing page views give a more accurate view of how many people have made it through to the website to start browsing or buying”
How to create the perfect Facebook ads report
When you’ve selected your key metrics, it’s time to think about how you want to present the data so your boss or client will better understand their investment.
DashThis allows you to plug your Facebook ads account to generate monthly reports. We gather all the data from your Facebook ads account into one piece, allowing you to easily see your Facebook ad campaign results, which tells you how to improve your overall strategy across your marketing channels.
Step 1: Choose one of our preset templates from the Facebook ads dashboard to campaign performance and social media advertising.
Step 2: Connect your favorite marketing tools
Step 3: Select your metrics from DashThis’ preset widgets
Step 4: Drag and drop your desired metrics into your reports!
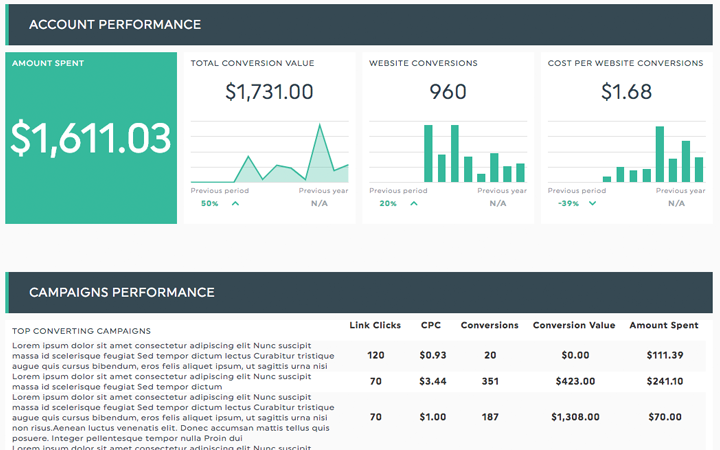
Voila, you are done! Here’s what the final product could look like.
Try this report with your data
Make Facebook ads reporting fuss-free
In a sea of data, you now know which essential KPIs you want to track when measuring the success of your Facebook ads.
Sign up for your free 15-day trial to automate your Facebook ads reporting in a visually-pleasing format.

Ready to automate your reporting?
Read More

Don’t miss out!
Follow us on social media to stay tuned!
Automate your reports!
Bring all your marketing data into one automated report.
Try dashthis for free