Drag and Drop Widgets to your Web Dashboard

Today, let's create drag-and-drop dashboards that grab data from multiple integrations and turn them into a stunning marketing report.
- What are Drag-and-Drop Dashboards?
- Advantages of Drag-and-Drop Dashboards
- - Customizable
- - Simplicity
- - Freedom to Edit Down the Line
- How to Create Drag-and-Drop Dashboards
- Bonus: Dashboard Templates (Make Them Your Own!)
- - SEO Reporting Dashboard
- - Google Analytics Dashboard
- - Social Media Dashboard
- Create Drag-and-Drop Dashboards on DashThis Today
What are Drag-and-Drop Dashboards?
Drag-and-drop dashboards are zero-coding visual reports built to speed up the creation process.
(You might have heard of Loopple, a dashboard builder that helps no-code developers create bootstrap admin panels. It’s built on top of Argon, a free and open-source dashboard that, according to GitHub.com, has over 100 individual components. But that’s not what we’re covering today! Today’s guide shines a light on drag-and-drop dashboards for marketers.)
You can view these interactive dashboards as you build them one widget at a time.
Drag and drop widgets (e.g., pie chart, header, comments) within the editor, and let the dashboard reporting software do the rest.
These drag-and-drop dashboards are indispensable, especially for marketers.
Instead of painstakingly hopping from one channel to another, you can now connect your data source with a click and wait for them to automatically pull data from the relevant channels.
Drag-and-drop platforms like DashThis also boast advanced features—like automatically attaching PDFs within dispatched emails to clients.
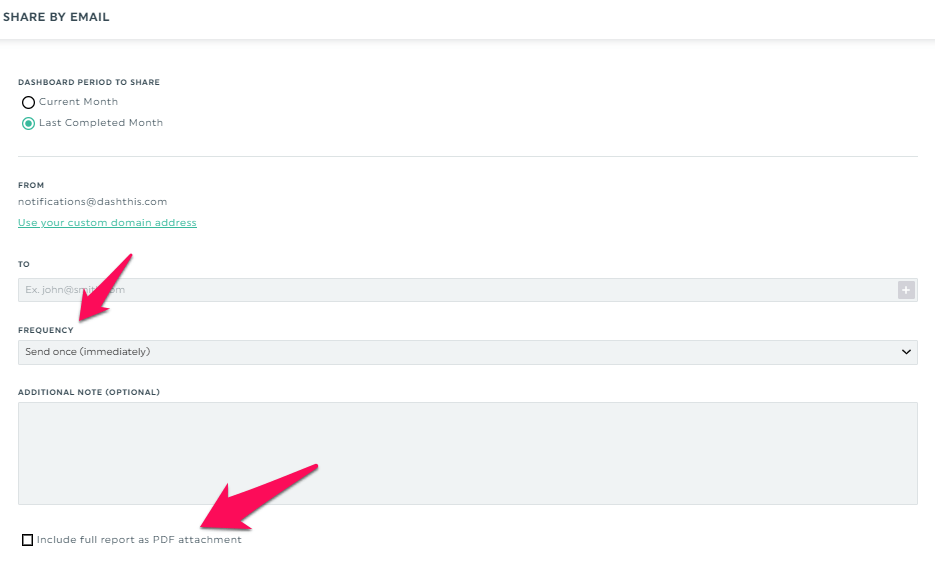
To automate reporting, set your desired frequency and include the full report as a PDF attachment
Start your free 15-day trial of DashThis to schedule your drag-and-drop dashboards today.
Advantages of Drag-and-Drop Dashboards
There’s more to drag-and-drop dashboards. Here are three more reasons you should use them to succeed in your work.
1. Customizable
The days of creating a different KPI report for every integration are long over.
Now you can include data from any combination of integrations in every dashboard.
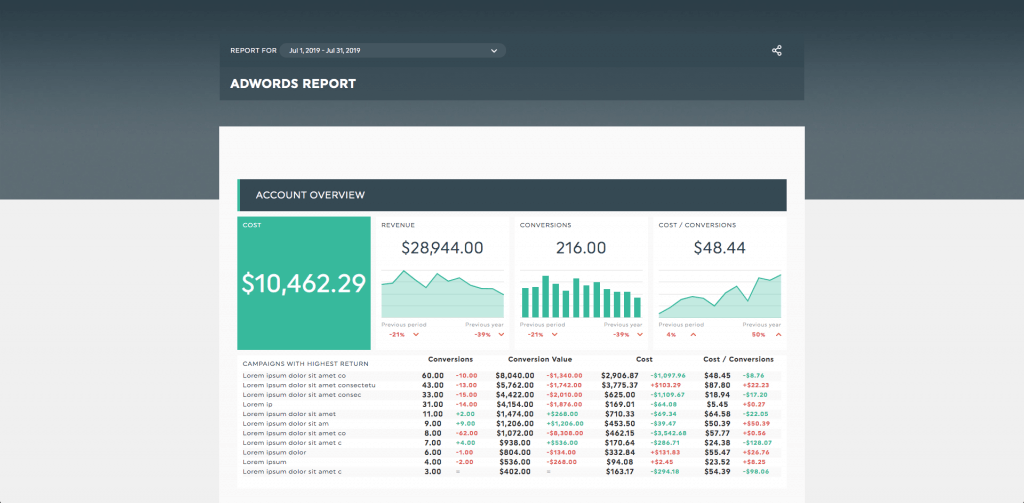
Here’s a multi-channel performance report created from seven different channels.
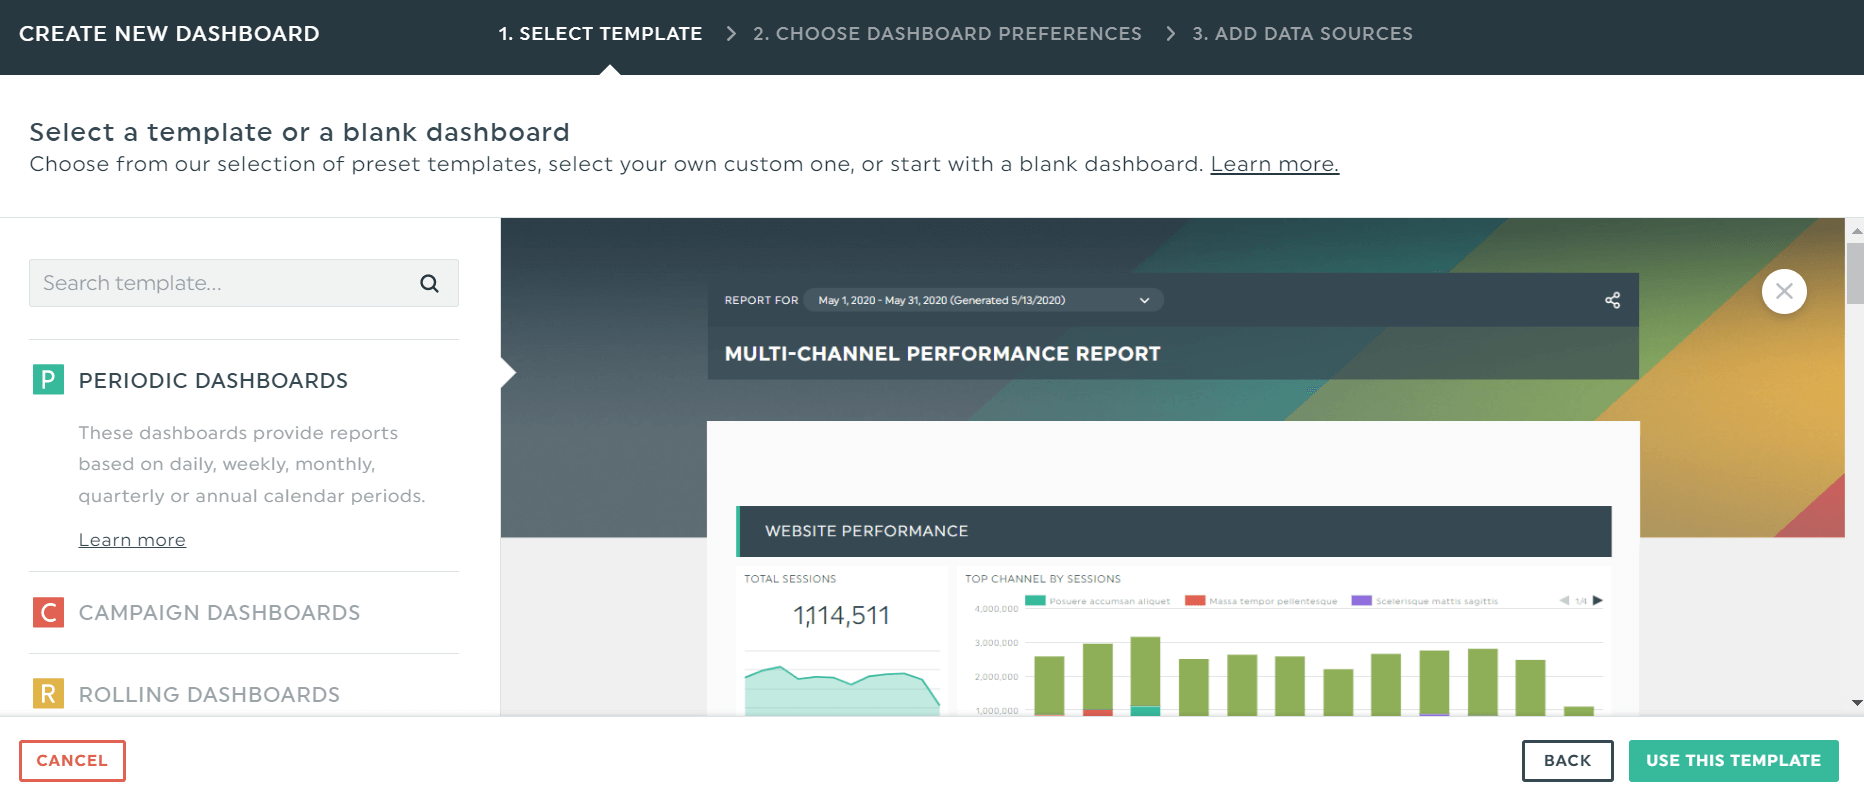
This multi-channel performance report from DashThis combines Google Analytics, Google Ads, Facebook Insights, Facebook Ads, Google My Business, Instagram Insights, and LinkedIn Pages.
An online dashboard builder also customizes the look and feel of your KPIs and other widgets.
For instance, you can turn a pie chart into a stacked bar or change the position of a KPI widget within seconds.
2. Simplicity
Templates simplify dashboard creation as they include all the most commonly used KPIs.
No matter what dashboard layout you’re creating for a client, it’s simple to get started.
In your DashThis account, click Create New Dashboard as a starting point. Choose from 40+ free templates spanning across industries and use cases.
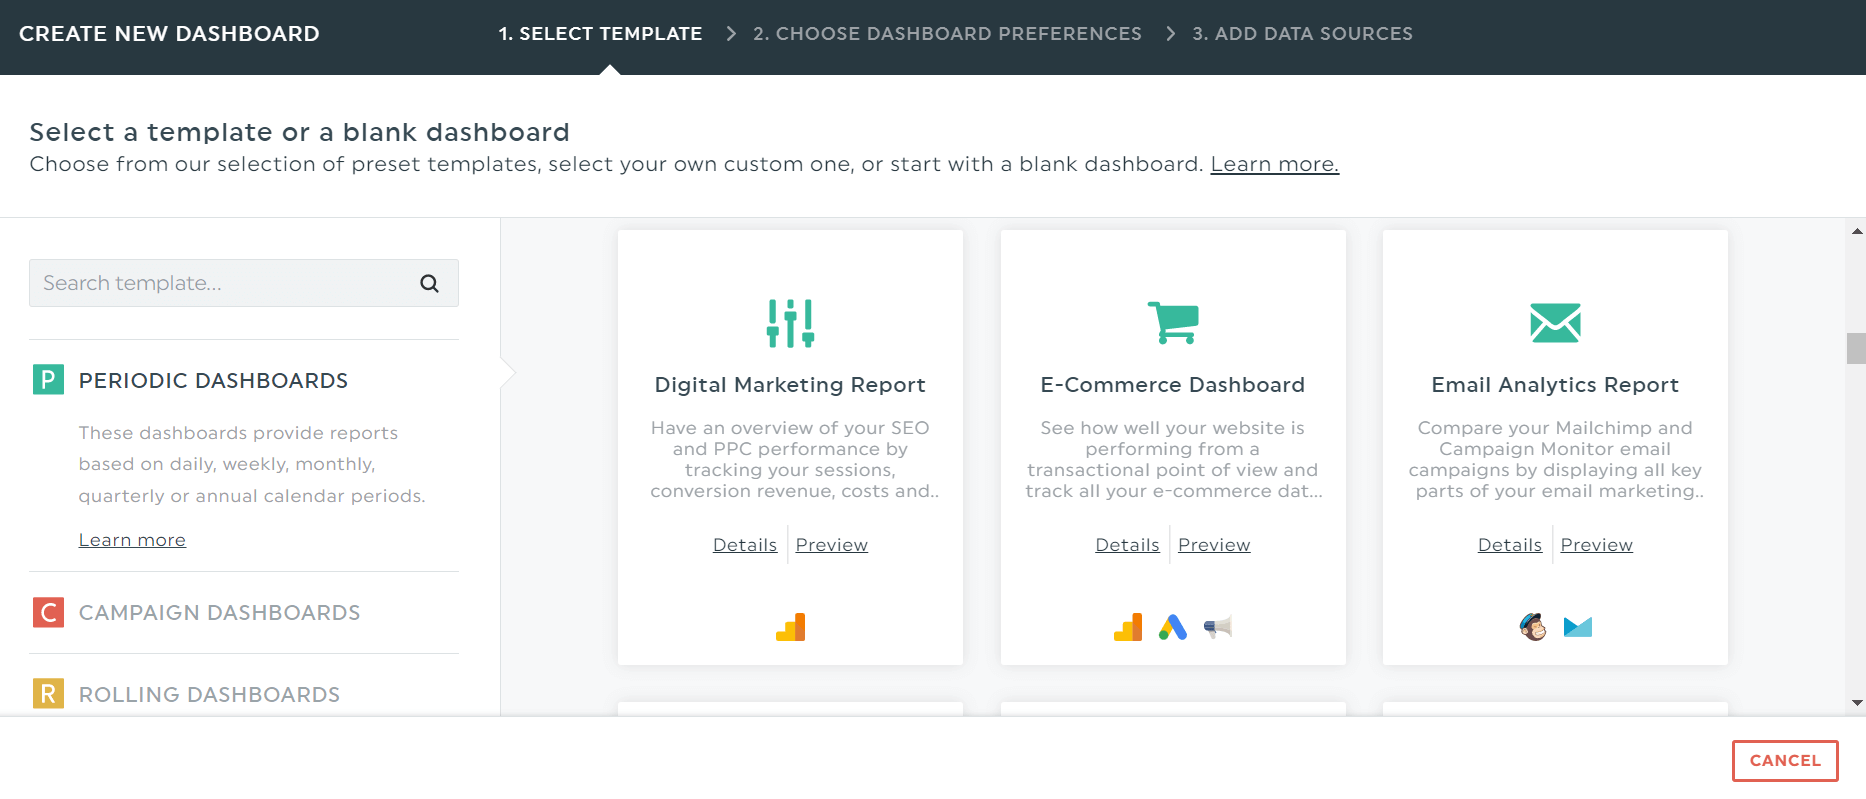
All templates come with pre-made KPIs. Choose Periodic, Campaign, or Rolling to begin. DashThis will provide the relevant dashboards for your specific use case.
Templates also promote consistency across projects.
Ease your workload by reusing your customized template for similar projects in the future.
Click Dashboard Options > Save as Template for a single client OR Dashboard Options > Clone Dashboard to use it across all clients.
3. Freedom to Edit Down the Line
Forgot to add another metric to provide context for an erratic graph?
We had to redo our report and resend it to clients back then.
Fortunately, any edits you make on DashThis will be reflected in the dashboard immediately, thanks to our shareable URL link.
Clients who receive dashboards via a shareable URL link can only access them in incognito view mode. In other words, they won’t be able to see the edit functions!
How to Create Drag-and-Drop Dashboards?
Now that you know the ins and outs of drag-and-drop dashboards, let’s look at how you can create your very own beautiful dashboards using DashThis:
- Connect your favorite data sources from 30+ integrations
- Pick a drag-and-drop dashboard template (or start from scratch)
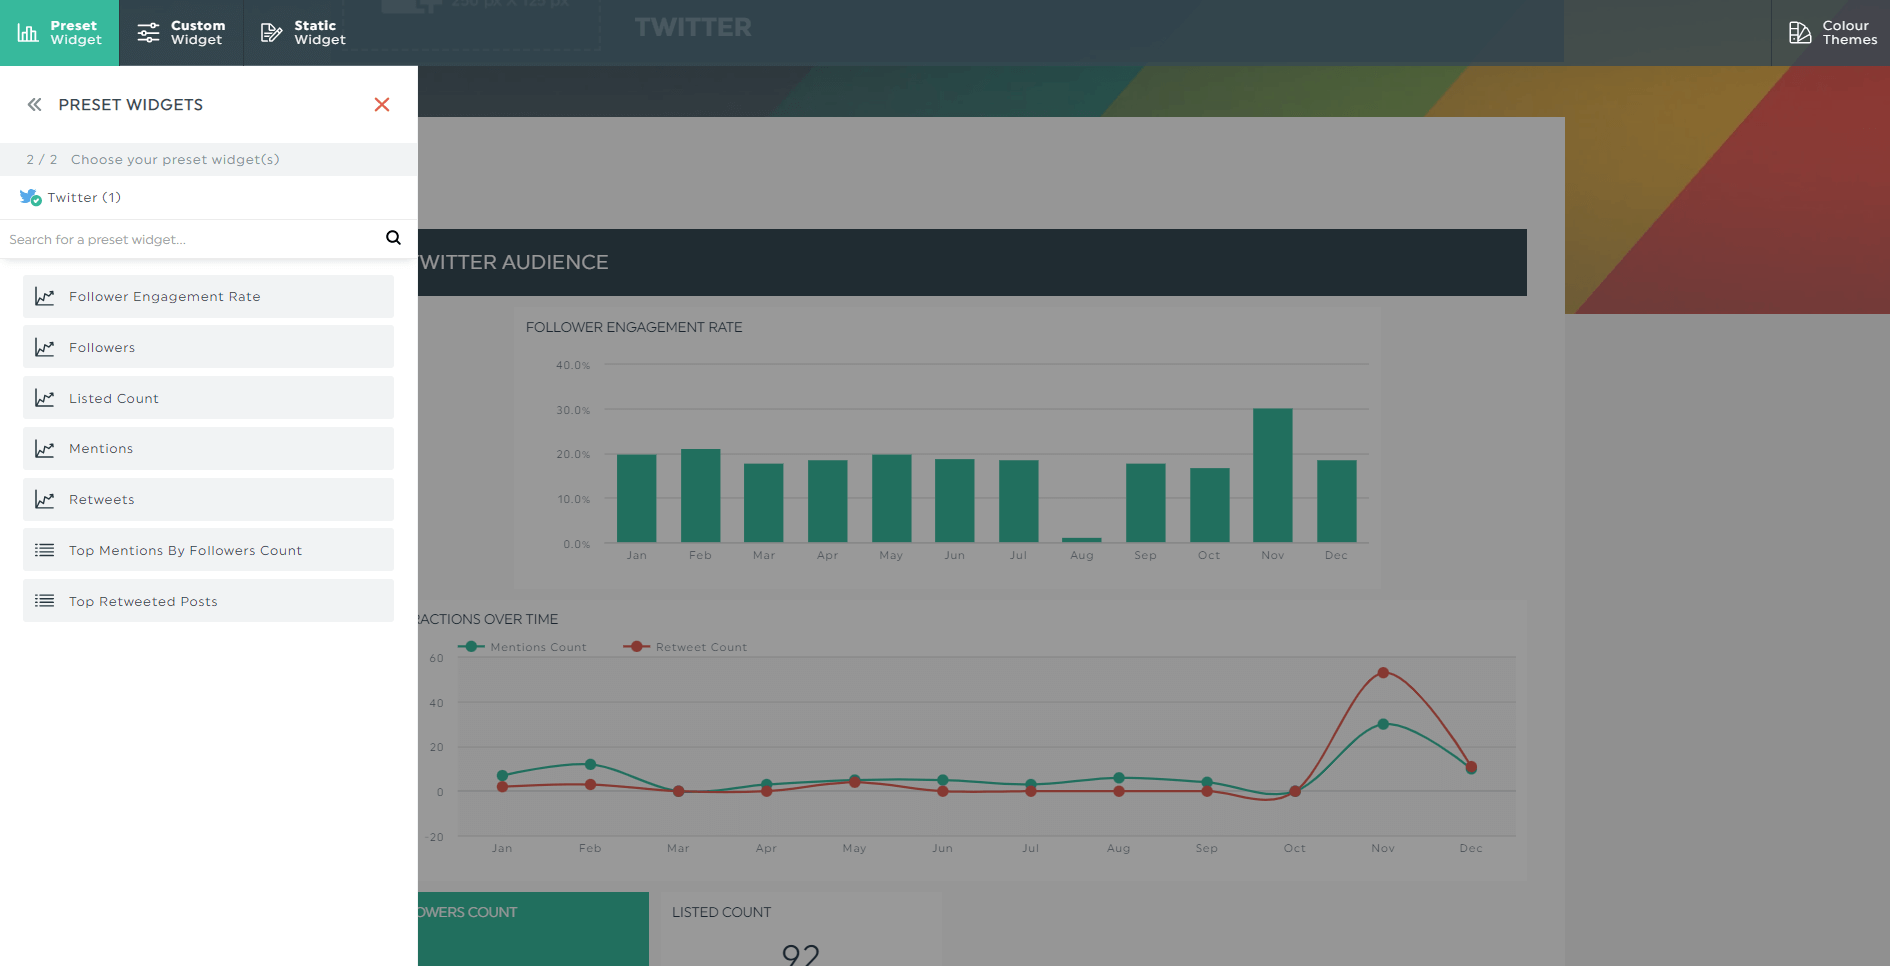
- Select your metrics and KPIs from Preset Widgets
- Drag and drop to customize the dashboard
- Save it as a custom report template for future use and automate it to clients!
Start your free 15-day trial of DashThis to create your drag-and-drop dashboards today.
Bonus: Dashboard Templates (Make Them Your Own!)
SEO Reporting Dashboard
SEO doesn’t have to be a tangled mess of keyword rankings and conversions from organic traffic.
A robust KPI dashboard software can make these analytics easy to follow, even if your client is a complete beginner.
Below, you’ll see an SEO and backlinks report that shows ROI in a single glance.
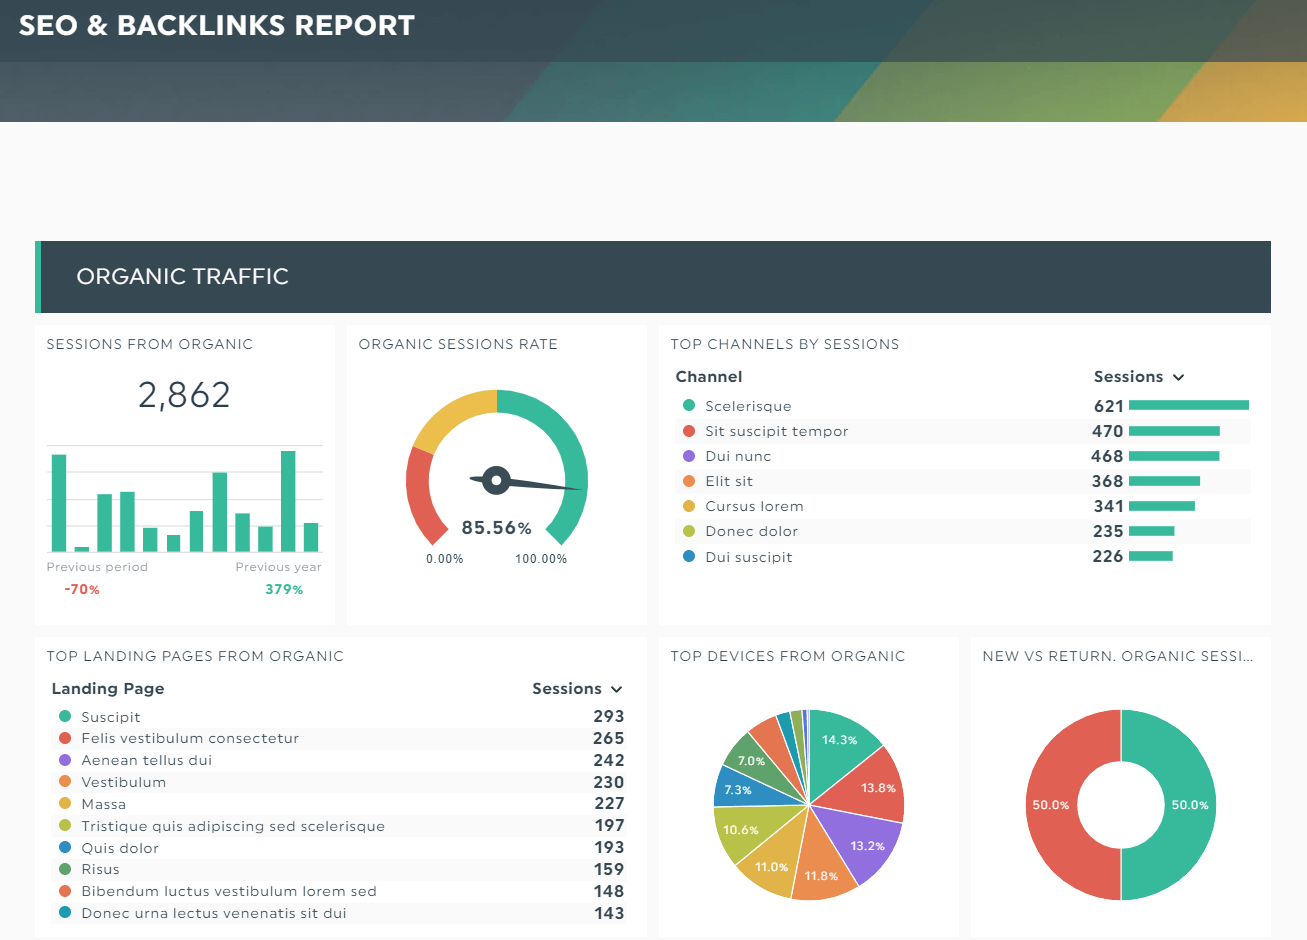
Grab this SEO dashboard with your own data!
Use the SEO reporting dashboard to identify your most profitable keywords and pages, and more.
Google Analytics Dashboard
Google Analytics is a data powerhouse and industry standard for all businesses.
This report, created by a drag-and-drop dashboard generator, displays the site’s traffic overview, transactions, and conversions… down to the average visit value.
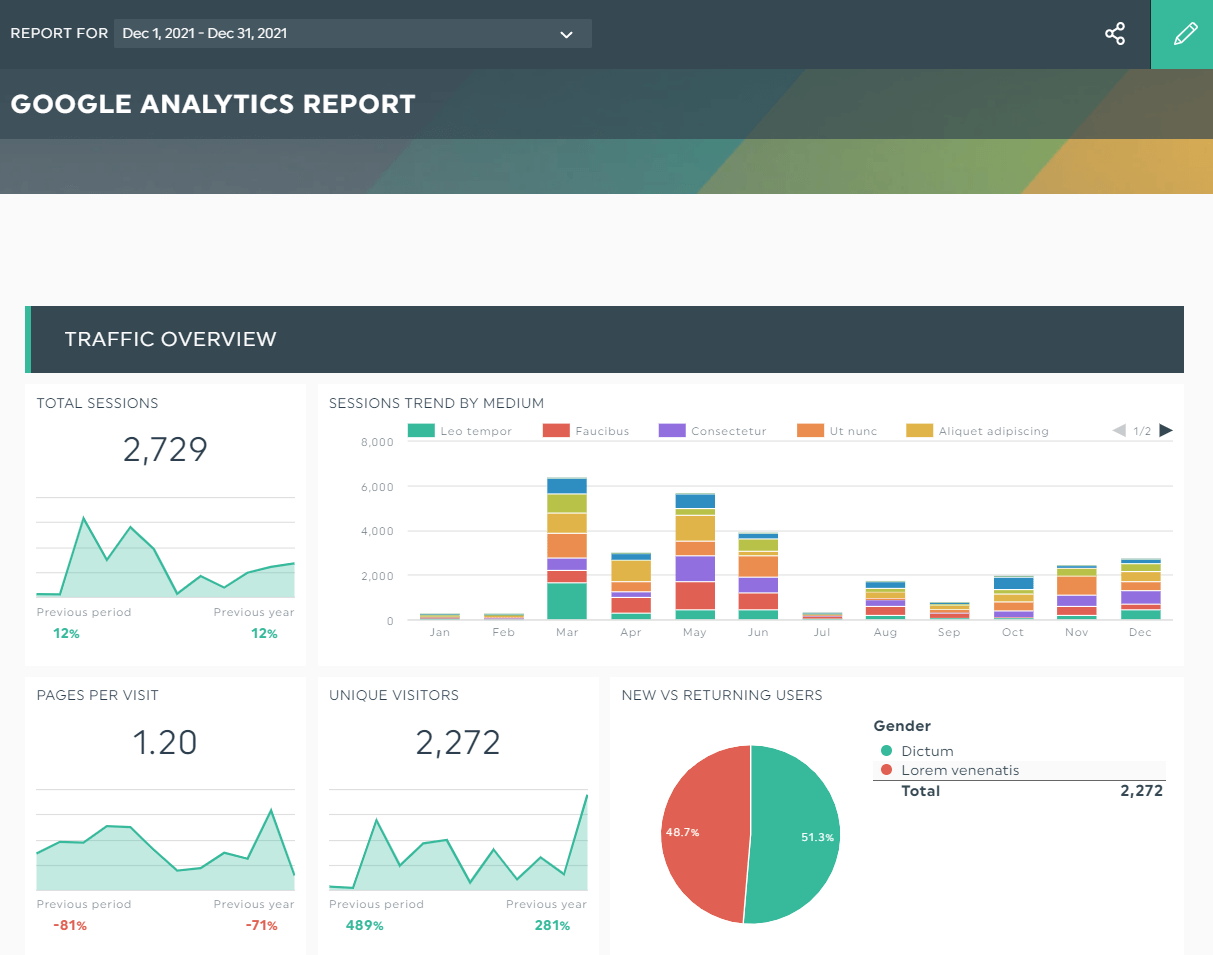
Grab this Google Analytics dashboard with your own data!
Use the Google Analytics dashboard to analyze your demographic, user behavior, and what needs to be done to improve the user experience.
Social Media Dashboard
Social media can be a real time sink.
It’s worse for businesses as this is time better spent on generating actual business results.
Should you focus on Facebook or LinkedIn? This report has all the answers.
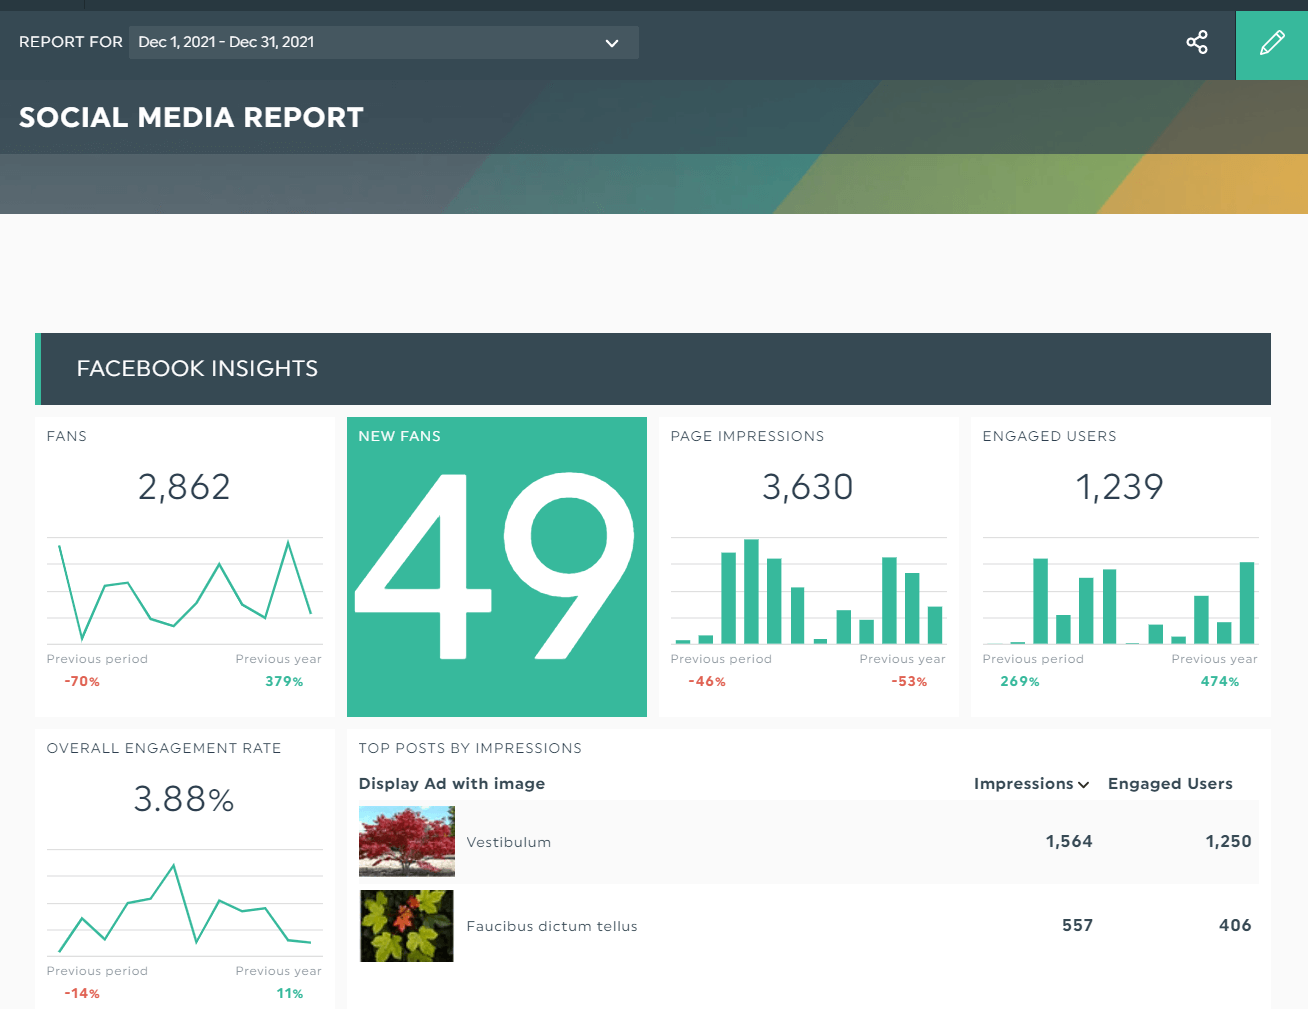
Grab this social media dashboard with your own data!
Use the social media dashboard to dig deeper into your best-performing channels and identify the content that wins hearts and minds.
Create Drag-and-Drop Dashboards on DashThis Today
A drag-and-drop dashboard builder is indispensable in every marketer’s tech stack.
Not only can you customize heaps of data from any combination of integrations in every dashboard AND simplify reporting, but you can also edit them down the line fuss-free without using HTML, CSS, or JavaScript.
Start your free 15-day trial of DashThis to schedule your drag-and-drop dashboards today.

Ready to automate your reporting?
Read More
Don’t miss out!
Follow us on social media to stay tuned!
Automate your reports!
Bring all your marketing data into one automated report.
Try dashthis for free