How to Create a Compelling Facebook Ads Report for Clients: A Beginner’s Guide

Are you often overwhelmed by creating monthly reports or managing Facebook ad data for your clients?
Perhaps it takes ages to get data from Meta’s ad platform into a Google Sheet, or your Google Sheet reports lack enough polish to be something you show to your clients.
There’s a less stressful way forward; we’re here to share it with you!
In this beginner’s guide, you’ll learn the fundamentals of Facebook ad reporting for your clients. Transparent reporting can help you communicate your campaign results and improve your agency’s client servicing skills. Finally, we’ll show you how to save time creating reports with DashThis.
- What is a Facebook Ads report?
- Why should you create Facebook ad reports for your clients?
- Top metrics to use in your Facebook Ads report for clients
- A step-by-step guide to creating a client Facebook ads report with DashThis
- How to effectively present a Facebook Ads report to a client
- Automating your Facebook ads client reporting with DashThis
What is a Facebook Ads report?
A Facebook Ads report is not just a data dump of unrelated metrics. It's a strategic communication tool that helps you organize and present your Facebook ads performance data in a way that's useful for your client.
Suppose your client requested a quarterly Facebook advertising account review in your next meeting. In this case, a report makes performance metrics more understandable (and pleasant to review!). It can even save you time deciding which campaign aspects to optimize.
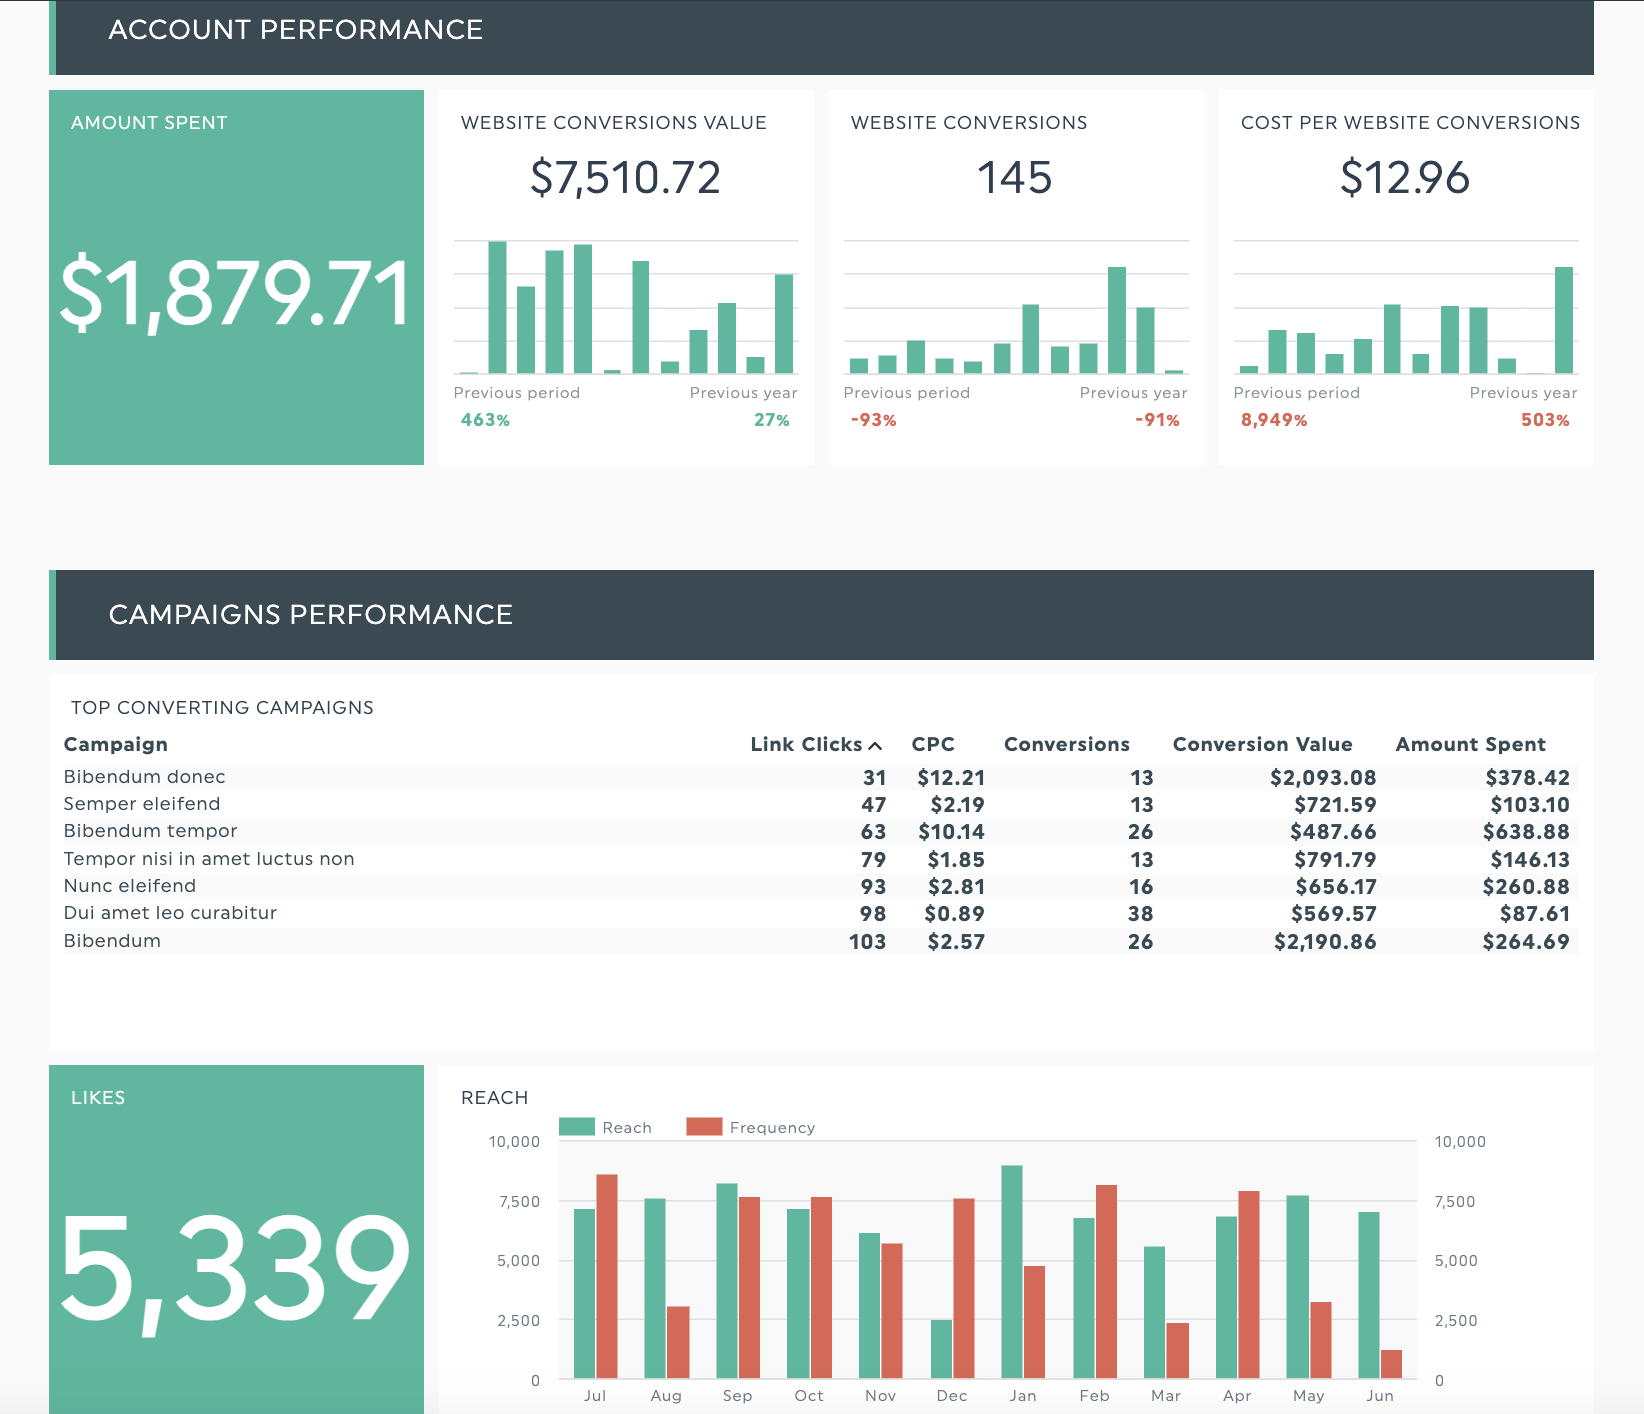
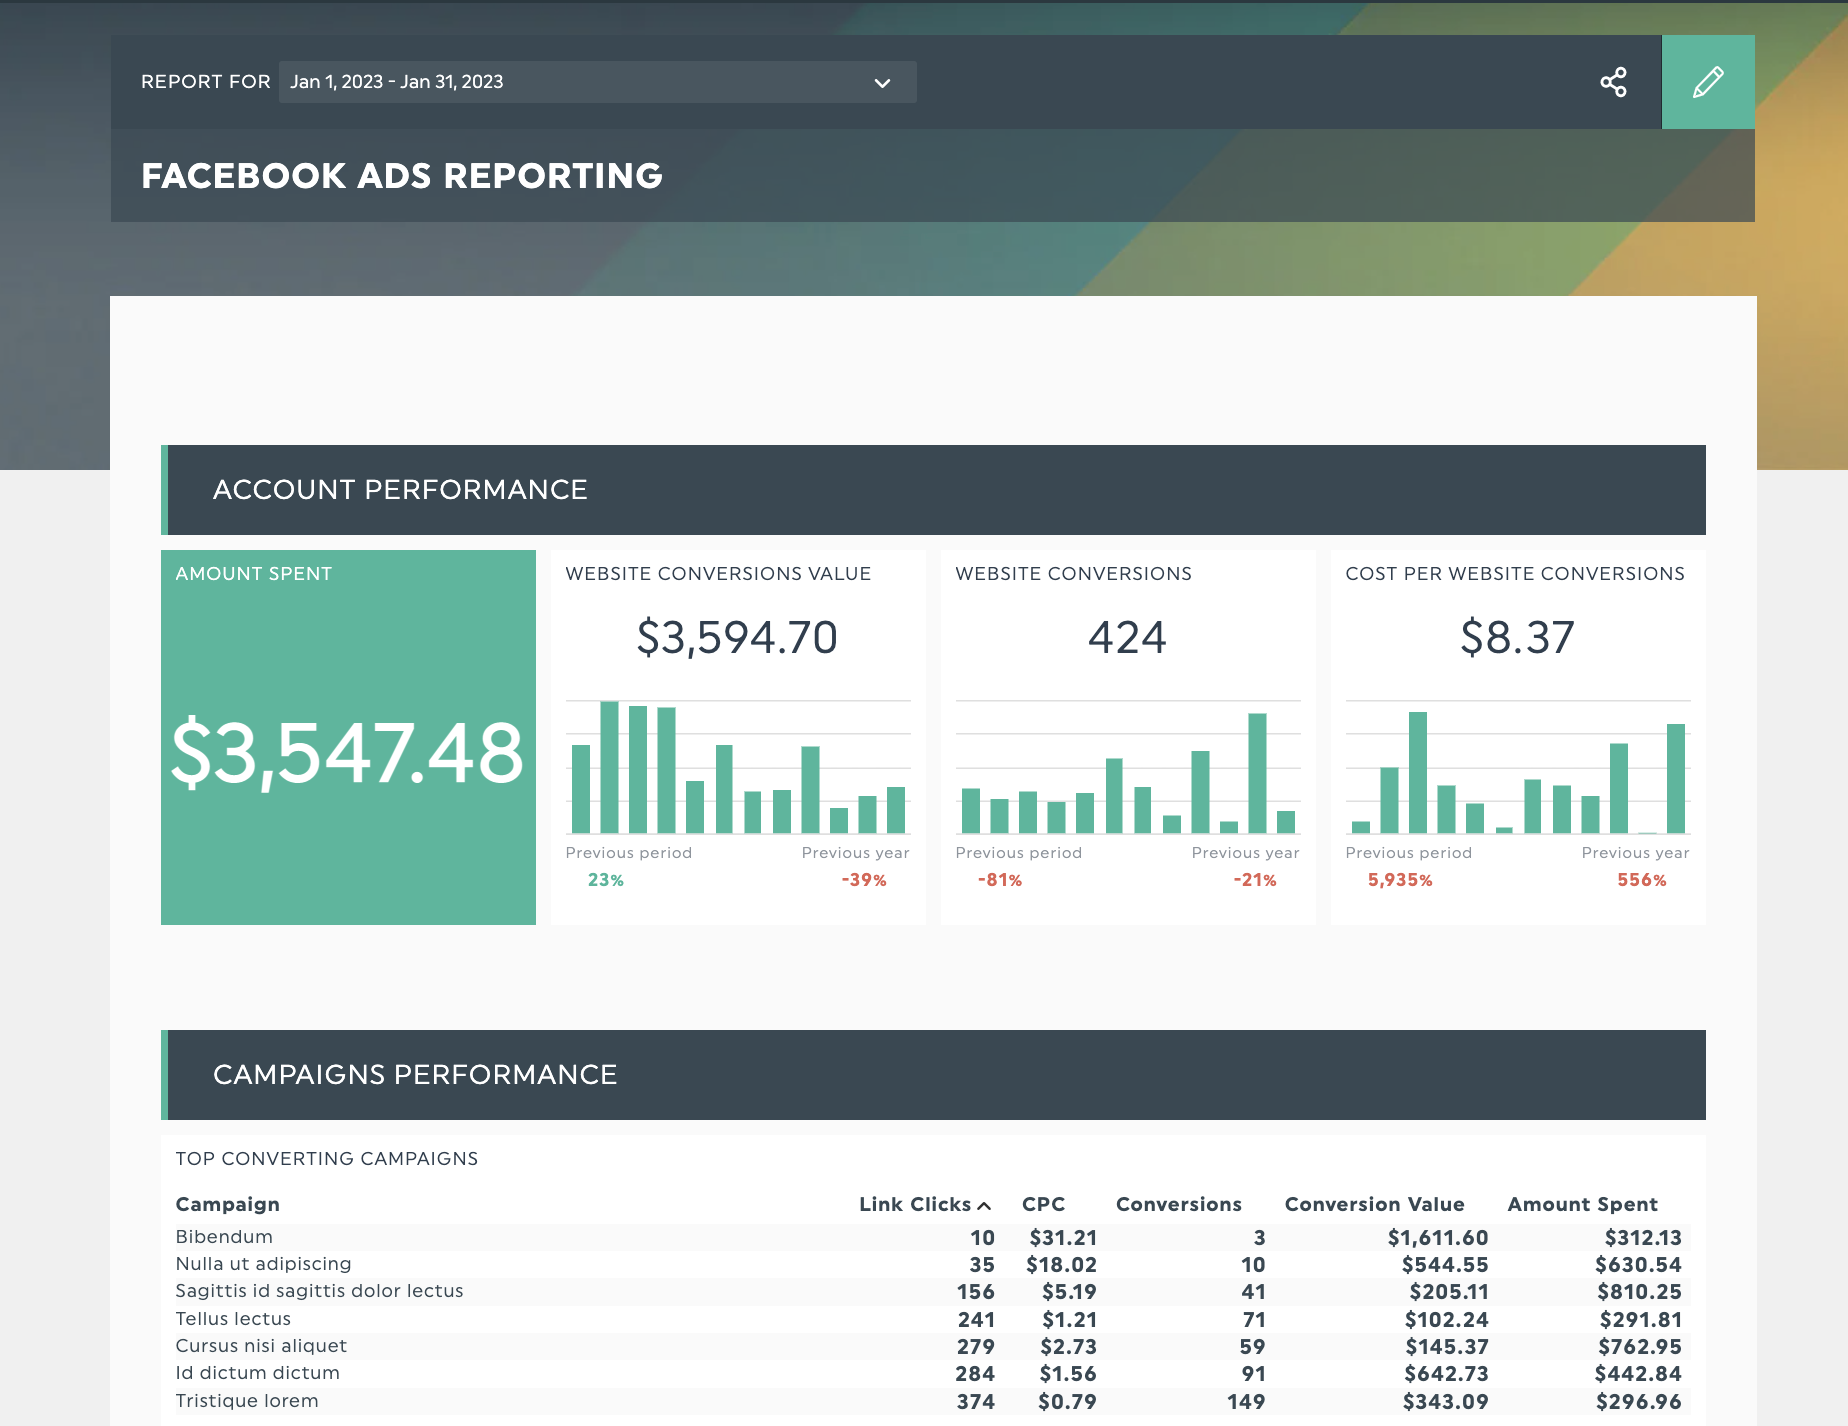
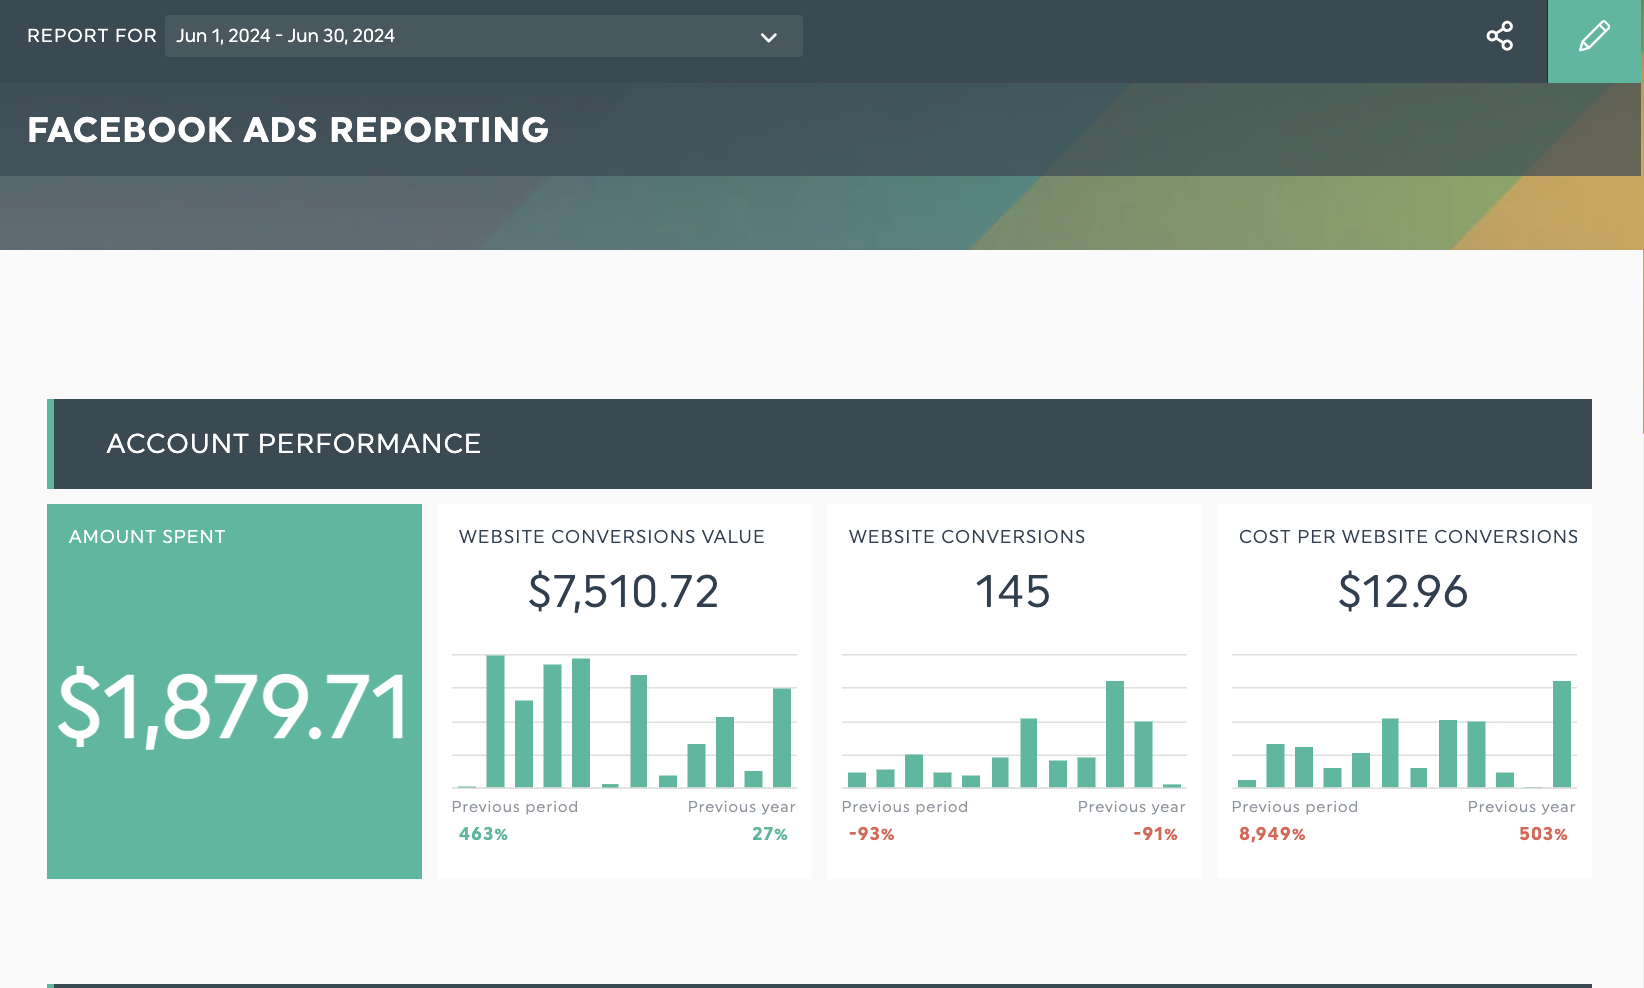
Get this Facebook ads reporting dashboard template with your own data!
For example, DashThis’s Facebook ads reporting template helps you organize your metrics according to different levels of specificity. You could create a custom report for your client to view an overview of their account performance. Subsequent sections can include more specific insights on individual campaigns and ad metrics to understand your marketing efforts fully.
Why should you create Facebook ad reports for your clients?
Clients want agency partners who can deliver results and have the right expertise. But above all, they want to work with agencies that are professional and easy to communicate with. Here are three ways investing in a proper reporting process can help you meet these criteria.
Informs client decision-making
Besides a proper strategy, succeeding at Facebook ads often involves a systematic approach to A/B testing and applying recommended advertising methods. Focusing your tests on a specific KPI and monitoring performance over time makes it easier to tweak your campaign to improve performance and lower advertising costs.
When you have a report to identify your best Facebook ads and monitor campaign performance over time, it’s easier to see the impact of any campaign adjustments or A/B testing on your campaign KPIs.
You could test different headlines and ad creatives to see which ad variant delivers a higher ad click-through rate. Or test different landing page designs and form variants to see which one gets a higher form completion rate. By sharing this information with your clients, you can help them allocate their Meta ads campaign budgets and make informed decisions.
Build trust with clients
The foundation of a successful agency/client relationship is trust. Trust is built when you communicate clearly what you're doing for them. According to a study by marketing agency Borne, one-third of senior marketers regard poor communication as the most significant barrier in their relationship with agencies. Borne’s study also found clients want to work with agencies that feel like true partners, not just service providers.
Besides improving campaign performance, a proper reporting process facilitates client communication and helps you address these needs. Reports help you communicate the work and results you’ve achieved. You’ll be able to have more productive discussions around campaign results when you can communicate what you’re working on and the results achieved.
Upsell clients more effectively
Let’s say you’re running a couple of Facebook ad campaigns, and it’s nearly time to renew the contract with your client. Your client wants to see an overview of your campaign performance to decide whether to renew your contract or increase the scope of your services.
The good news, with a Facebook ads report, you can give your clients the information they need while opening up sales opportunities with data points like:
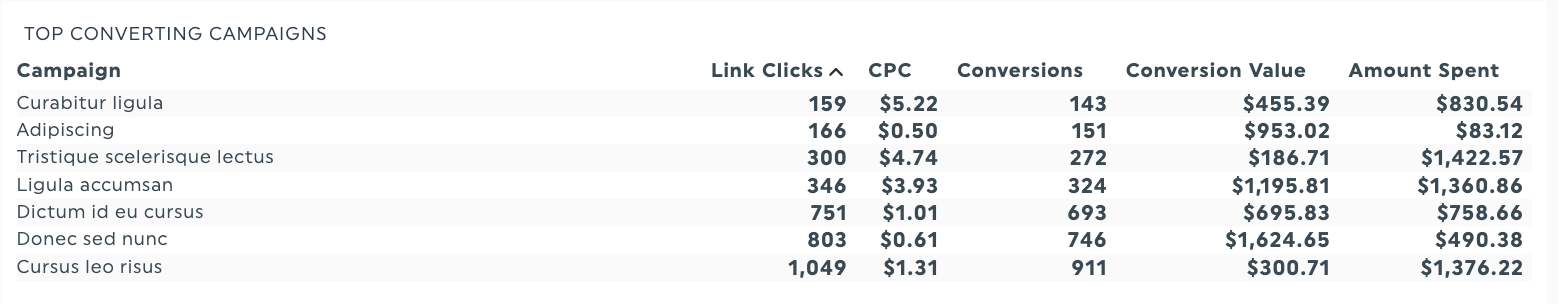
- A list of your top converting campaigns to date
- How much you’ve spent on each campaign
- How much business revenue can be attributed to each campaign.
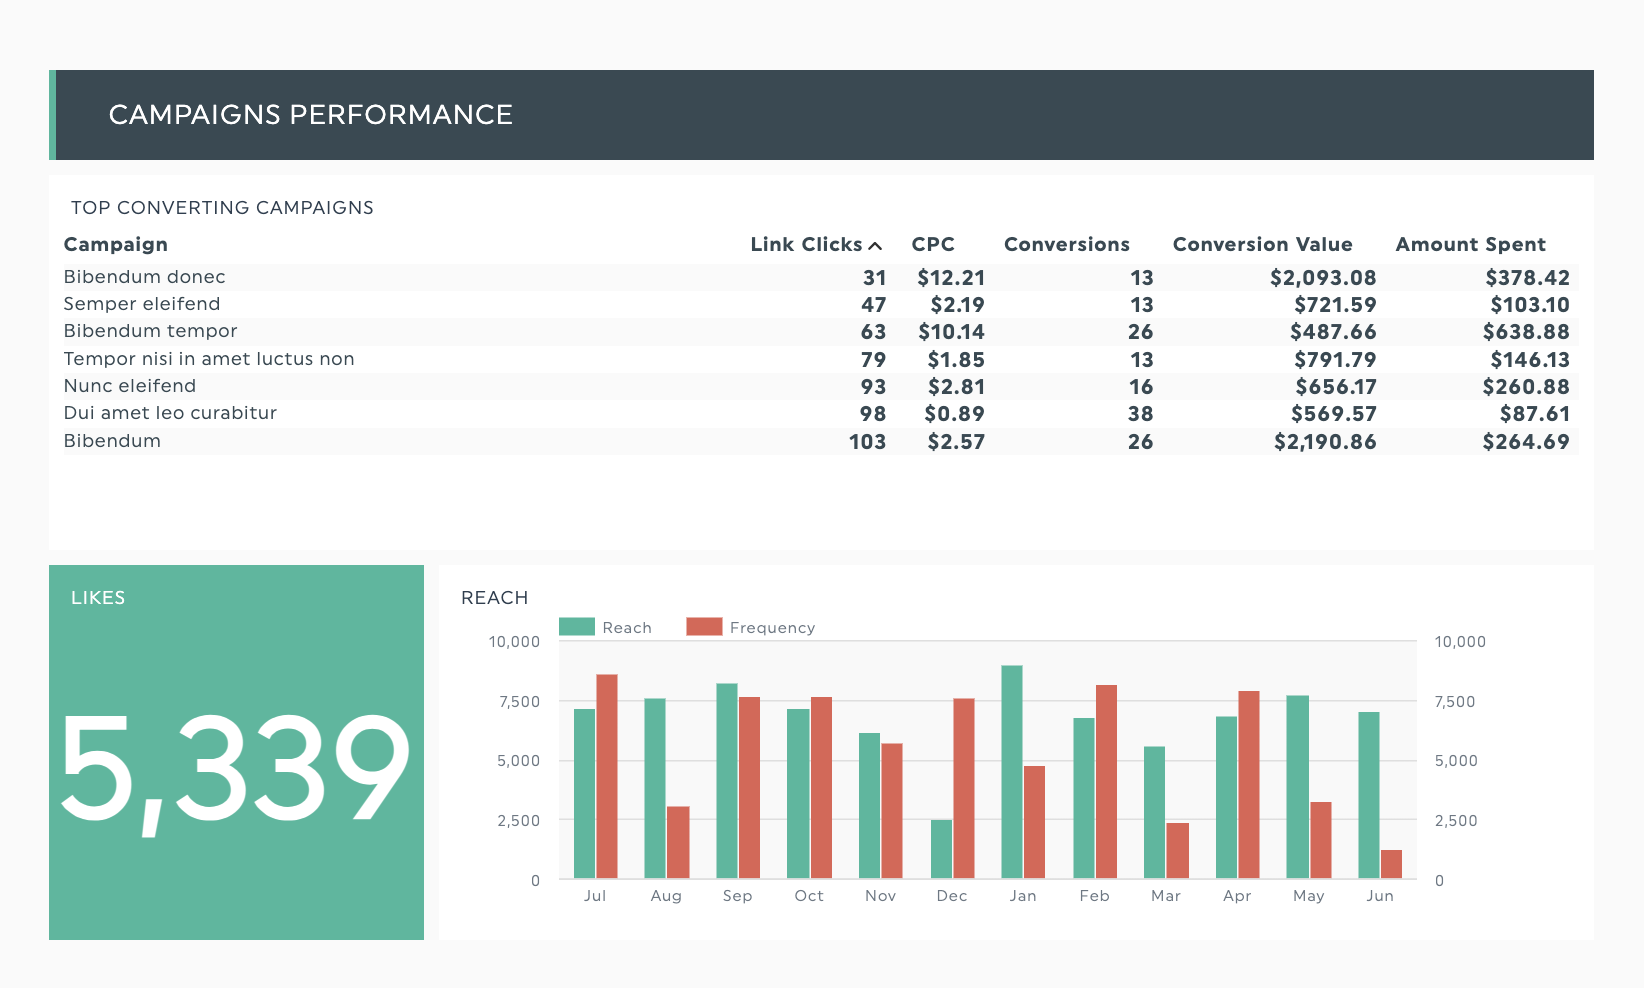
With this data in one place, you can tell your clients which initiatives to invest in, which to pause, and, most importantly, how you can keep adding value to their business.
Top metrics to use in your Facebook Ads report for clients
Facebook’s ad platform features over 300+ metrics, and you need to select carefully which metrics to include. Use this list of important metrics to start.
Ad impressions
Impressions measure the number of times people see your Facebook ads. They’re a great metric for ensuring your audience sees your ads and checks for any ad delivery issues.
Unlike reach, impressions count each time an ad is shown to a person. Let's say one person views your Facebook posts five times - that's counted as one person reached and five impressions.
Ad clicks
A person responding to an ad results in a click, and monitoring your number of ad clicks can show audience interest in your ads.
However, it’s difficult to make strategic decisions based on clicks alone. Pair click measurement with metrics like conversion or click-through rates for a more detailed look at your ad effectiveness. For instance, seeing clicks but no conversions can signal issues with your targeting parameters or the attractiveness of your ad campaign.
Click-through rate (CTR)
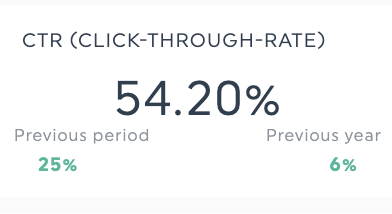
Click-through rate measures how often people click on your ad to go to your landing page, offer, or website. It’s a great measure of ad relevancy or how engaging your ad content is for your target audience.
A high CTR indicates your ads are capturing your audience’s attention, while a low CTR might signal issues with ad relevance or the keyword intent you’re targeting.
Click-through rate formula: CTR = (Link clicks / Impressions) 100
Conversion rate
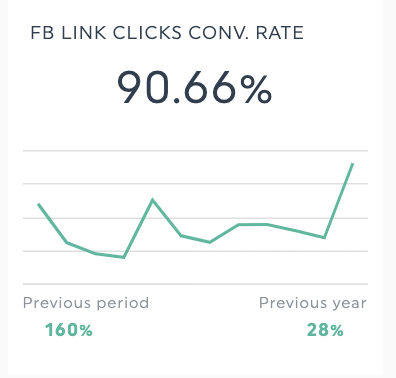
Conversion rate is a direct measure of how effective your marketing is at turning more of your existing visitors into customers or clients. It’s one of the top measures of any Facebook ad campaign focused on lead generation or sales. So, keep this metric in your client reports.
Cost per click (CPC) and cost per mile (CPM)
These cost efficiency metrics are handy when answering questions related to marketing spending. Specifically, PPC metrics like CPC measure the average cost of your Facebook ad campaigns, while CPM monitors the cost of 1,000 ad impressions.
Cost per conversion
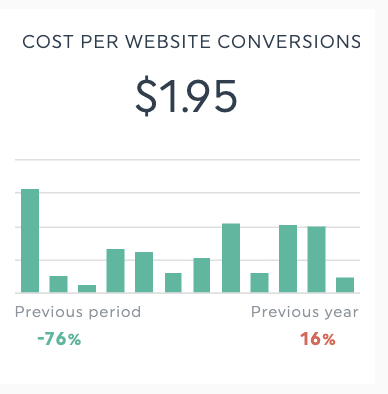
Another metric used to calculate Facebook ad spend is cost per conversion, which calculates how much you spend when people take a desired action, such as submitting a form, buying a product, or downloading a content offer. Track this metric to ensure your paid Facebook campaigns remain profitable.
Cost per conversion formula: Total campaign cost/number of conversions.
Return on ad spend (ROAS)
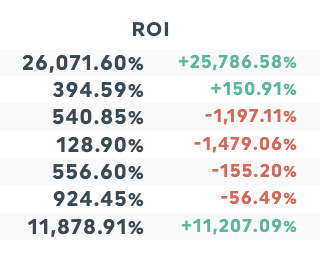
Are you getting the returns you need to justify spending on Facebook ads? ROAS refers to the revenue earned for every dollar spent on a campaign. It’s a solid metric to add when presenting to executives who want to know how cost-effective your campaigns are.
A step-by-step guide to creating a client Facebook ads report with DashThis
If you’re starting your reporting journey, Meta’s ad platform includes all you need to report on Facebook ad campaigns.
However, if you’re reporting on more marketing channels beyond Facebook ads reporting, need to save time on reporting for multiple clients, or just want better-looking reports, it’s worth investing in an automated reporting solution.
Whether it’s putting together detailed Facebook ad reports or getting an overview of your marketing channels, DashThis’s got you covered. Here’s a step-by-step guide on using DashThis to simplify your marketing reporting.
Step 1: Consider the client’s needs
Who is going to be reviewing your Facebook performance report?
Based on what you know about your client and the people reviewing the report, think of questions they might ask about your Facebook ad campaign report. Then, tailor the dashboard’s metrics and overall structure to their needs.
A head of sales, for example, should see a breakdown of how Facebook ad activity contributes to sales opportunities, customer lifetime value, and revenue growth. At the same time, a digital marketing manager focusing on lead generation might be interested in how Facebook ads compare with other lead generation channels like Google Ads, social media channels, or search engine optimization (SEO).
If it’s the latter, you’ll want to compare different paid ad KPIs across various channels to address their questions.
DashThis integrates with 34+ integrations to get a complete view of your client’s marketing performance in one meaningful dashboard. Your clients can see progress without having to read through a wordy report or dig through numbers, creating a better overall client and reporting experience.
Step 3: Select a report template or start from scratch
Start with one of DashThis’s dashboard templates, or use our Facebook ads report template to create a new dashboard from scratch.
Step 4: Connect your client’s Facebook Ads account as a data source
Add the data sources you’re reporting using the Connect button.
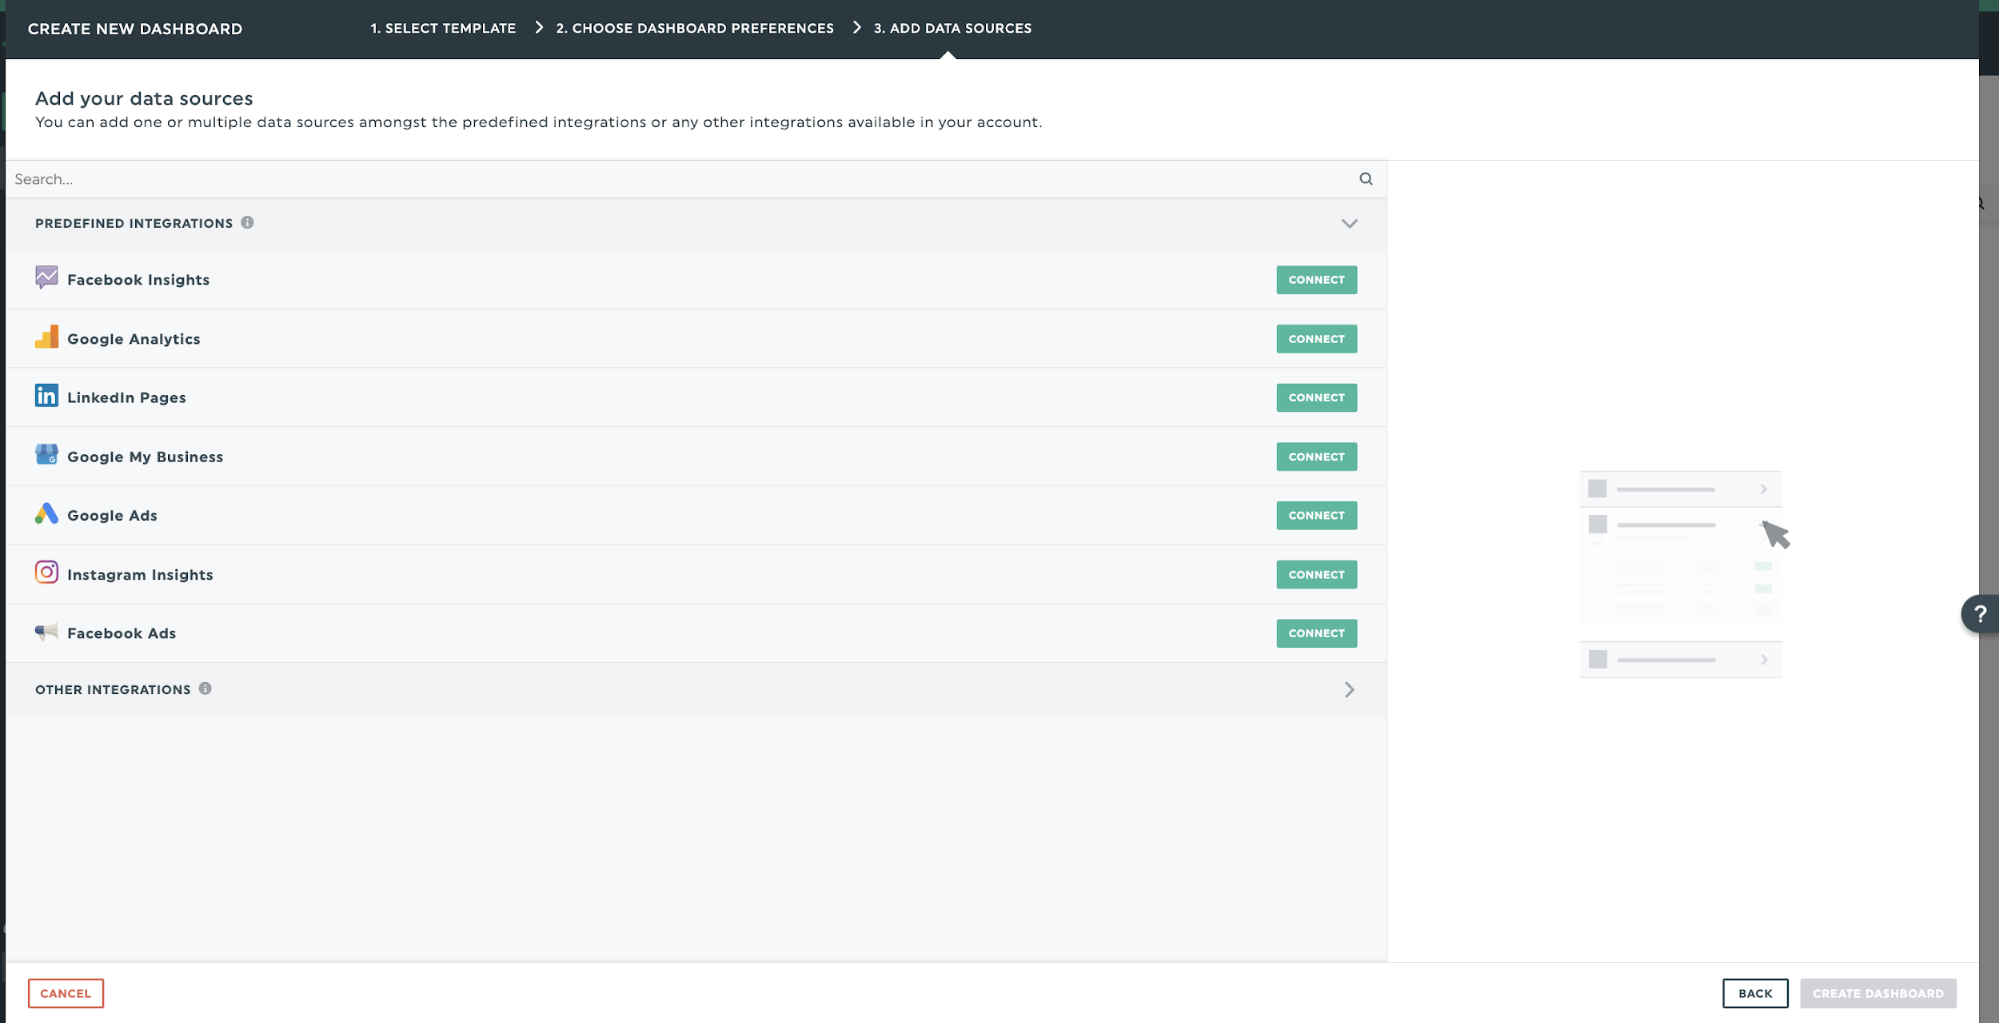
As soon as you permit DashThis to access your marketing data in each tool, DashThis will automatically import your latest data from your selected channels and keep your reports current.
Step 5: Edit the report to your client’s liking
DashThis’s drag-and-drop interface makes choosing the metrics you’re reporting on easy. Use headers and sections to organize your KPIs into a logical, easy-to-follow flow for your client or stakeholder to review, or adjust your report structure to highlight specific metrics relevant to your client’s campaign goals.
DashThis has a few helpful functions and widgets to help you organize your report and make your report look polished, such as:
- Preset widgets: These are metrics that come with your connected data sources. They're great if you want to easily access the common KPIs relevant to a client Facebook ad report.
- Custom widget: As the name suggests, these widgets allow you to create your own widget type to visualize data. For example, you could visualize your audience demographic data breakdown using a pie graph.
- Static widgets: These contain tools to help you organize your Facebook ad client reports, such as headers and comment boxes. You can add editable numbers or embed a CSV file for easy reference.
- White-label reports: Customize your report with your agency’s branding. Share your new Facebook ads report with your own customizable sub-domain to give your clients a seamless reporting experience.
Step 6: Automate the report delivery
Simple things like sending reports on time can make an excellent impression on your clients. DashThis’s reporting scheduling tools can help you keep up with your reporting schedule with minimal extra effort.
Click Sharing Options > Share by Email > Frequency to schedule your reports.
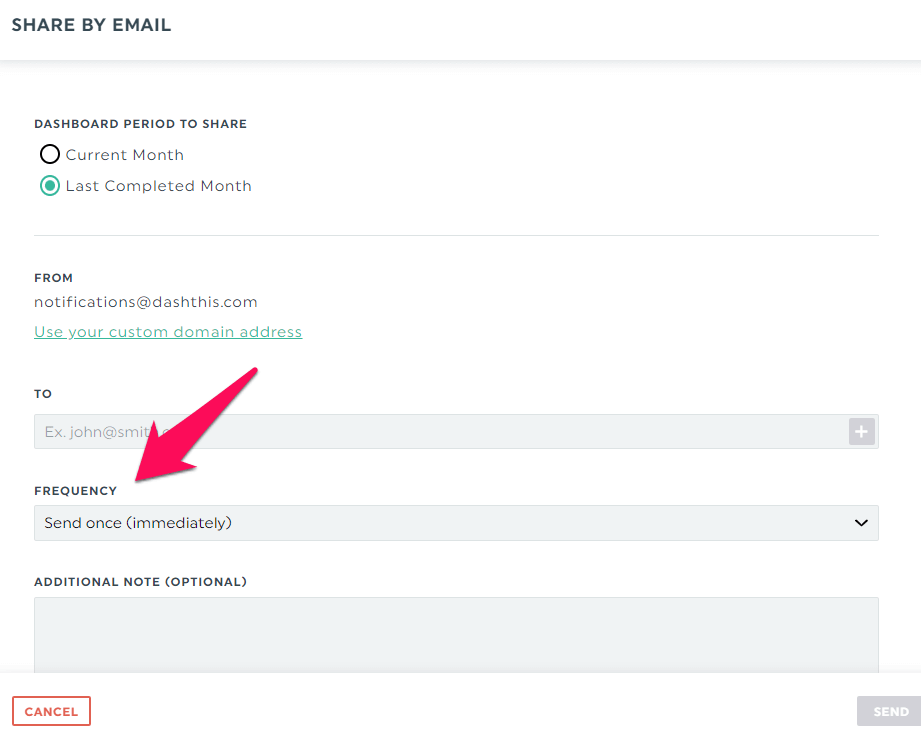
This automatic email dispatch feature lets you set it once, daily, weekly, monthly, or quarterly. DashThis will automatically schedule reports according to your chosen time frame. No need to worry about missed or late reports again!
Alternatively, download your report as a PDF or share a specific URL link so clients can view it online in real time—perfect if you’re preparing for an in-person or video conferencing meeting to discuss your client’s latest marketing campaigns. Clients can also click on the URL to see your data, review your comments, and hover over specific data points for more detail.
How to effectively present a Facebook Ads report to a client
Besides putting together a great-looking report, think of what your clients want to get out of your report and structure your report accordingly. Apply these tips to ensure clients get value from your report.
Relate metrics to client goals
Remember the 300+ metrics in the Facebook ad manager?
Your client likely doesn’t want a full report on every aspect of their campaign. It's worth reminding yourself what your client's goals are with Facebook ads and focusing on reporting metrics that relate to these goals
For example, if you’re using Facebook ads to help drive sales for your client’s e-commerce business, you’ll want to report on goal metrics such as:
- Monthly sales
- Total revenue
- Total Facebook ad spend
- Checkouts initiated from Facebook ads
These goal metrics vary depending on your campaign objectives, so keep your report focused on the metrics that directly affect your client’s campaign objectives.
Summarize key findings upfront
Remember, clients are busy and want to know the most crucial information relevant to their needs.
Think of it this way. If a person were to read the summary of your report, would they have the information they need to make a decision?
When designing your report, put the most critical metrics upfront. For example, if your client's goal from Facebook ads is to drive business revenue while keeping costs down, put these metrics upfront. You can add a comment box or annotation to add context or more information.
For example, information like this can help add context to the data and proactively address any questions clients might have:
- Historical data on how ad costs have varied over time
- Explaining the external circumstances like changes in market demand or Meta’s policy changes that may influence a change in a metric
- Initiatives you’re currently working on
Offer actionable insights
Remember, reports are here to help your client answer three questions:
- What happened in our Facebook ad campaigns this month?
- Why did it happen?
- What should we do next?
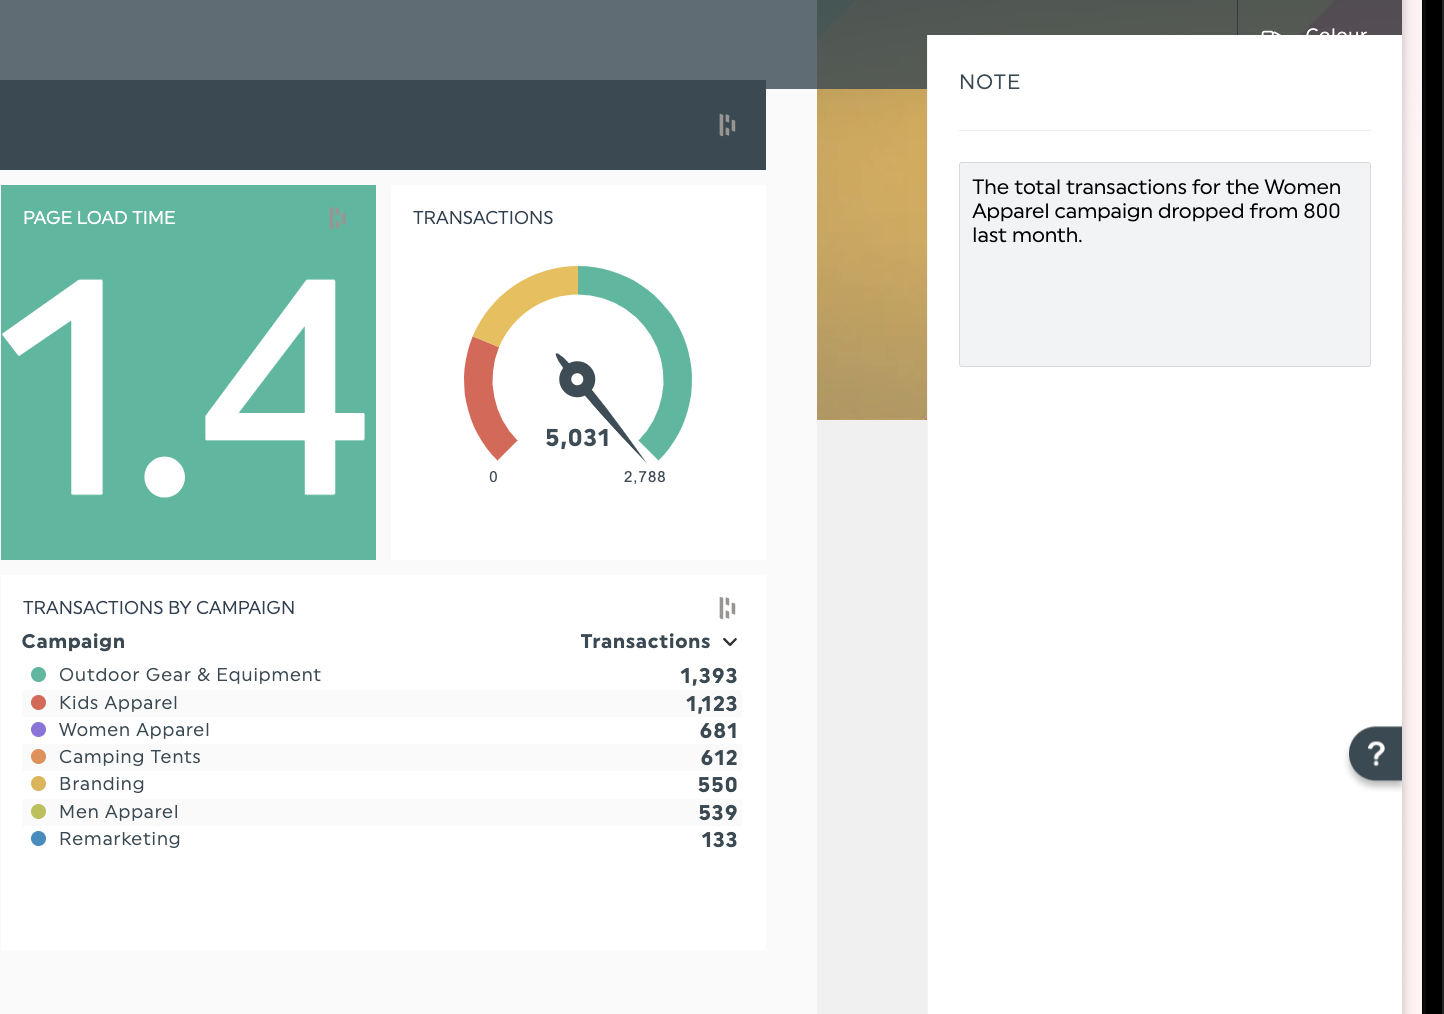
Likewise, dashboard features like annotations and comments can help you provide comprehensive answers to these questions.
Let’s say you’ve noticed a drop in total transactions from a specific Facebook campaign this month. You could add a note with a detailed explanation in your report to the widget to help reassure your client and list out the steps you’re taking to improve the sales figures next month.
Ask for client feedback
Once you’ve created your report, allow your client to share feedback on the reporting format. Consider asking questions like:
- Do the chosen key metrics give the information they need to make decisions?
- Do the selected colors, data visualization types, and report structure make the report easier to understand?
- Can you improve your report to make it more beneficial to their stakeholders or team members?
Doing so allows your team to create reports uniquely catered to your client’s business needs.
These reporting sessions are a precious opportunity to proactively communicate with your clients while showing you are receptive to feedback. So, it’s worth taking time to ask (and act!) for their feedback. Either include these questions in a customer survey or ask them after they’ve had a chance to review your report.
Automating your Facebook ads client reporting with DashThis
Creating an engaging report for your client takes practice, but it’s worth investing the time to get a solid reporting process going.
A solid automated reporting process helps you save time on reporting while showing your clients that you’re responsive and transparent with your results. These are all good things when you want to deliver better Facebook ad results and solidify your client relationships.
Save time on reporting today. Sign up for your free 15-day trial of DashThis today.

Ready to track your Facebook ads metrics?
Read More

Don’t miss out!
Follow us on social media to stay tuned!
Automate your reports!
Bring all your marketing data into one automated report.
Try dashthis for free