Google Analytics 4 Glossary for Marketers: 16+ GA4 Metrics Explained

Since July 2023, Google Analytics 4 has been the default analytics tool for many websites. It’s also introduced many new terms and replaced older definitions, which can be confusing.
And if you’re here, you’re probably looking for information on a GA4 term.
To help you out, we’ve created this Google Analytics 4 glossary to help you clarify key terms and their importance in client reporting. You’ll also learn how DashThis can simplify the GA4 reporting process and visualize your GA4 metrics in one neat dashboard.
Why track GA4 metrics for your clients?
Tracking Google Analytics 4 metrics without understanding their significance can make making the right decisions for your clients more challenging. Here, we make the case why understanding these insights before tracking them matters.
Make data-driven decisions to optimize marketing strategies
Making marketing decisions without data is like throwing darts at a board blindfolded. It’s risky and challenging, especially if you don’t know which actions benefit your client’s campaigns.
Track GA4 data to answer your client's questions about their marketing performance. To answer a client's question about whether it’s worth investing in Google search, track the percentage of organic search traffic compared to competitors and referral or direct traffic sources. You can even set up custom metrics in GA4 to track specific metrics like customer lifetime value relevant to your client’s business.
Optimize marketing budget allocation
A GDS report shows that 56% of sales and marketing budgets will be allocated to digital activities in 2024. While that sounds like a significant percentage, the report also shows that this digital marketing budget includes multiple online channels, including email, content, digital events, and search engine optimization (SEO).
Which channel gets more budget and why? To adapt to these trends, marketers need to adopt a strategic approach to budget allocation by tracking channel performance and allocating budgets to the best channels for their business.
Show marketing ROI and value to stakeholders
Surveys reveal that CMOs are under growing pressure to demonstrate the value of their marketing efforts. Specifically, 59% feel this pressure from CEOs, while 45% feel it from CFOs.
As a result, your clients will probably be looking for concrete, measurable outcomes from their campaigns to report to their stakeholders. Clearly connect your marketing campaigns to tangible business results and quantifiable outcomes to meet this need.
Top GA4 metrics and KPIs
We've explored the benefits of tracking data, so let's explore top GA4 metrics and their marketing definitions. These will help explain marketing data to clients and guide campaign decisions.
Acquisition metrics
These metrics help you measure how well your website or mobile app attracts new traffic and users. Use these acquisition reports to compare the effectiveness of individual marketing channels.
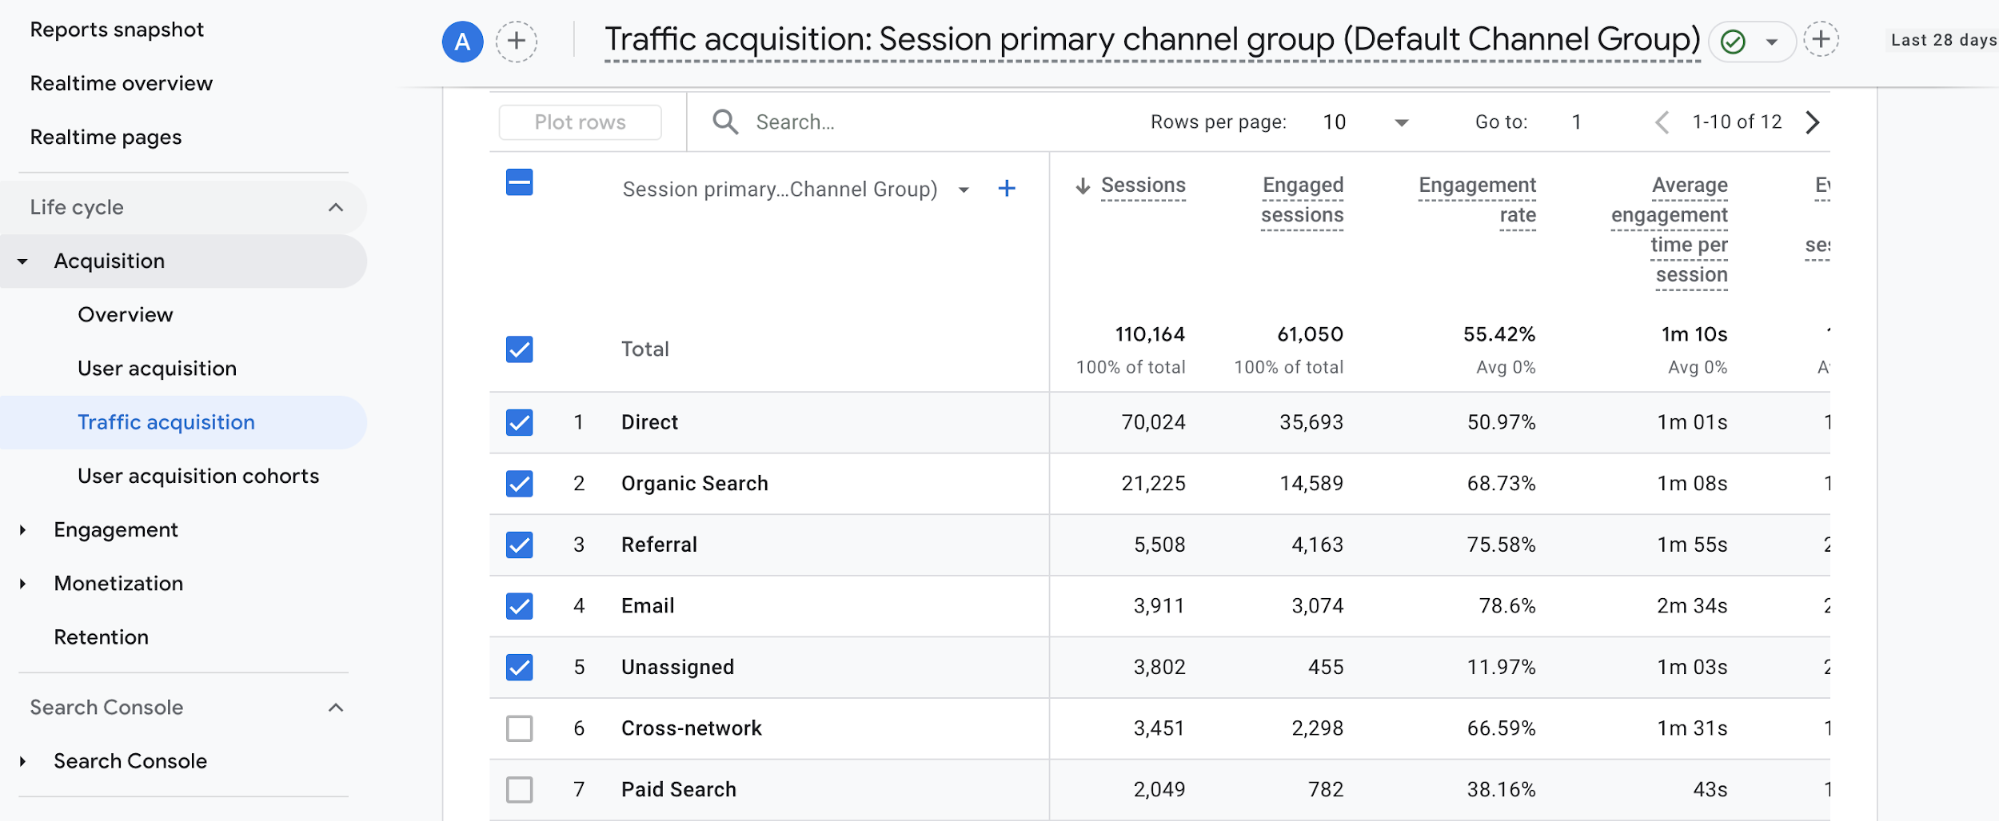
Sessions
Sessions in GA4 are a period of interaction on your website or app. These start when a user opens your app or website in the foreground or views a page or screen. You can track the number of new sessions in GA4 to learn more about:
- How often people interact with your site
- The effectiveness of your traffic acquisition campaigns. Break down this number by top sources and channels to identify which channels or campaigns drive the most traffic to your website or app.
How to track sessions in GA4
- Click on Reports in the left-hand menu.
- Go to Acquisition > Traffic Acquisition. In GA4’s default channel group, you'll see a breakdown of the number of sessions by individual channels in these acquisition reports.
New/total/returning users
New to GA4, these acquisition metrics show how users interact with your website and app. Although these three metrics seem similar, be aware of their subtle differences.
Total users track the total number of unique users who have interacted with your site or app over a specified period. This helps you understand your total audience size and provides a starting point for analyzing traffic trends.
New users show the number of people who interact with your website or app for the first time. This metric helps you see how well your marketing efforts attract new visitors.
Returning users measure the number of unique users who have previously interacted with your site or app and return within a specific timeframe. This metric helps you track user retention and loyalty.
How to track total/new/active users in GA4
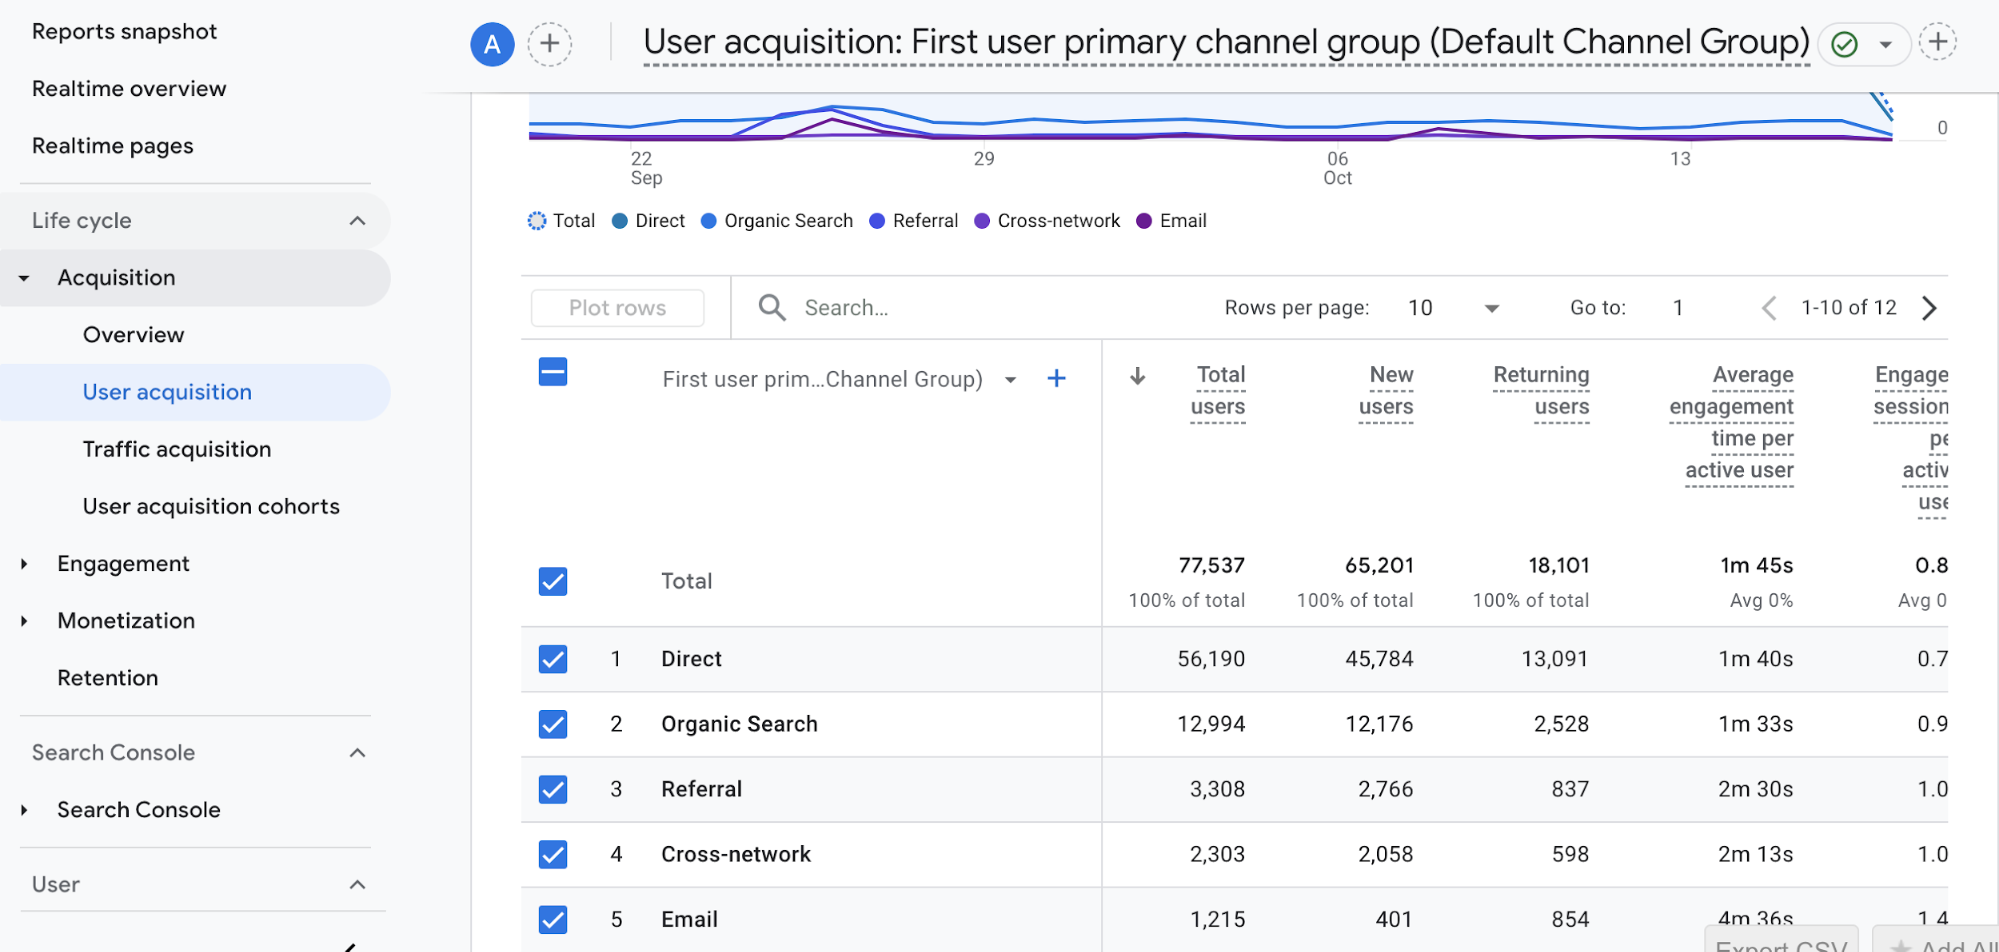
- Go to the Reports section in GA4 on the left-hand menu.
- Click on Acquisition and then select User Acquisition.
Engagement metrics
GA4 introduces several new engagement metrics, such as event count, average engagement time, and engaged sessions. These metrics focus on how users interact with your website content. Use these metrics to guide SEO, user experience improvements, or website layout decisions.
Event count
Event count refers to the number of times a specific user interaction triggers on your website or app, such as:
- Button clicks
- Video plays
- Conversion actions like form submissions or add-to-carts
You can identify which features or website content users interact with by tracking how often event triggers occur.
How to track event count in GA4
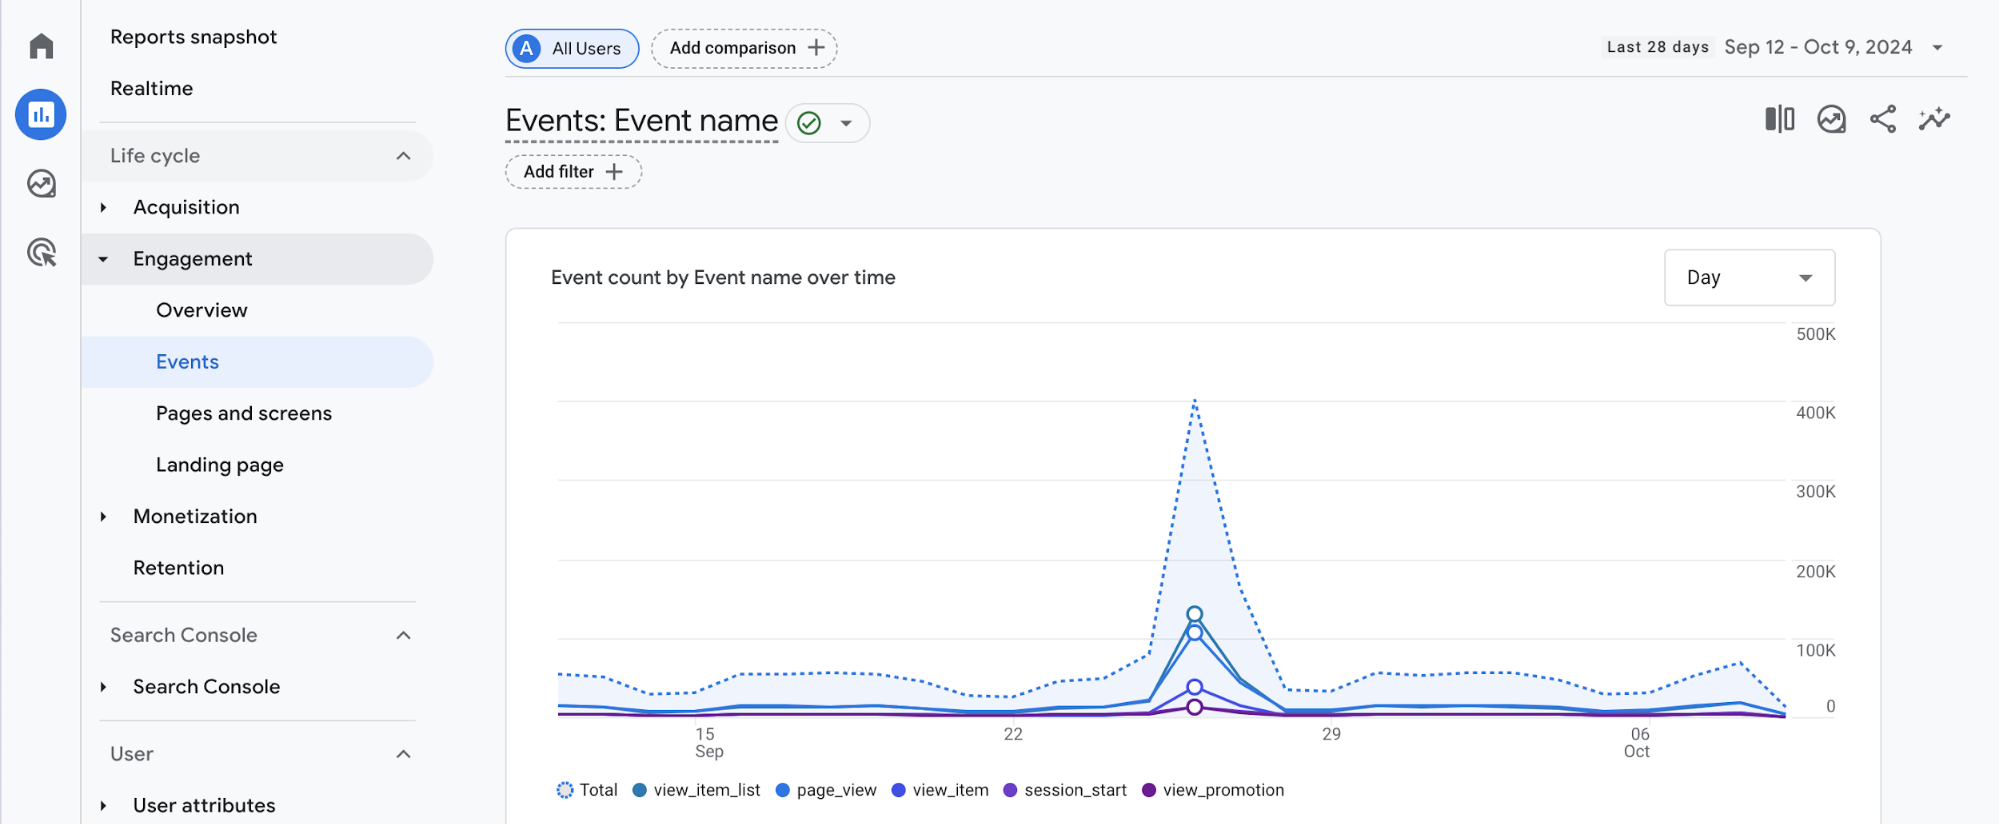
Google Analytics automatically tracks events like ad clicks, session starts, and page views. To track other event types beyond these automatically collected events, you’ll need to set up custom event tracking in your GA4 property or Google Tag Manager.
Once you’ve set up event tracking, here’s how to view the report in GA.
- Go to the Reports section in GA4.
- Go to Engagement > Events to view the total event counts for each event type you have tracked on your website.
Engaged sessions
An engaged session is a session that lasts longer than ten seconds, has a conversion event, or has at least two page views or screen views (on mobile apps).
This metric refines how Universal Analytics previously measured engagement through bounce rate or session duration. In UA, single-page sessions count as a bounce, regardless of how long you spent on the page. Track this metric to understand if users find your website content valuable or whether there are any user experience issues to address.
Usually, a session ends or times out after 30 minutes of user inactivity. However, you can adjust this duration by opening the data stream and following these instructions.
Besides reviewing overall engagement, you can also break down engaged sessions by traffic source to see which sources bring in the most engaged visitors. It'll help you allocate your marketing budget to the most effective channels.
How to track engaged sessions in GA4
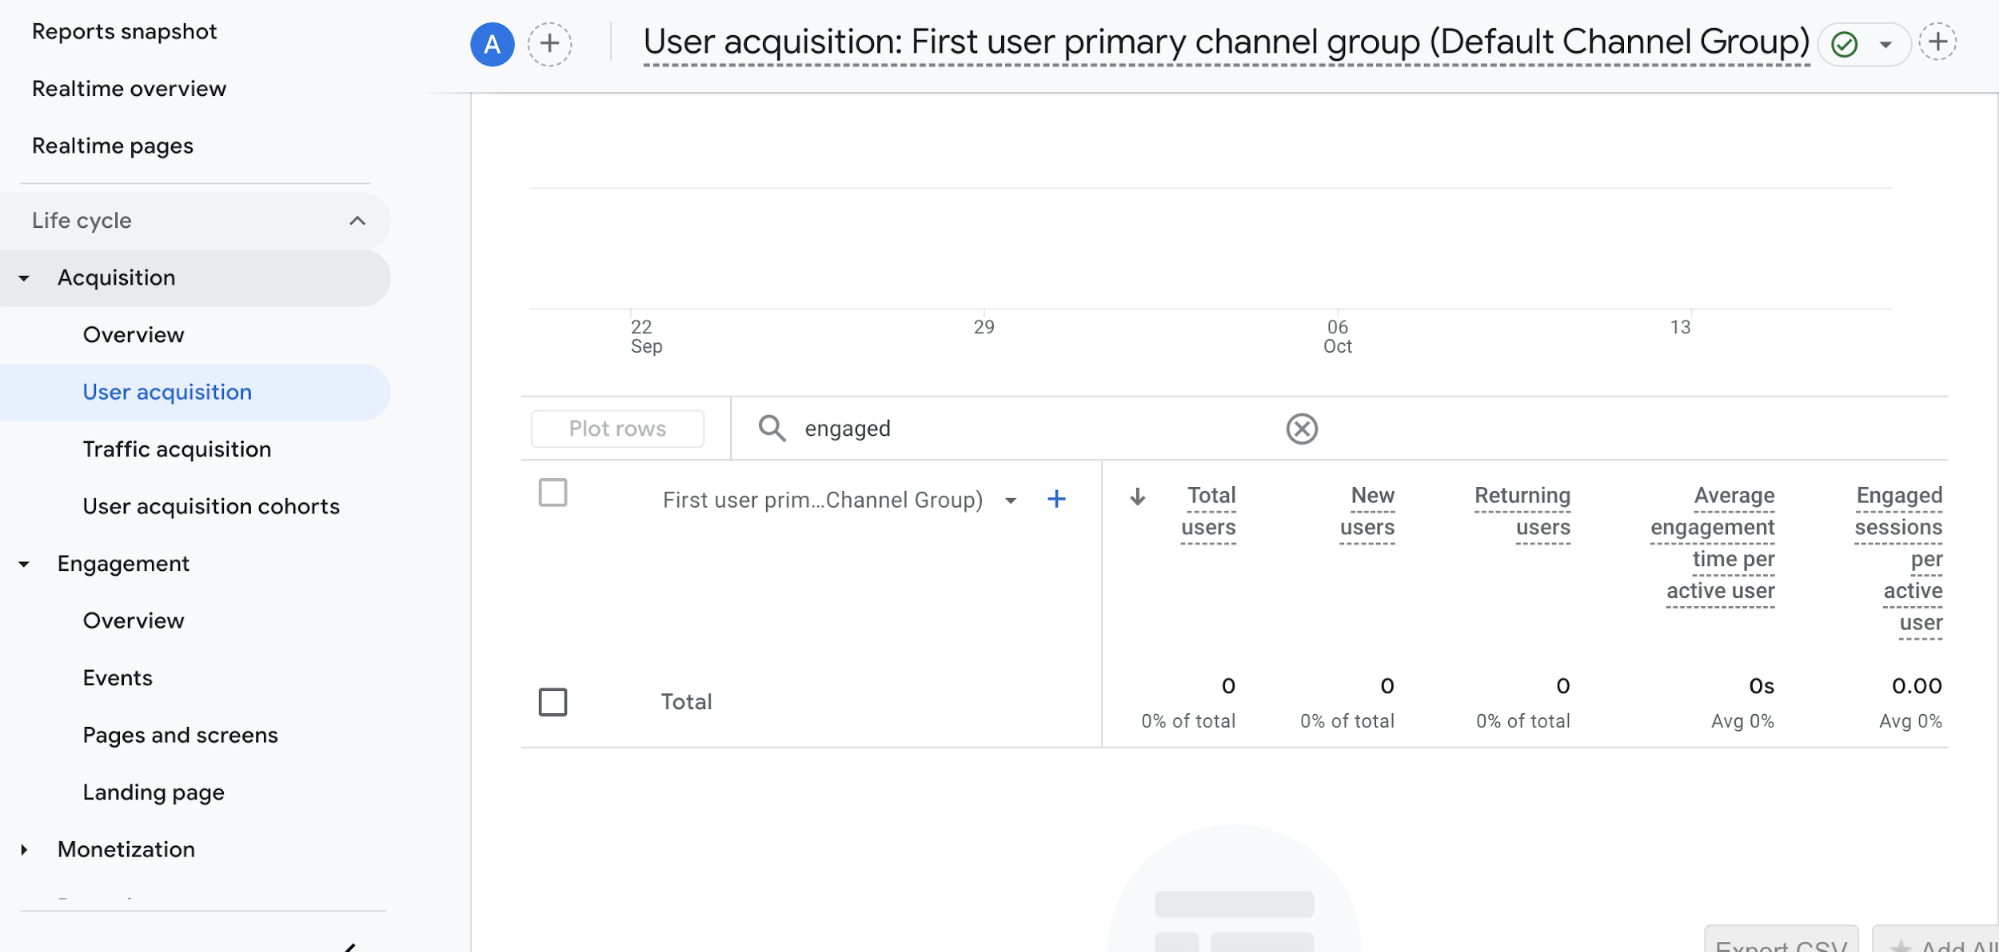
Go to Acquisition > User Acquisition to find a breakdown of engaged sessions per active user.
Engagement rate/bounce rate
Engagement rate measures the percentage of engaged sessions. Unlike UA, which measures bounce rate by single-page visits, GA4 defines it as the percentage of sessions that don't meet any of the three criteria for an engaged session. Low engagement rates can signal issues with content relevance, user engagement, or overall page speed.
Engagement rate formula: Engagement Rate = (Total Number of Sessions / Number of Engaged Sessions) × 100
How to track engagement rate and bounce rate in GA4
In the Engagement section, select the Engagement Overview. This standard report in GA4 summarises engagement metrics, including the average number of engaged sessions and engagement rate.
Average engagement time
How many tabs do you have open at one time?
A study by Aalto University shows that most people have 5-10 tabs and 1-3 windows open simultaneously. This means someone might have your website open but not engaging with it right now. This metric focuses on active interaction, making it a more accurate indicator of visitor engagement than UA metrics like Average Session Duration.
Pro tip: When analyzing this metric, try segmenting the data. Break down average engagement time by device type, audience demographics, source/medium, or country to find the most valuable audience segments to focus on.
How to track average engagement time in GA4
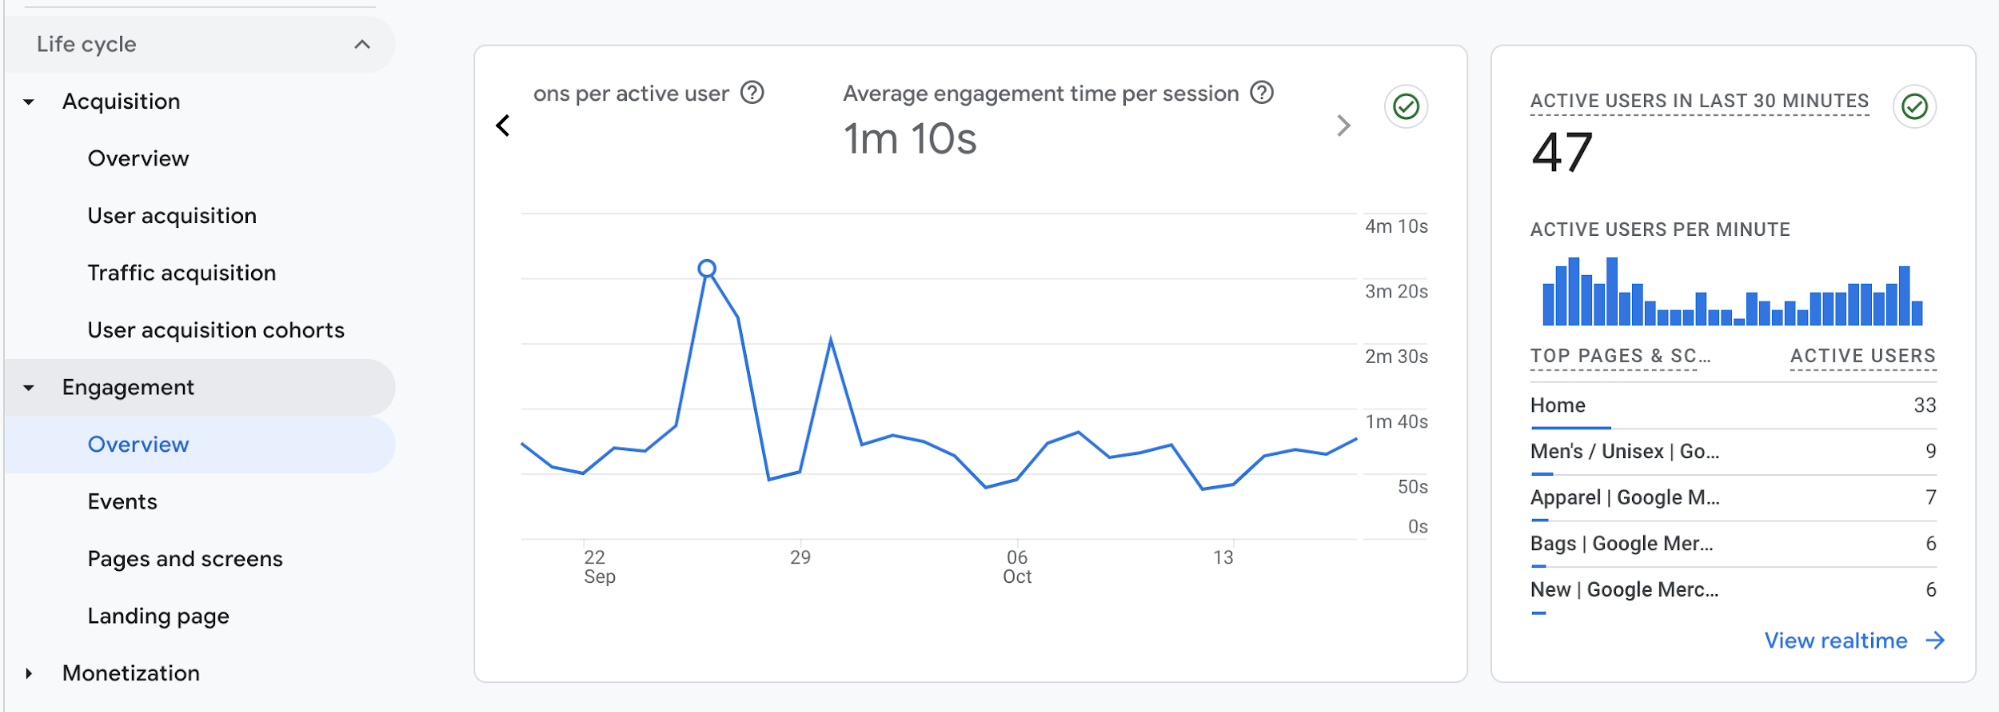
Use the Engagement overview report to track this metric in GA4.
Pages per session
Page views per session indicate the average number of pages a user views during a single session on your website. It’s an important indicator of content quality and overall user experience.
How to track pages per session in GA4
GA4 now includes a page view as an event type and tracks it under the broader metric of events per session. You can find this in GA4 under Engagement > Events > pageview. Alternatively, use the formula: Total pageviews / total sessions.

Scroll depth
Scroll depth examines how much a person scrolled down your page. It tells you which parts of your website capture their attention, and where their attention falls off.
How to track scroll depth in GA4
Use the Enhanced Measurement toggle in GA4 to automatically track fundamental interactions like scroll depth. This toggle tracks when users scroll down to 90% of the page, which is handy if you want to track whether people complete reading a webpage or an article.
With admin or editor permissions, you can also configure custom definitions in Google Tag Manager. This allows you to set up an event for other scroll depth options. For example, you can set up triggers for users who have scrolled through 10% or 50% of your page. Here’s a handy guide to configure this in Google Tag Manager.
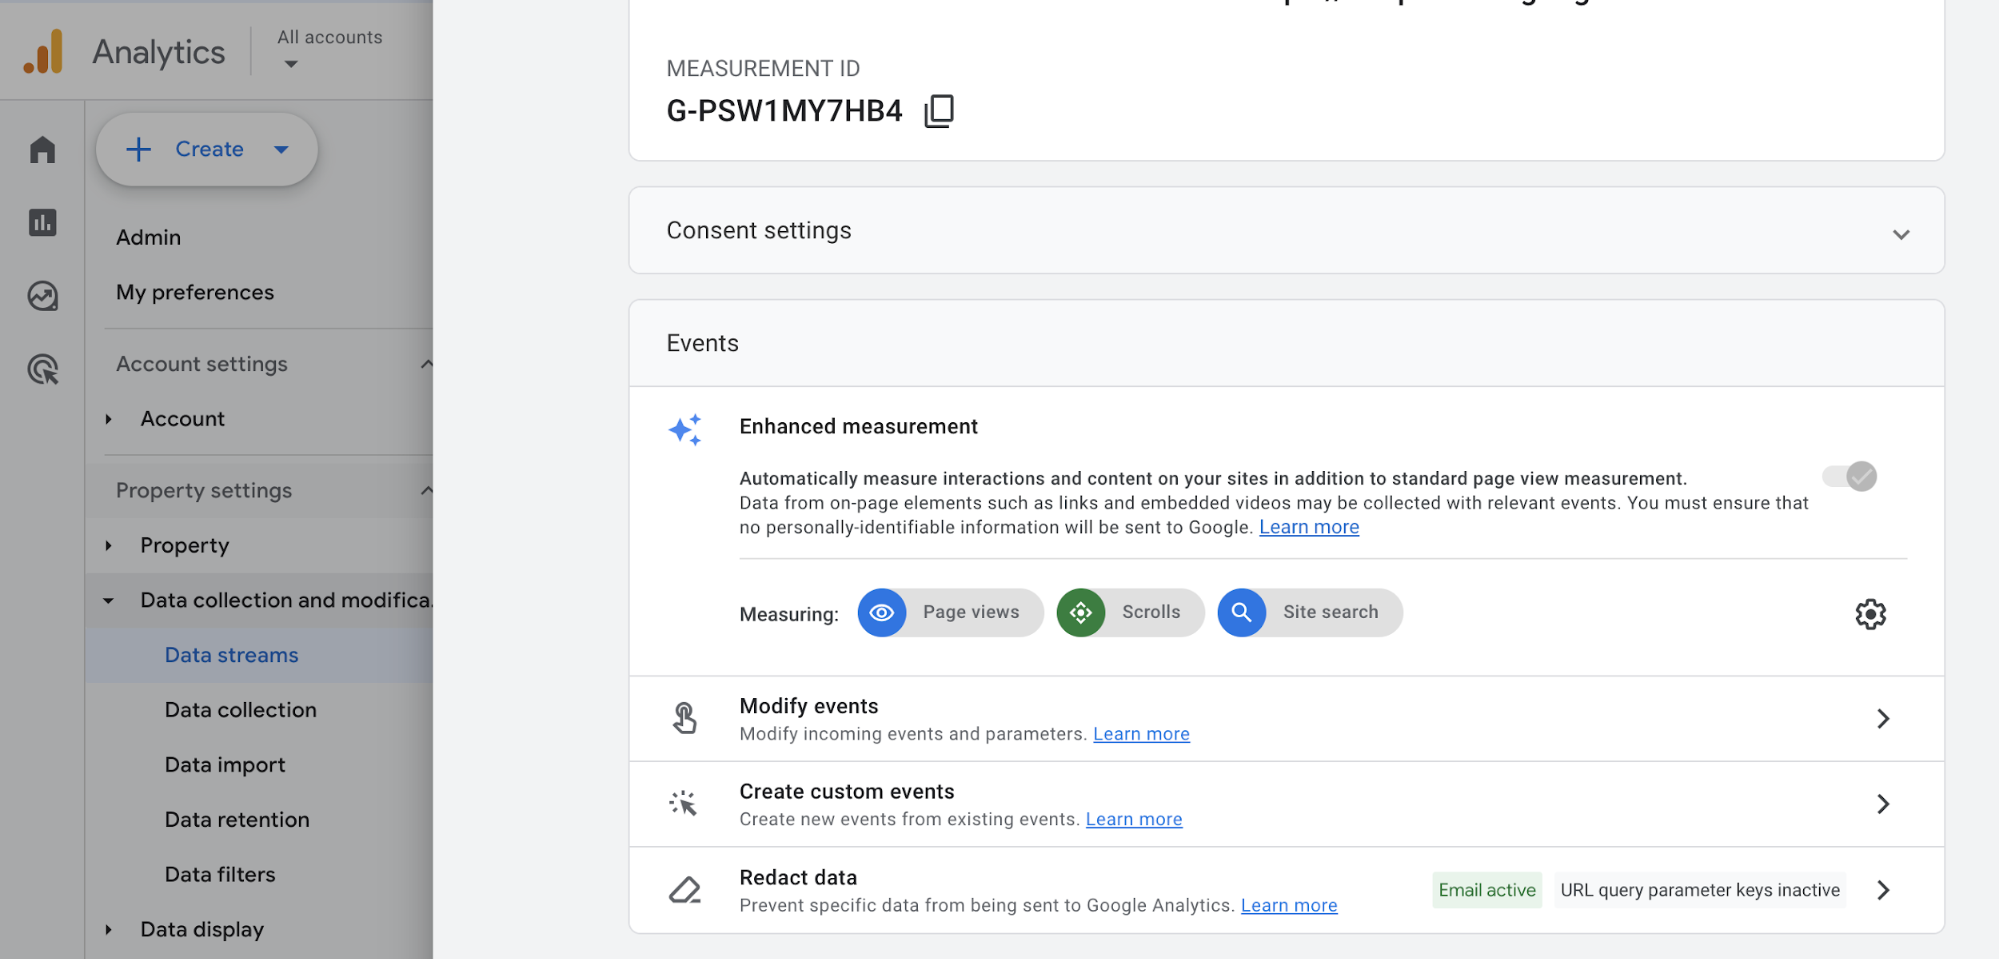
You can also configure custom definitions in Google Tag Manager. This allows you to set up an event for other scroll depth options. For example, you can set up triggers for users who have scrolled through 10% or 50% of your page. Here’s a handy guide to configure this in Google Tag Manager.
Conversion metrics
Conversion metrics measure the success of your marketing efforts in getting people to take action on your website or app. They can track activities like trial signups, file downloads, downloading an app, making an ecommerce purchase, or adding a product to a cart.
Conversions
Conversions (now known as key events in GA4) track the success of your marketing efforts. They're handy to have in your reports when presenting to clients, especially for lead generation or sales campaigns.
How to track key events in GA4
First, make sure you have a GA4 property created, and you’ve set up a tracking code on your website or email. Then, follow Google’s tutorial here.
User and session conversion rate
In GA4, there are two types of conversion rates: session conversion rates and user conversion rates.
Session conversion rates calculate the number of sessions with a key event by the total number of sessions, while user conversion rates measure the percentage of unique users who trigger at least one key event during their visits.
Since session conversion rate measures whether a conversion happens during a session, it's better suited for websites with many repeat customers or shorter sales cycles. In contrast, user conversion rate tracks how often individual users make a purchase, helping you see how well your website converts users over longer sales cycles.
How to track conversion rates in GA4
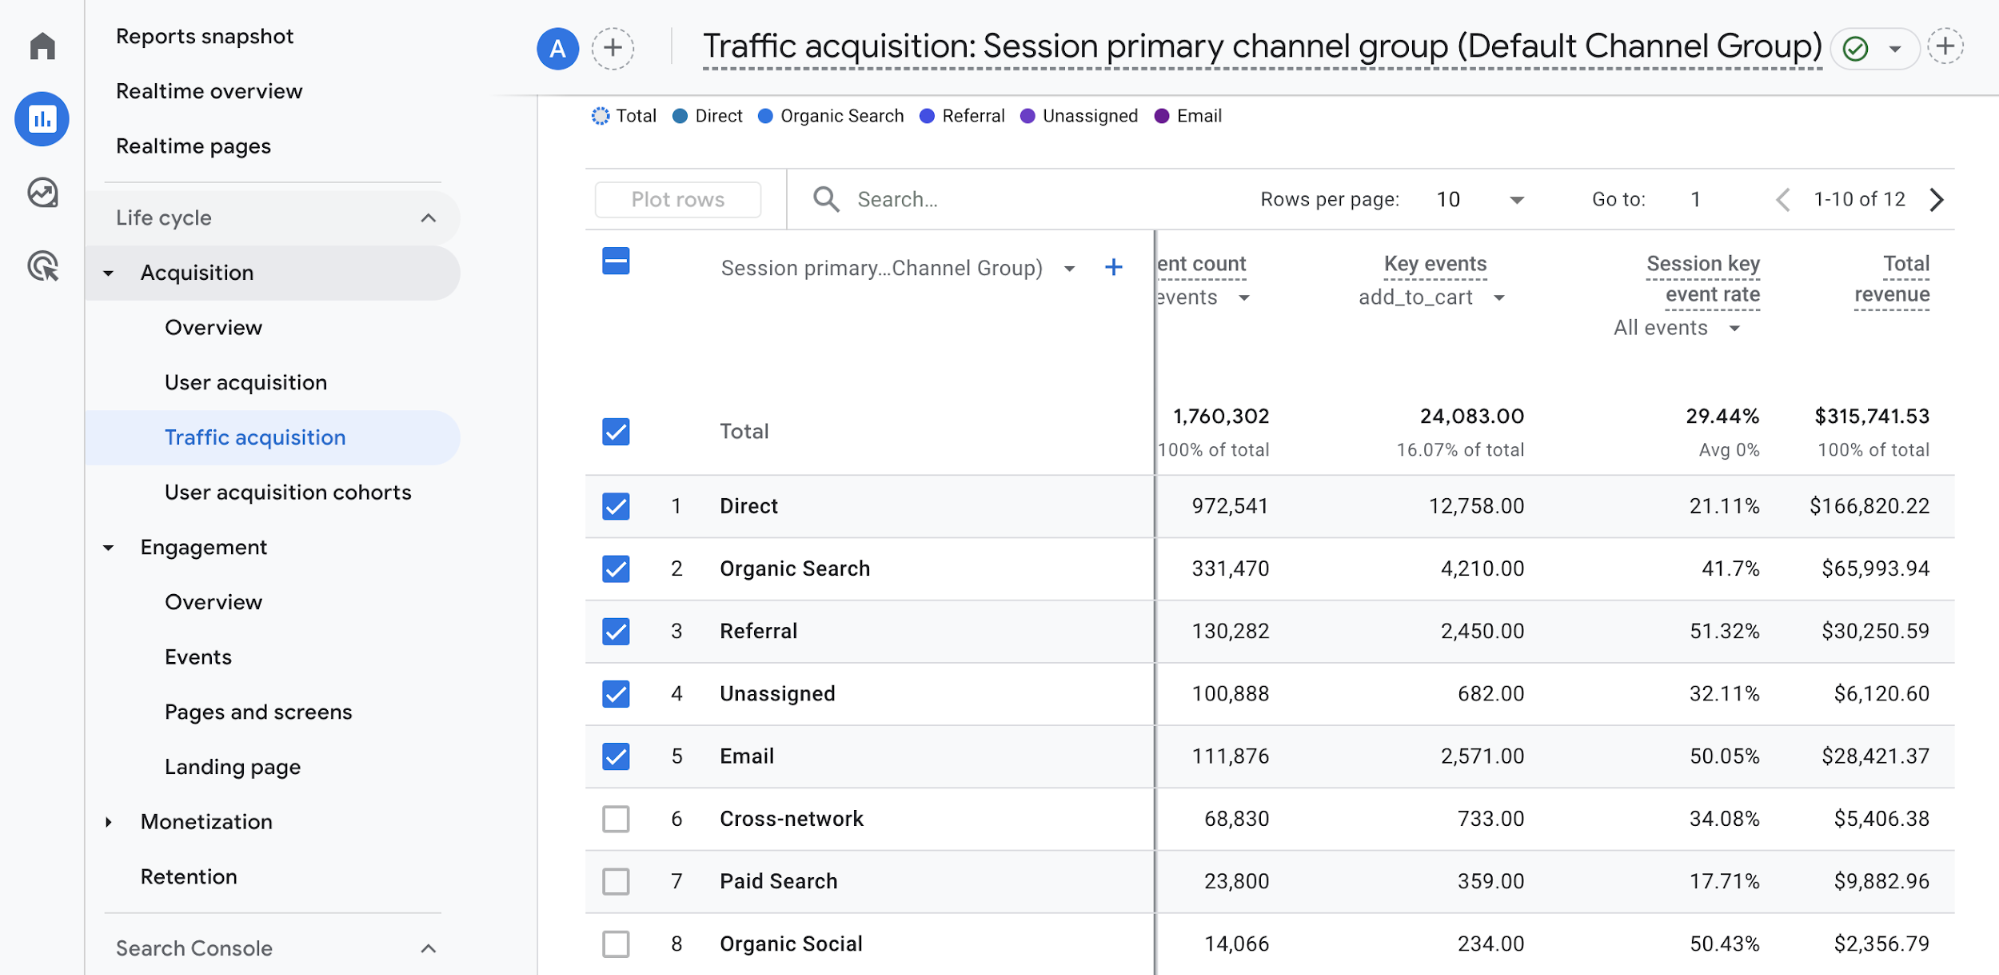
After you’ve added and defined your key events to track following these steps, go to Acquisition > Traffic Acquisition. Then, you can track the total number of event triggers and your overall conversion rate.
Revenue
Revenue refers to the amount of money generated from business activities like sales and marketing. It’s a key metric to gauge marketing impact and ROI.
How to track revenue in GA4
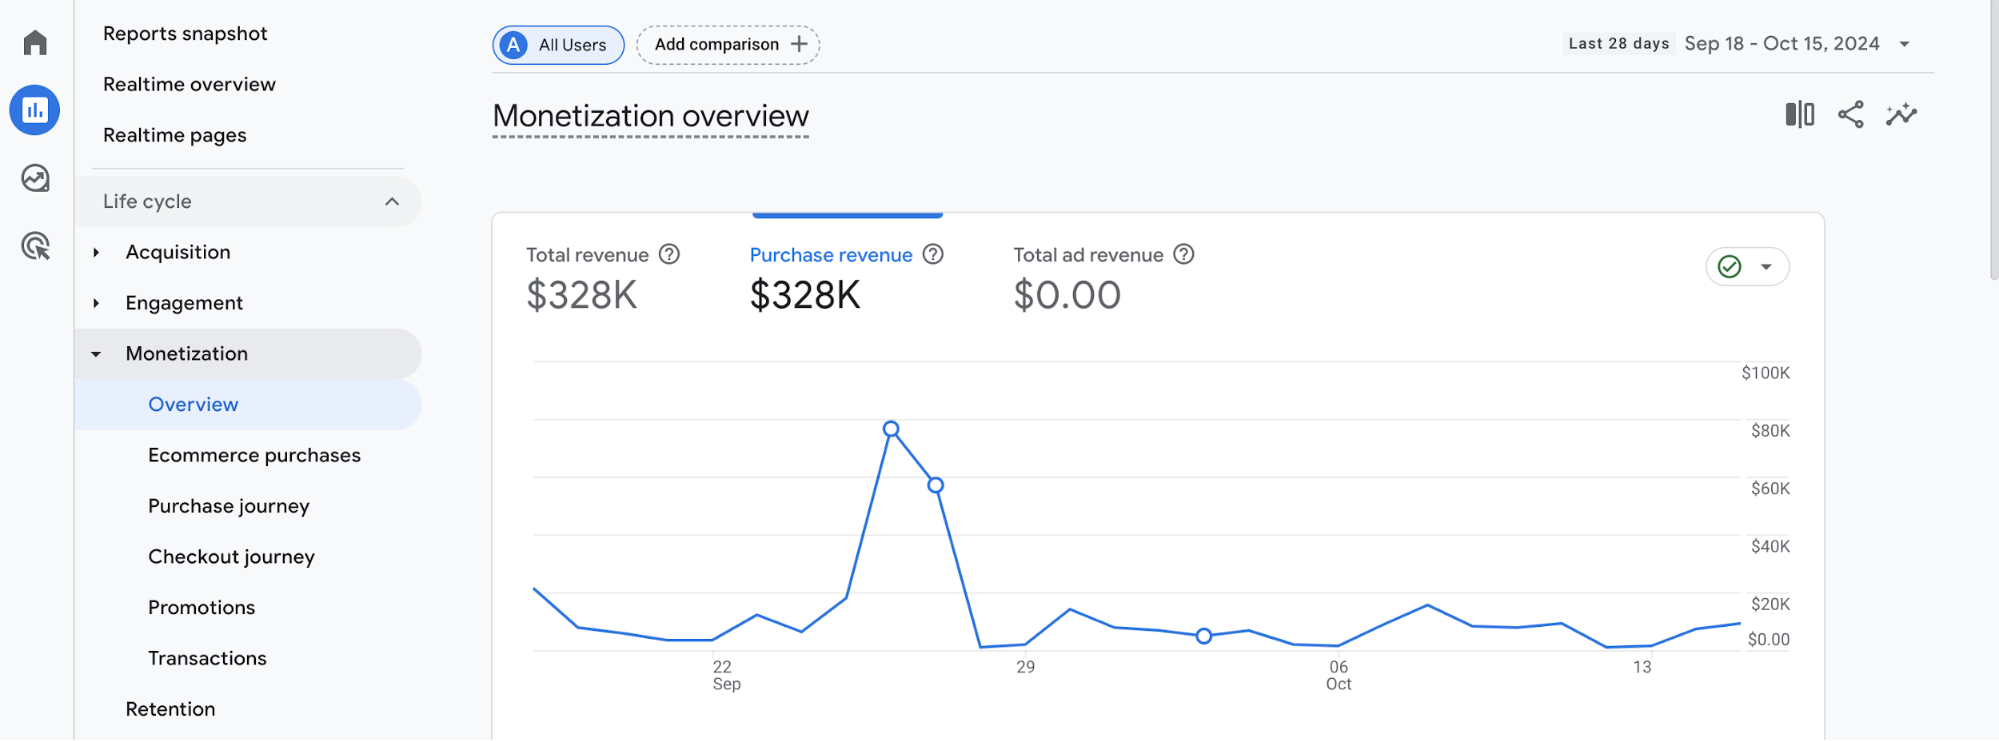
You’ll first need to set up a purchase event on your website to track your revenue. Once you’ve set up the necessary revenue-based events and parameters in GA4, use the Monetization Overview in GA4 to quantify your sales and track business revenue.
Average Order Value (AOV)
For e-commerce businesses, AOV is crucial as it measures the amount of money customers spend per order.
This metric helps to:
- Inform pricing strategies.
- Find ways to raise revenue through discounts or upselling.
- Create targeted sales and marketing campaigns to boost AOV.
Average Order Value formula
Revenue ÷ the total number of orders = Average Order Value.
How to track average order value in GA4
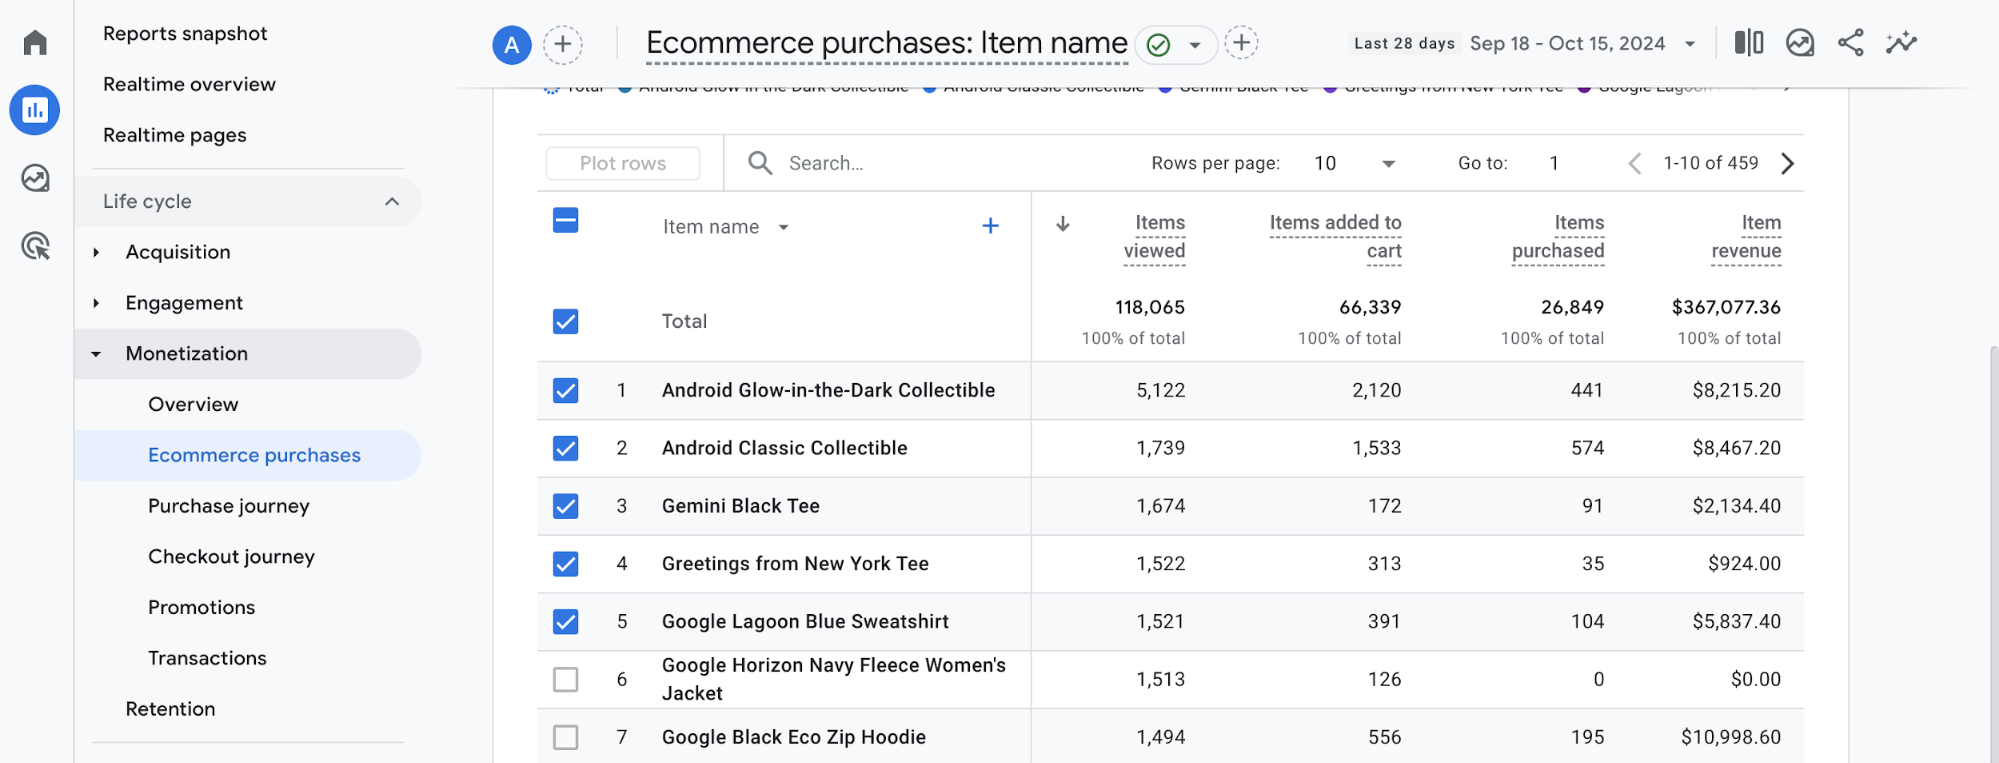
AOV isn’t included in GA4’s default reports, but you can calculate it with a simple formula. Go to Monetization > E-commerce purchases report and apply the AOV formula: Revenue ÷ the total number of orders = Average Order Value.
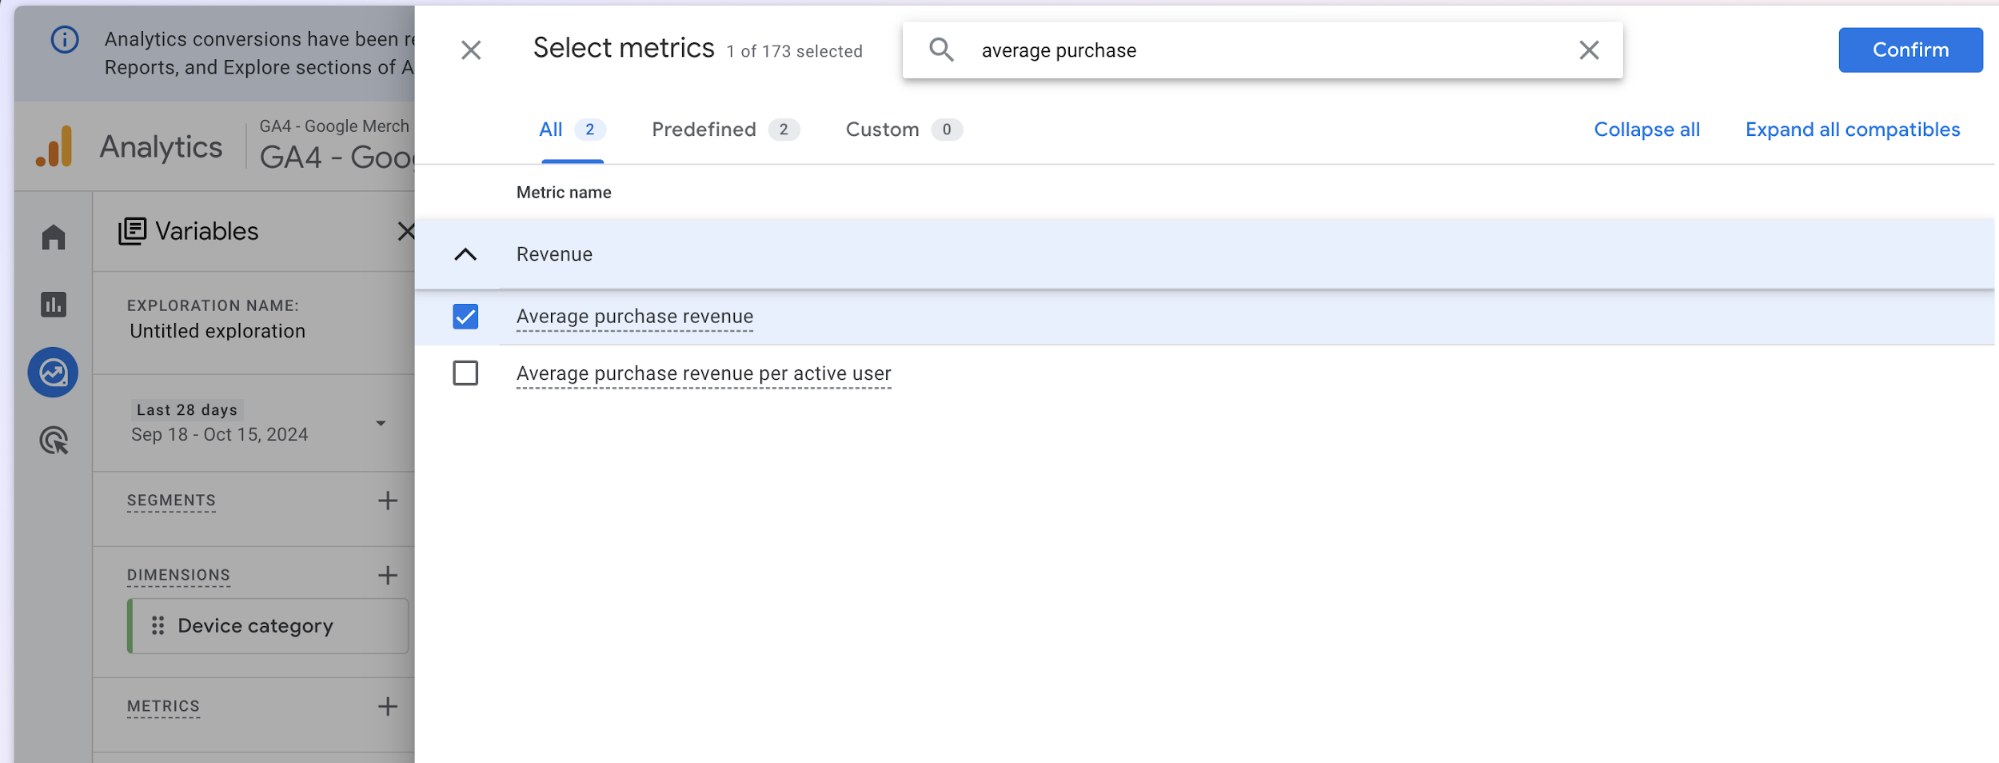
You can also create an exploration in GA4 to view your AOV data. Add the metric average purchase revenue to a GA4 exploration report.
User interaction metrics
User interaction metrics focus on visitors to your website. Track these metrics to understand your total audience size and how well your site retains users.
Total Users
The total number of unique users interacted with your website (i.e., triggered an event like a page view or link click) within a specified date range. This metric helps you understand your total audience size.
How to track total users in GA4
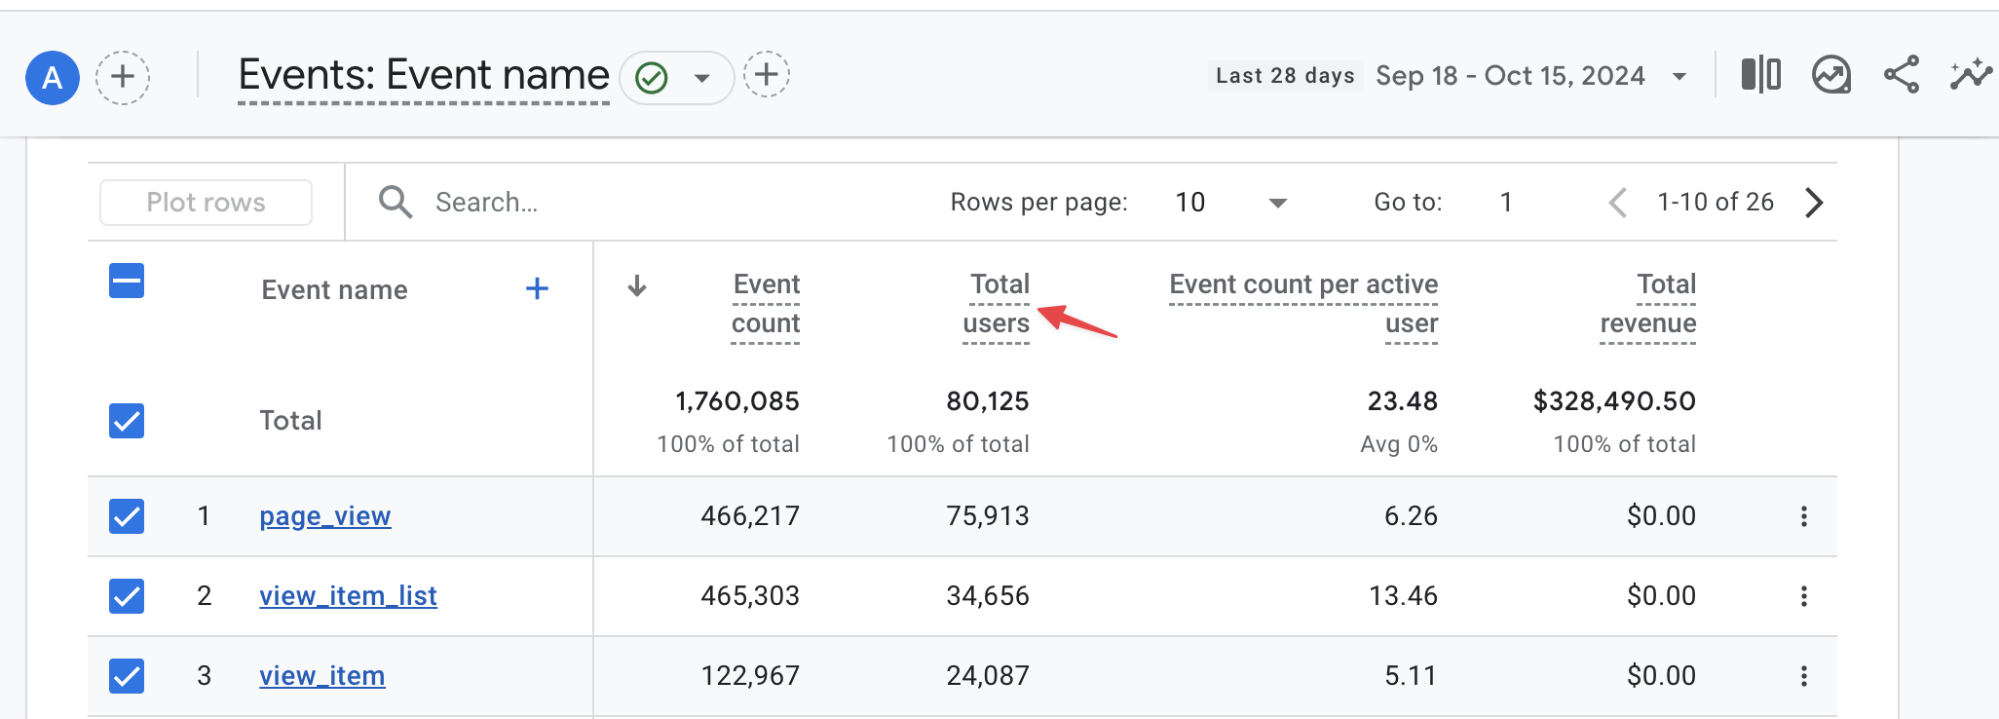
Click on Reports > Engagement > Events. You will see a column labeled Total Users.
Active Users
The number of unique users engaged with your site or app during a specified date range.
How to track active users in GA4
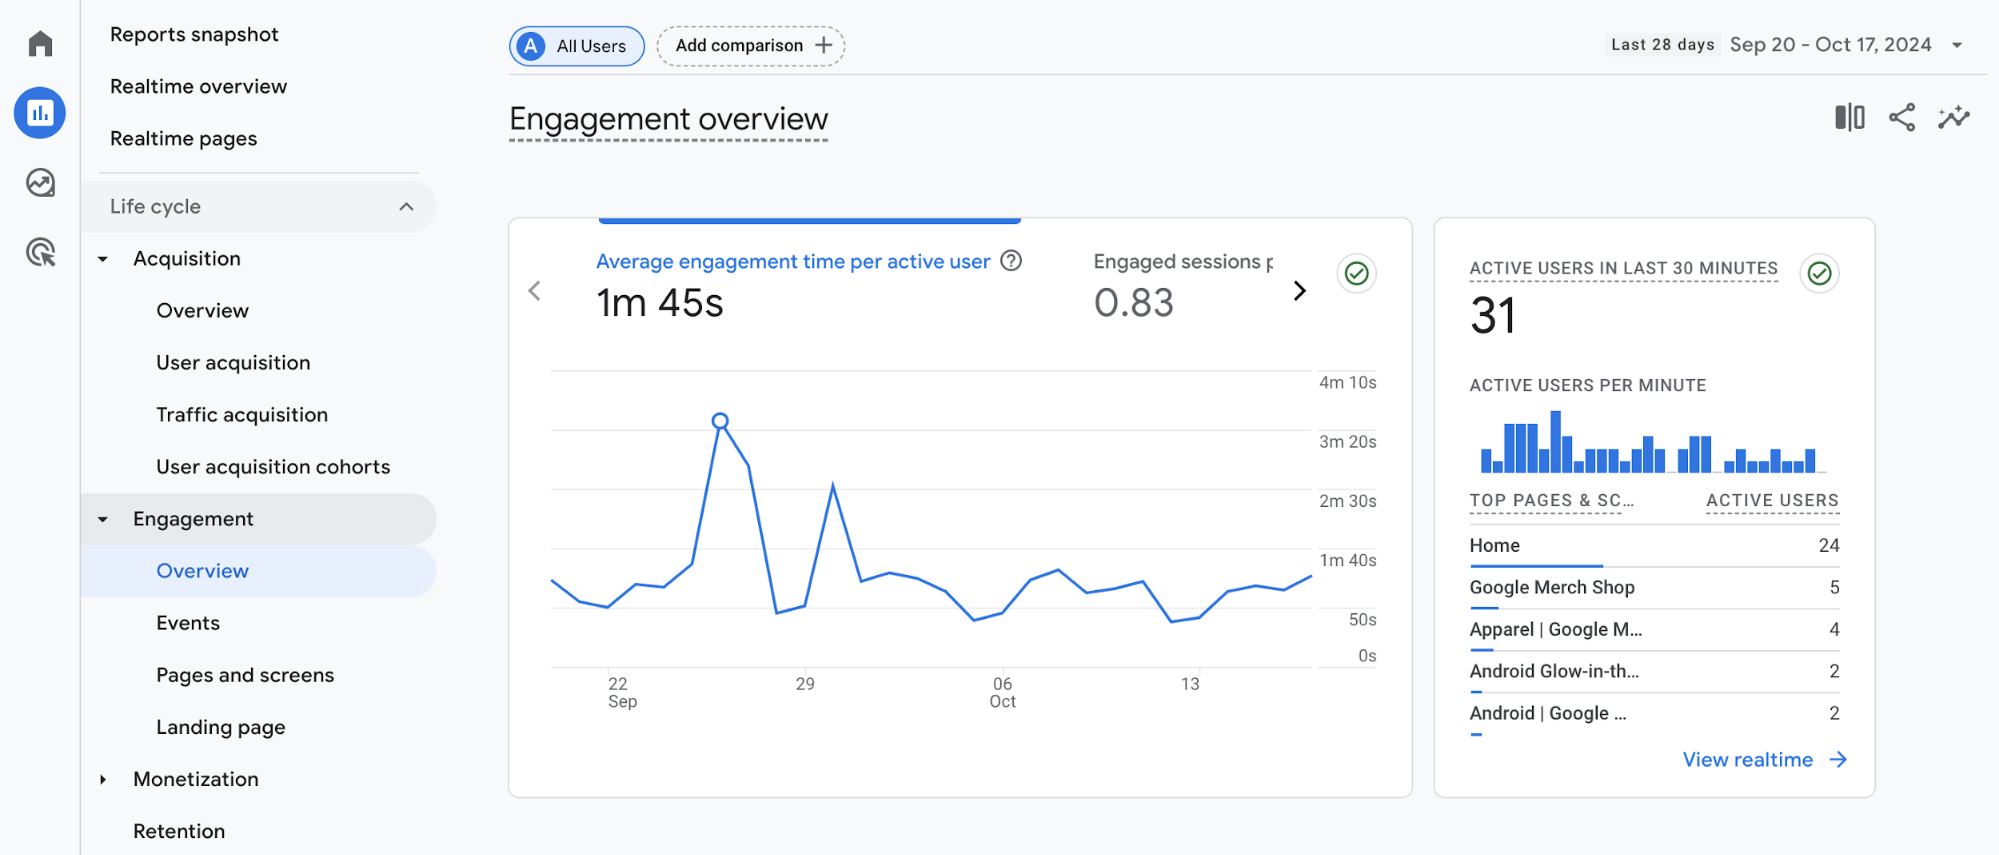
Head to Reports > Engagement > Overview.
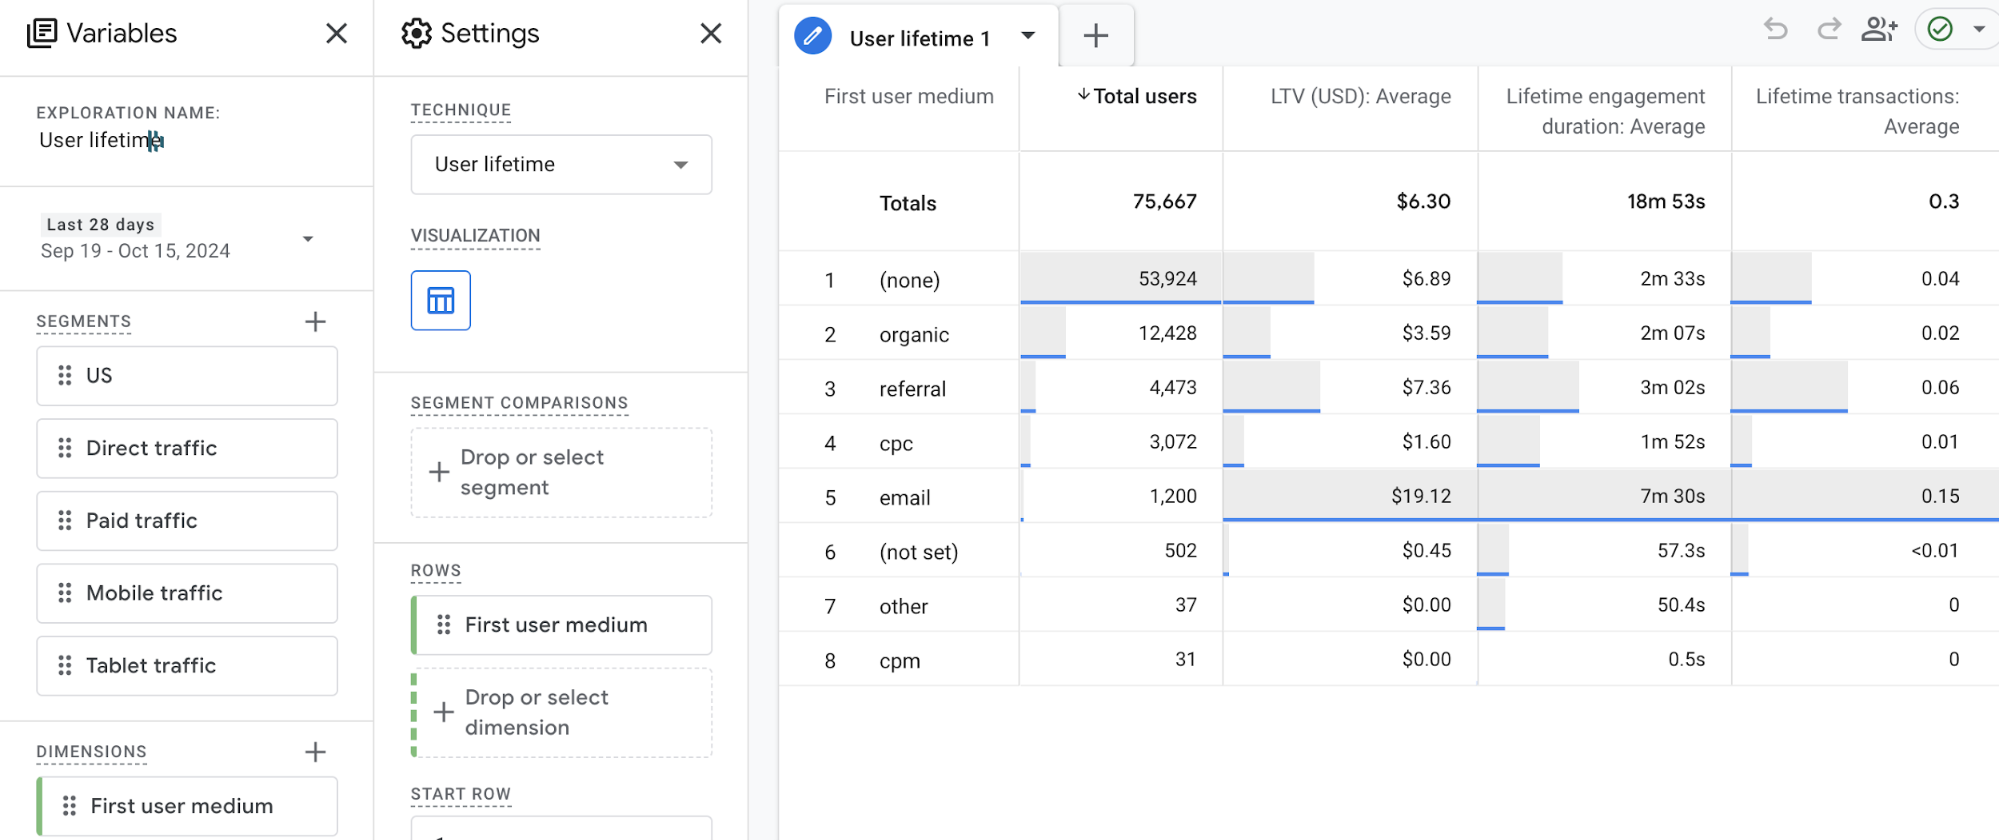
Lifetime Value (LTV)
Lifetime value is the total amount of money you expect a customer to spend with your client’s business over time. Tracking this metric lets you gain insight into your customers' spending habits. It's handy when evaluating your customer acquisition strategies' return on investment (ROI) or profitability. You can also use LTV to segment your customers and identify who your most valuable ones are.
How to track LTV in GA4
Go to the Explore tab in GA4 and select the User lifetime exploration technique. This exploration includes a dedicated tab for tracking LTV.
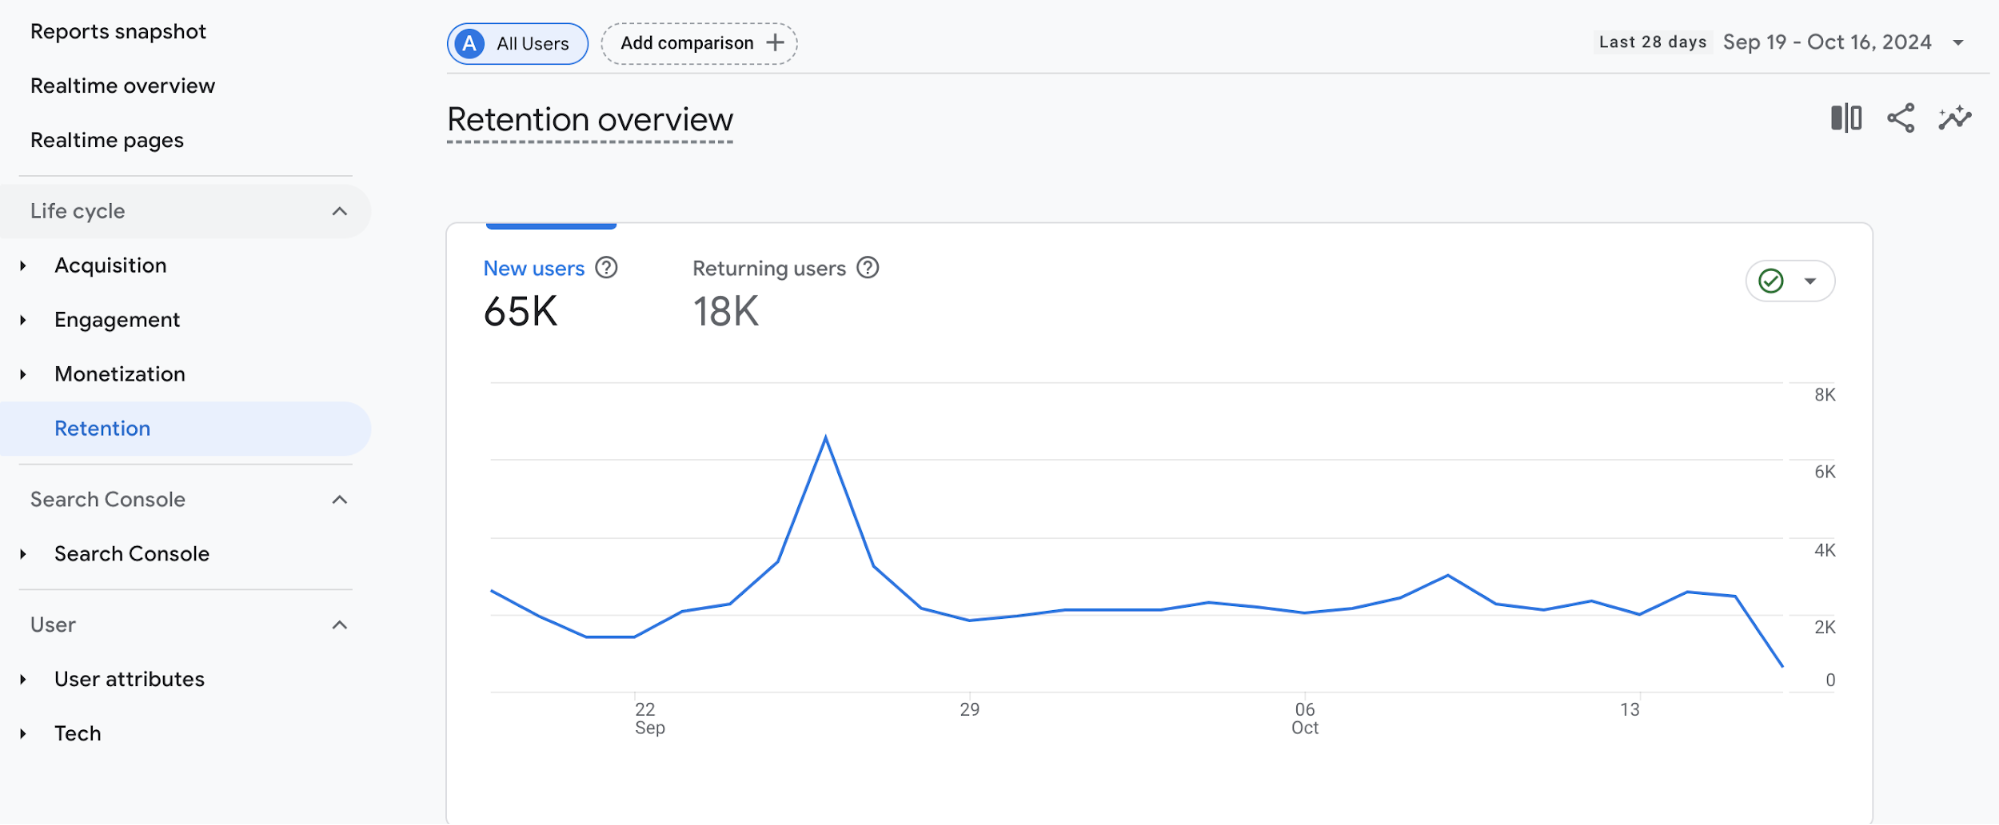
User retention
The number of users who have previously visited your site and returned within the specified date range. Track user retention to understand how effectively your website retains users, which can help you formulate a suitable retention strategy.
How to track user retention in GA4
Use the Retention report in GA4. You can find this under the Life cycle tab in GA4.
Track your GA4 metrics with DashThis
Google Analytics 4 offers a wide range of metrics to analyze. But, manually logging in to your client's GA4 accounts to gather analysis data can be a waste of time. That's why DashThis can simplify collecting, analyzing, and reporting data.
With DashThis, you can import data from your marketing tools into one dashboard, in addition to your GA4 data. Imagine having easy-to-understand visualizations combining your Meta and TikTok ads data with your GA4 web analytics data. This way, you can get a complete picture of your marketing funnel.
How to set up a DashThis dashboard for GA4 metrics
DashThis is one of the most accessible dashboard tools for simplifying GA4 reporting. To get started, follow these simple steps:
- First, let’s sign up for DashThis’s 15-day trial.
- Connect your GA4 account (and any other marketing tools you want to analyze) as a data source.
- Assemble your dashboard with drag-and-drop widgets. Or, use our GA4 report template below as a starting point.
- Once you’re happy with how it looks, schedule and automate your reports to save time.
GA4 report template
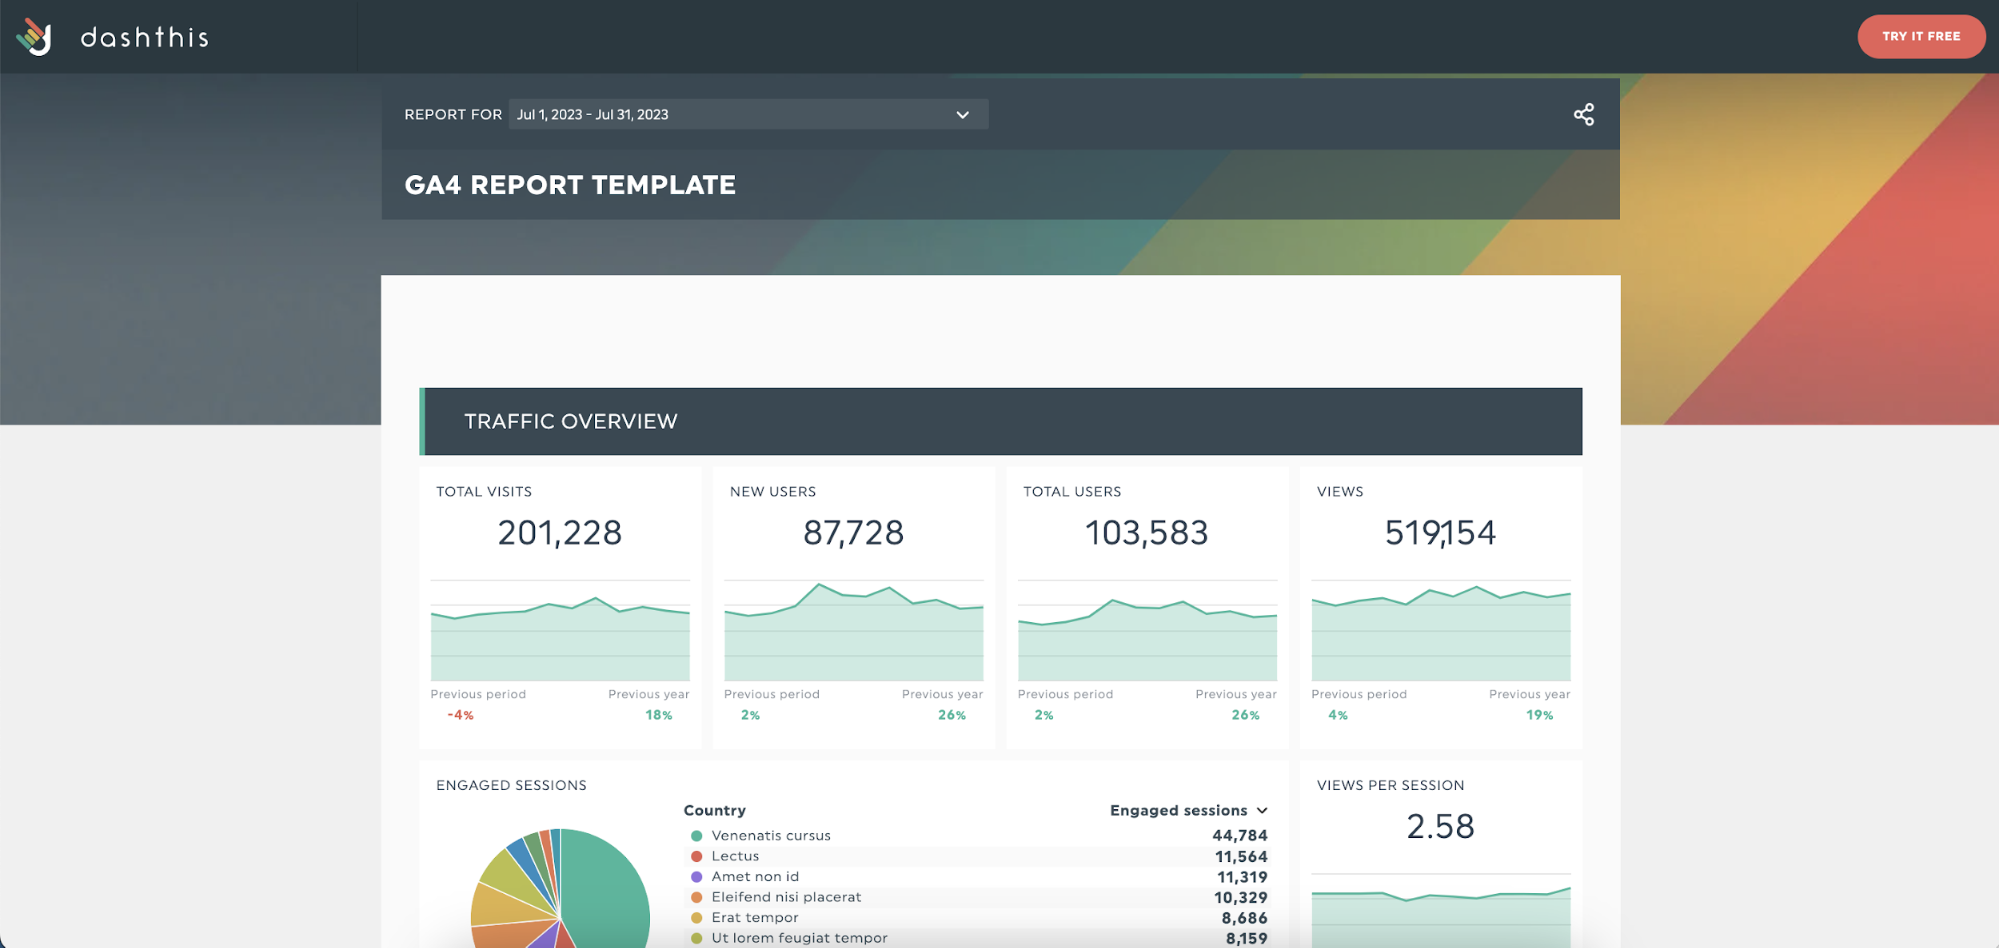
Get this GA4 dashboard template with your own data!
This report template helps you visualize your client's GA4 data for easier budgeting or planning. It showcases an overview of your client’s website performance and landing pages for easy monitoring. You can also dive deeper to find which marketing channels drive engagement or sales to your client’s business.
Tips to use DashThis to monitor and analyze GA4 metrics effectively
Let’s explore a few DashThis features to make your GA4 data analysis easier.
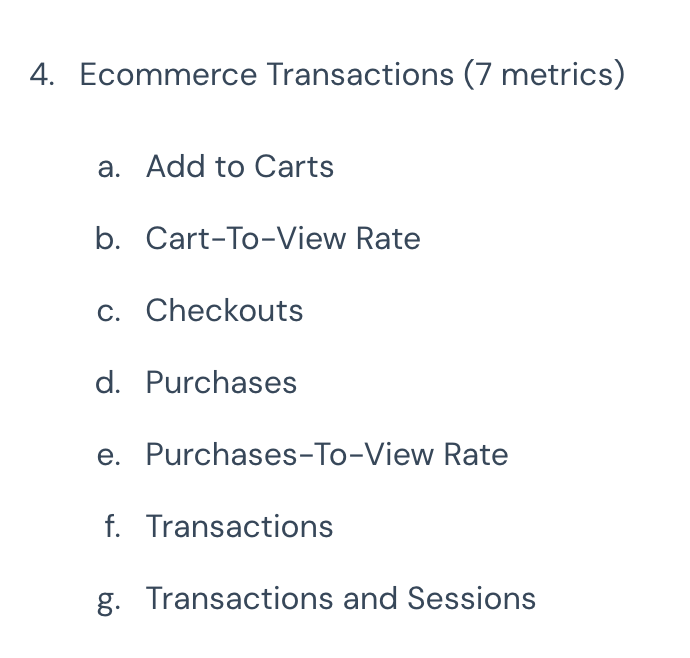
Use widget bundles to add related metrics to your GA4 report
For example, this e-commerce transaction widget bundle automatically includes all crucial KPIs. Use this feature to add key metrics to your report without manual input.

Analyze GA4 data alongside your marketing tools
GA4 analysis is excellent for web analytics or tracking users across different devices. However, when analyzing your website or marketing performance, GA4 alone doesn’t tell the whole picture.
What if you want to combine data from GA4 with metrics from other marketing platforms, such as Google Ads, social media, and paid search? Alternatively, you can compare metrics across different channels to see which performs best.
This usually complicates your reporting and data collection process. For example, if you use Google Sheets, you'll have to export and download data from multiple tools, carefully format it, and check for errors.
Use DashThis's integrations to combine key data sources into one report. This will simplify the reporting process and give you more time to analyze data and deliver results to your clients.
Save time with automated reporting
Once satisfied with your GA4 reporting dashboard, it's time to set up automated report scheduling to save time, primarily if you work with multiple clients with different needs.
Click Sharing Options > Share by Email > Frequency. This will automatically schedule an email to your client with the updated dashboard. You won't have to worry about missed or late reports again!
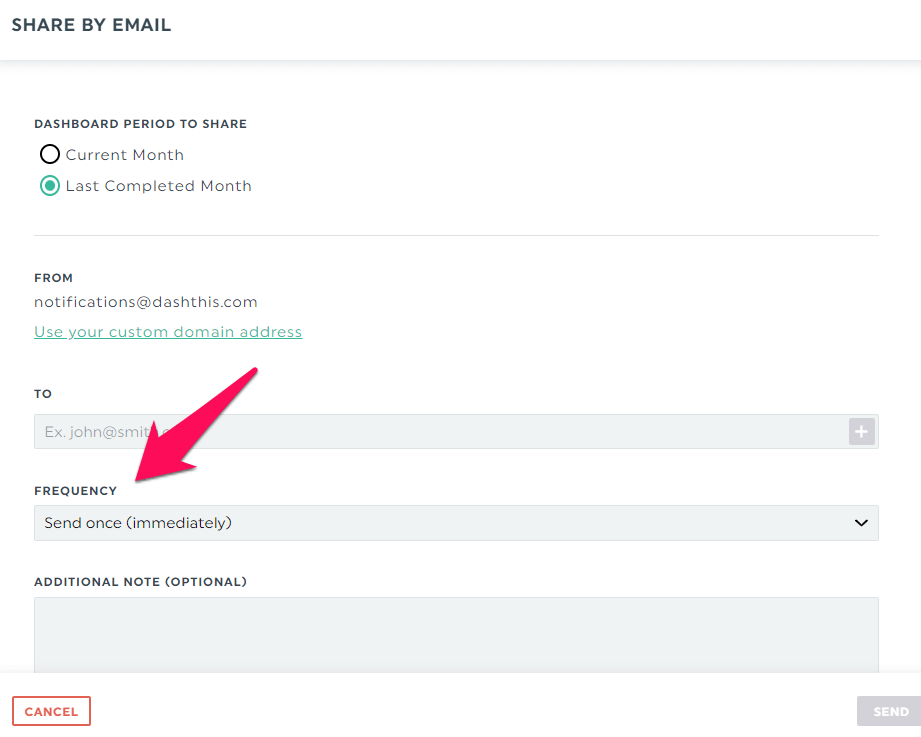
Or share a URL link with your dashboard. Clients can view it online in real-time, which is perfect for preparing for an in-person or video meeting to discuss your client's metrics.
Report automation shines when you're managing multiple clients. Take web marketing agency Rablab, for example. They used to download reports as PDFs and manually send them to each client. This process was a hassle and made it challenging to grow their business. But now, with automated report dispatch, they're saving 4 hours of work per month per employee.
Automate your GA4 metrics tracking with DashThis
Google Analytics 4 contains a wealth of information to answer your client’s most pressing business questions. Use this GA4 glossary to help you understand the definitions of key GA4 metrics and identify which metrics are relevant to track for you.
If you need help with reporting or spend too much time assembling client reports, use DashThis to make the marketing reporting process less painful. Sign up for your 15-day free trial of DashThis today.
Ready to automate your GA4 reporting with Dashthis?
Read More
Don’t miss out!
Automate your reports!
Bring all your marketing data into one automated report.
Try dashthis for free

