The Easiest Way to Export Google Analytics PDF Reports

Say what you want about Google Analytics 4, but it's here to stay.
This web analytics tool may have received flak for its unintuitive interface, but you can't deny it provides valuable insights into your website performance. The measurement capabilities and advanced event tracking are unmatched.
In this guide, learn how to export your entire data from Google Analytics into PDF files. And while we’re at it, we’ll also recommend you the easiest reporting tool to automate the process.
Skip ahead.
- Why Google Analytics Reports are Crucial for Marketers
- Tutorial: How to Export a Google Analytics PDF Report
- The Limitations of Google Analytics' Built-In PDF Reports
- Introducing DashThis: Automate Your Google Analytics PDF Reports
- Automate Your Google Analytics Reporting Today
Note: This guide uses Google Analytics and Google Analytics 4 interchangeably.
Why Google Analytics Reports are Crucial for Marketers
Despite the unpopularity of Google Analytics 4, its free reporting capabilities and advanced tracking make it the top choice among marketers. Here are three more reasons why the reports are indispensable.
Make data-driven decisions to optimize campaigns
Your Google Analytics report is the first thing to look at when identifying where your best customers come from and what compels or stops them from taking action.
For example, if your website's conversions decreased, analyze the Funnel Exploration report.
It reveals where users drop off in conversion paths, so you can gather context and strategically plan how to improve it — like improving landing page design or segmenting users by demographics to deliver targeted messaging.
Understand user behavior (and improve key metrics)
GA4 reports also provide insights into customer behavior — like the type of content they want more of.
Let's illustrate this with an example:
You're an SEO strategist deciding which keywords to focus on next quarter. Should you invest more in comparison & alternatives articles or jobs-to-be-done (JTBD) pieces?
In this case, you might analyze metrics like conversions, pageviews, time spent on page, and scroll depth (with the appropriate metrics and dimensions if needed) in the Engagement > Events report. These engagement metrics tell you which content performs best.
Communicate your hard-won results to stakeholders (and get buy-in)
GA4 reports convey your work's impact — they increase your odds of securing buy-in for the next quarter.
Thanks to GA4's native integration with Looker Studio (formerly Google Data Studio), you can quickly turn your raw data into easy-to-understand visualizations, annotate it with text and images, and export to spreadsheets.
It's also easy to present your hard-won results and insights to stakeholders.
Download your reports as PDFs, send them links in scheduled emails, or embed them in other sites. Either way, you'll highlight attribution of your marketing efforts and prove the budget need based on specific results.
Tutorial: How to Export a Google Analytics PDF Report
Even beginners can complete these steps to export PDF reports directly from Google Analytics 4.
First, ensure you have Editor or Admin access. It lets you customize your report right down to the granular level before exporting it.
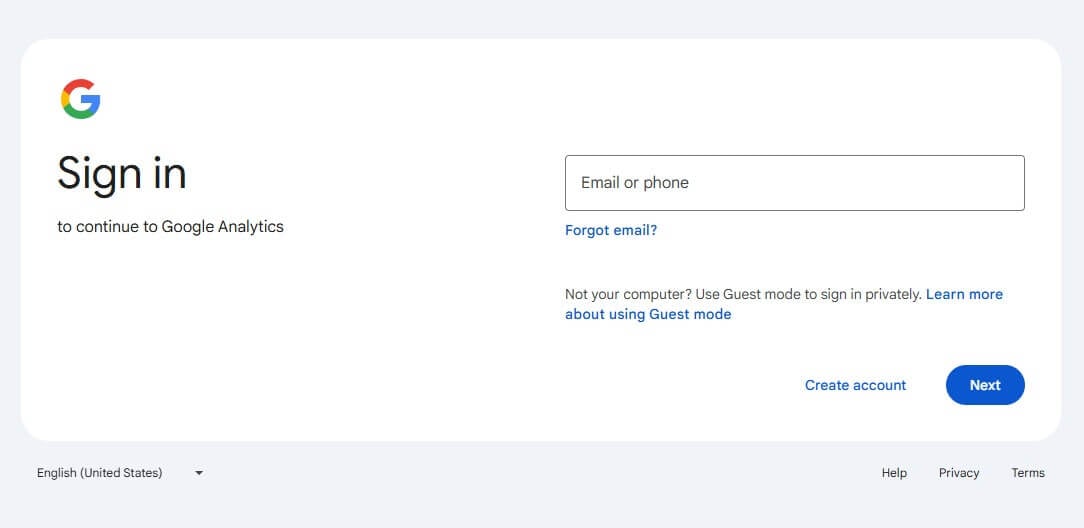
Step 1: Log in to your Google Analytics account
Visit Google Analytics and log in.
Step 2: Locate the report to export
In the left navigation menu, click Reports and select the report to export (e.g., Acquisition > User acquisition to learn how users discover your website).
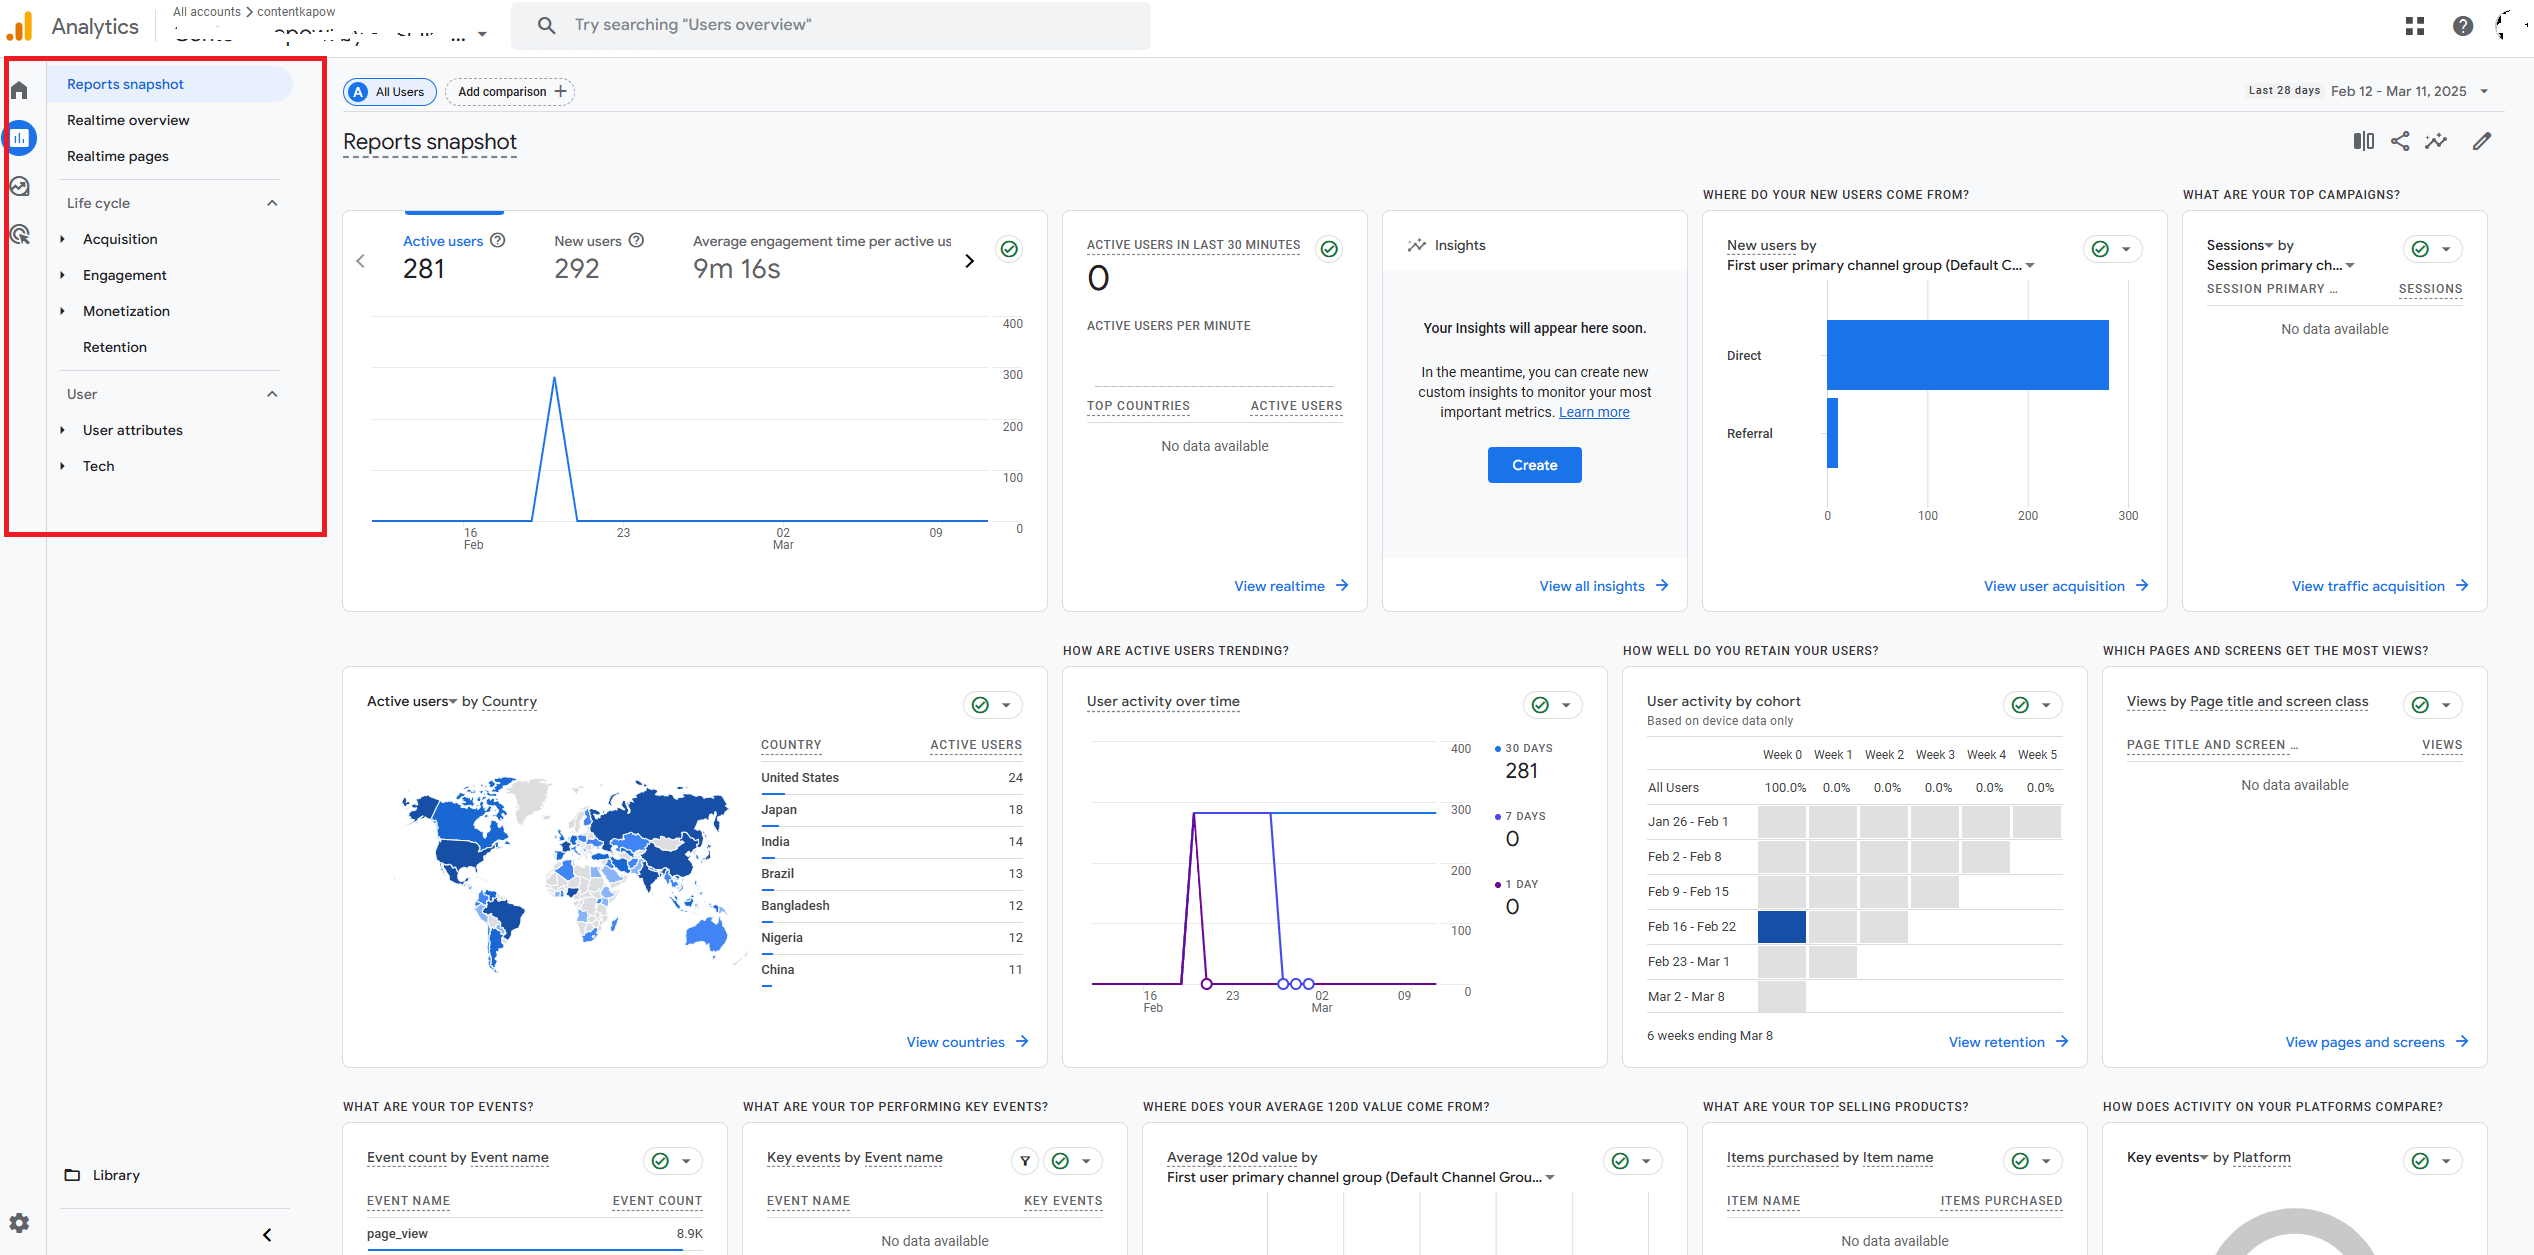
Alternatively, click Explore to access your custom reports.
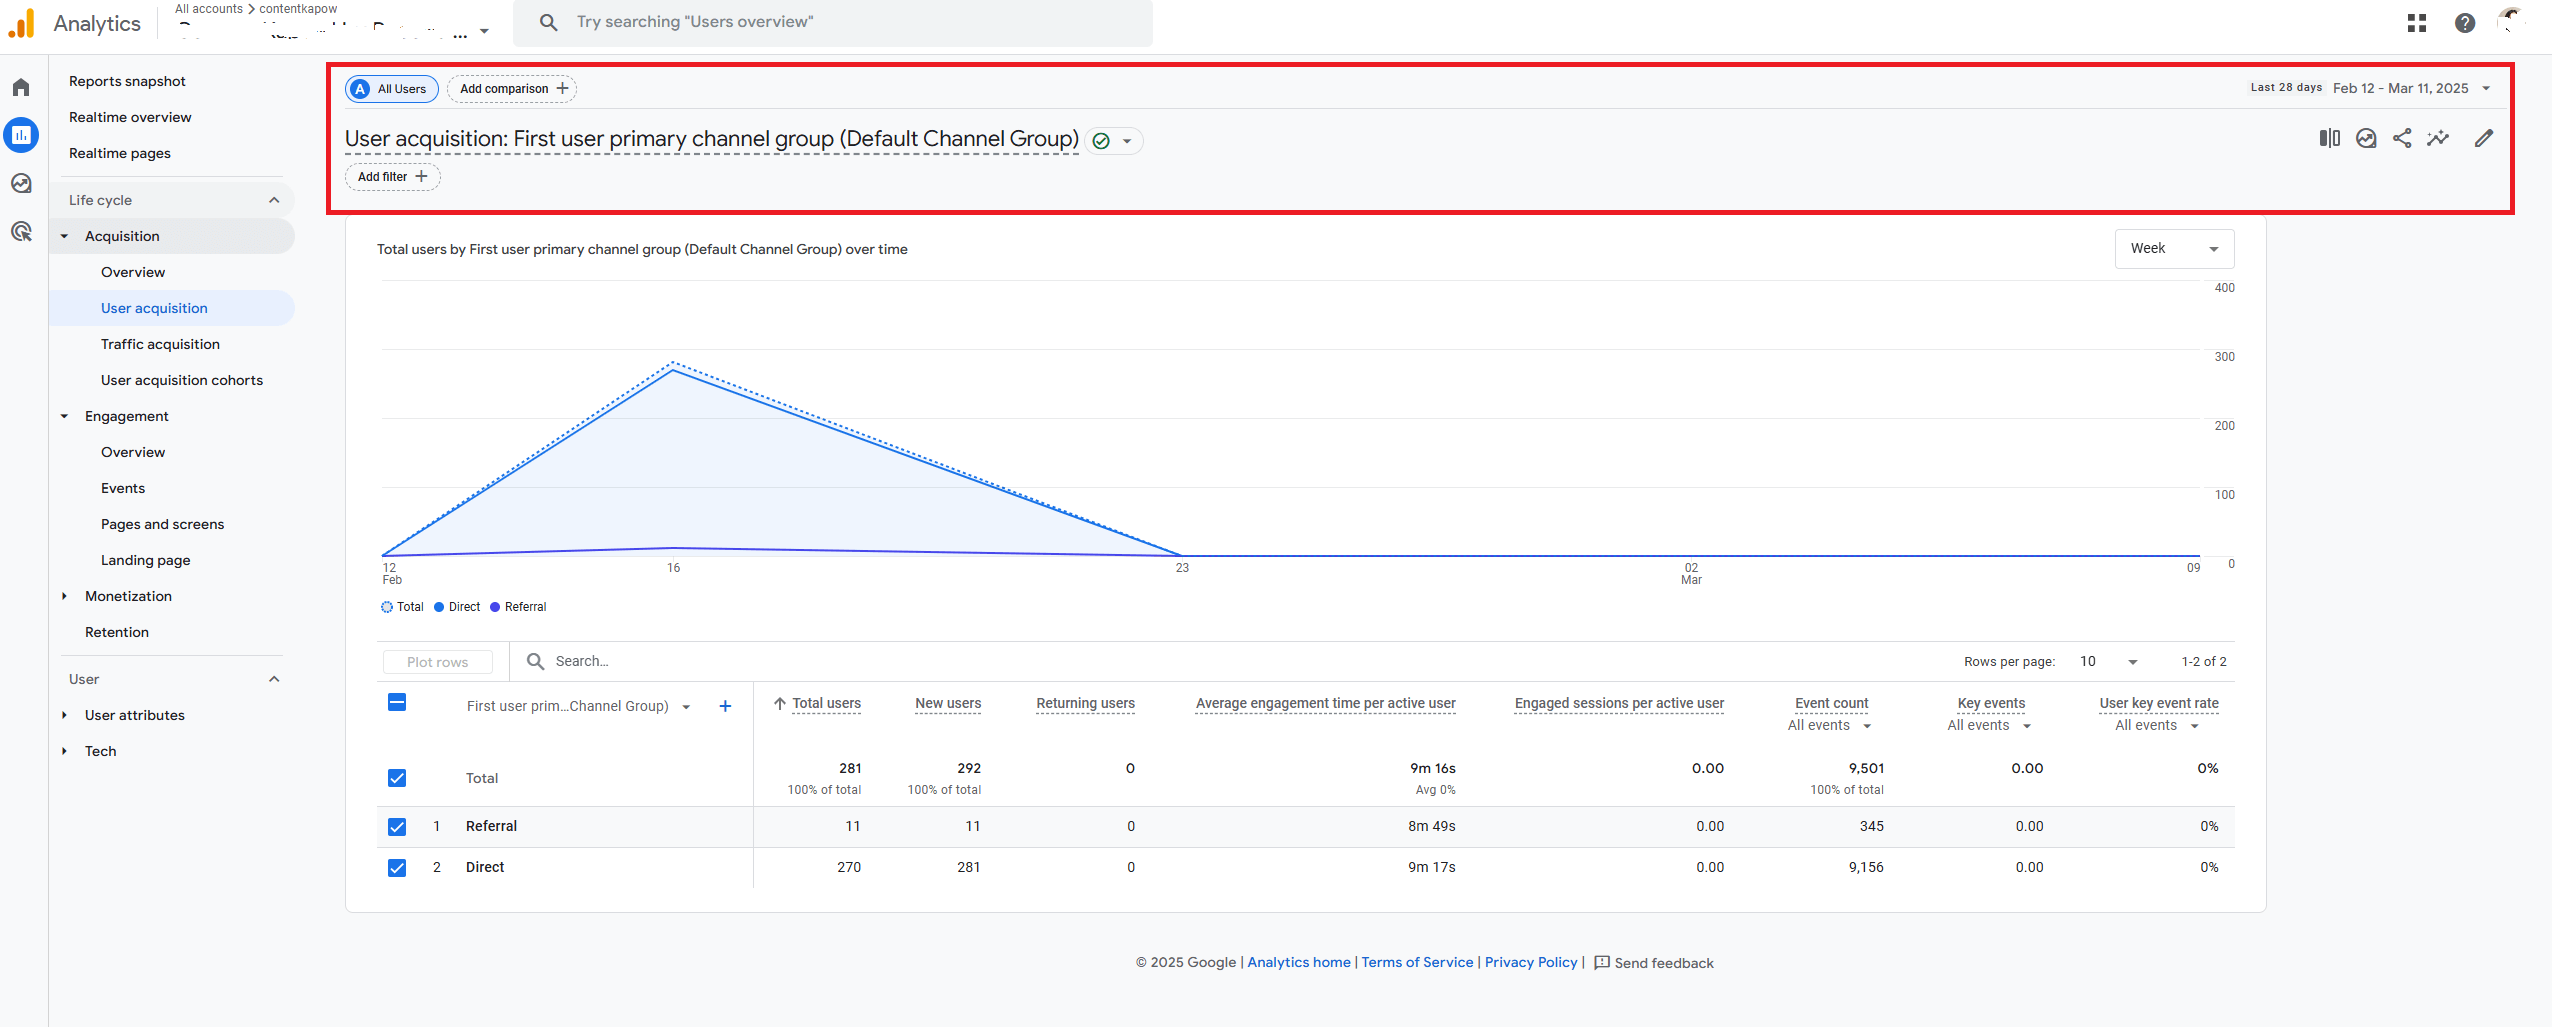
Step 3: Customize your report (optional)
Adjust the date range, segments, and filters accordingly.
If you want to further customize your report to highlight specific data points, click the pencil icon on the top right.
Here, you can add, remove, or reorder the metrics and dimensions. You can also modify (or hide) your charts here.
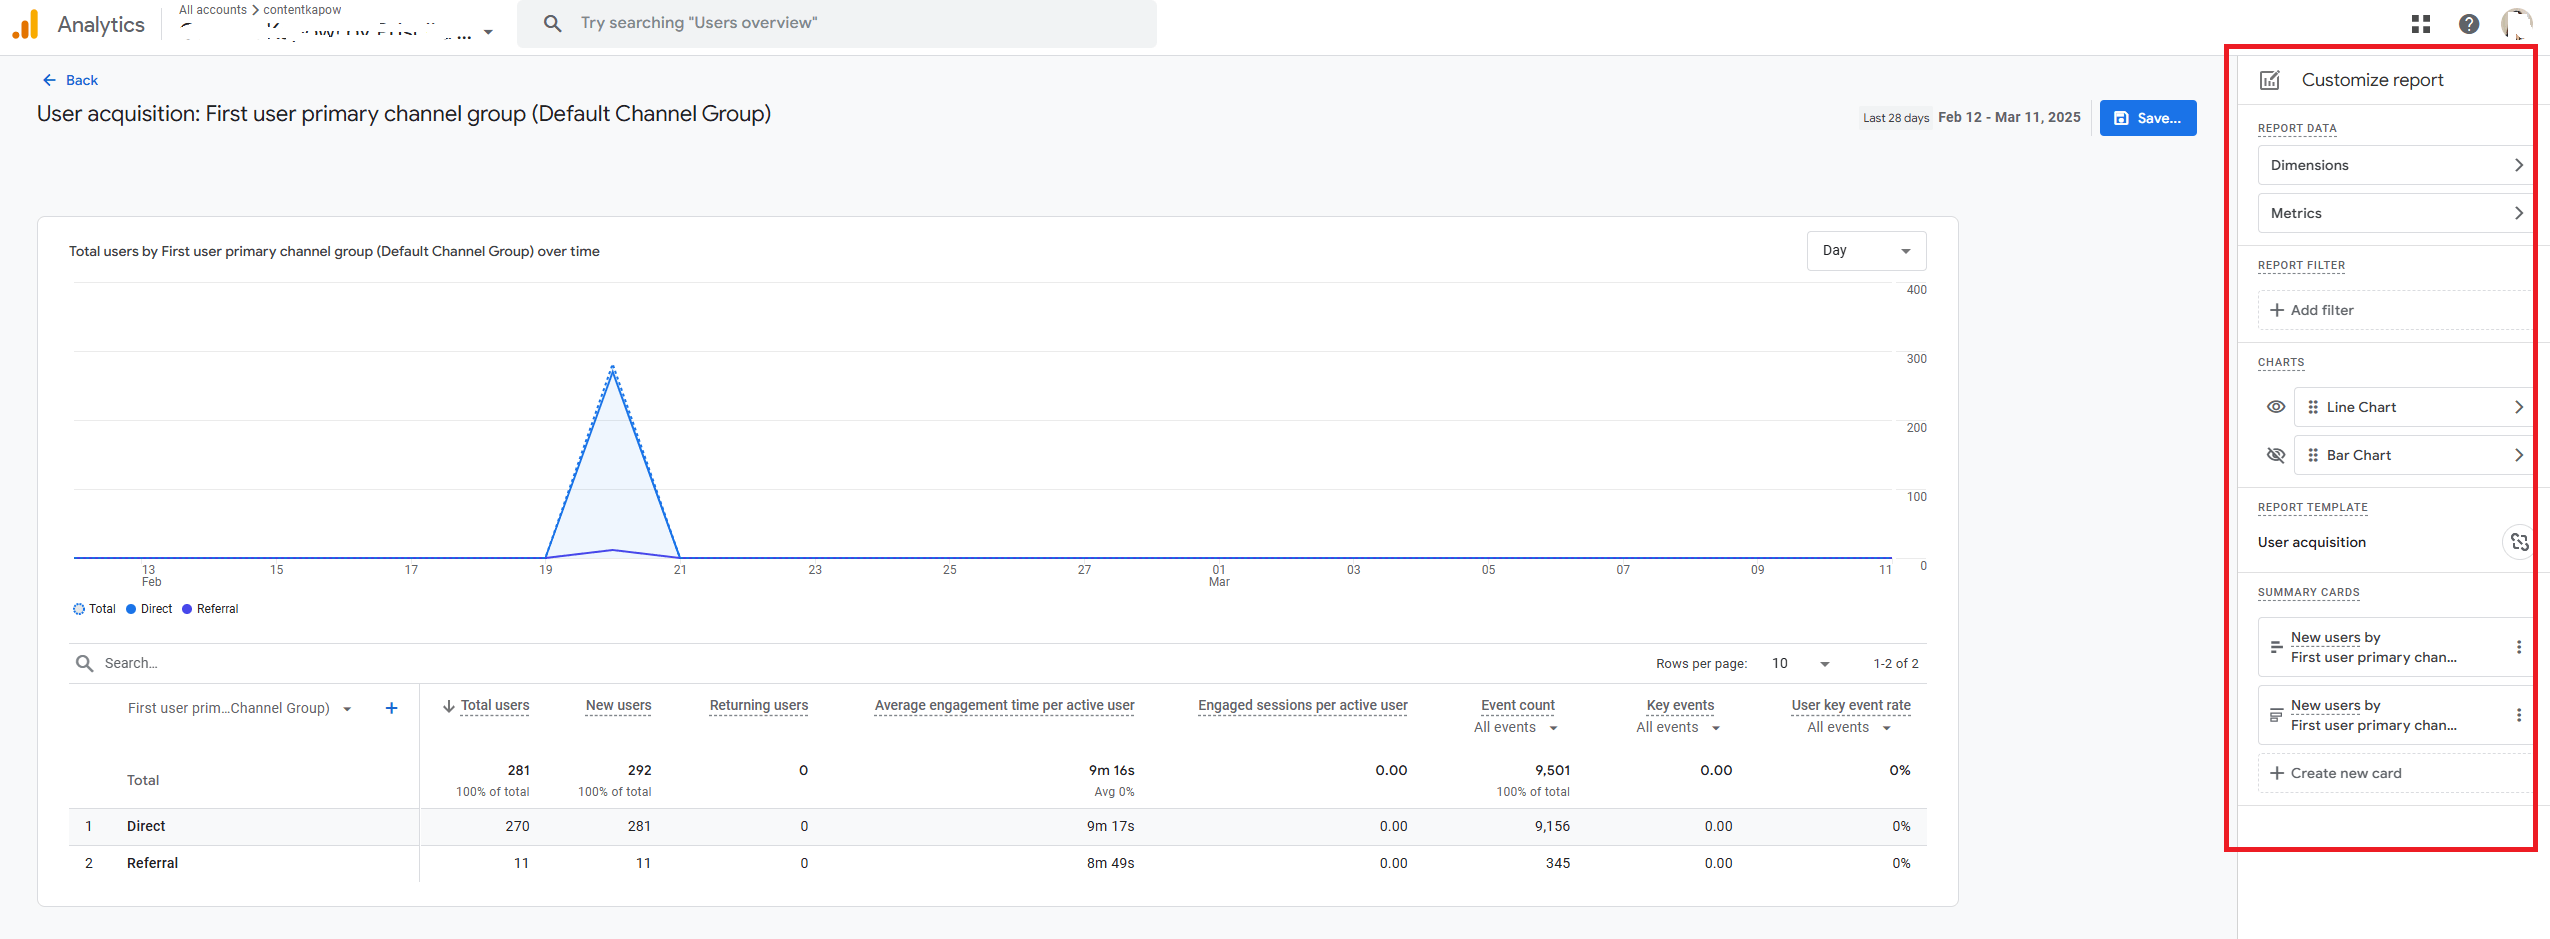
Click Save.
Then click ⬅️ Back (top left) to return to your report.
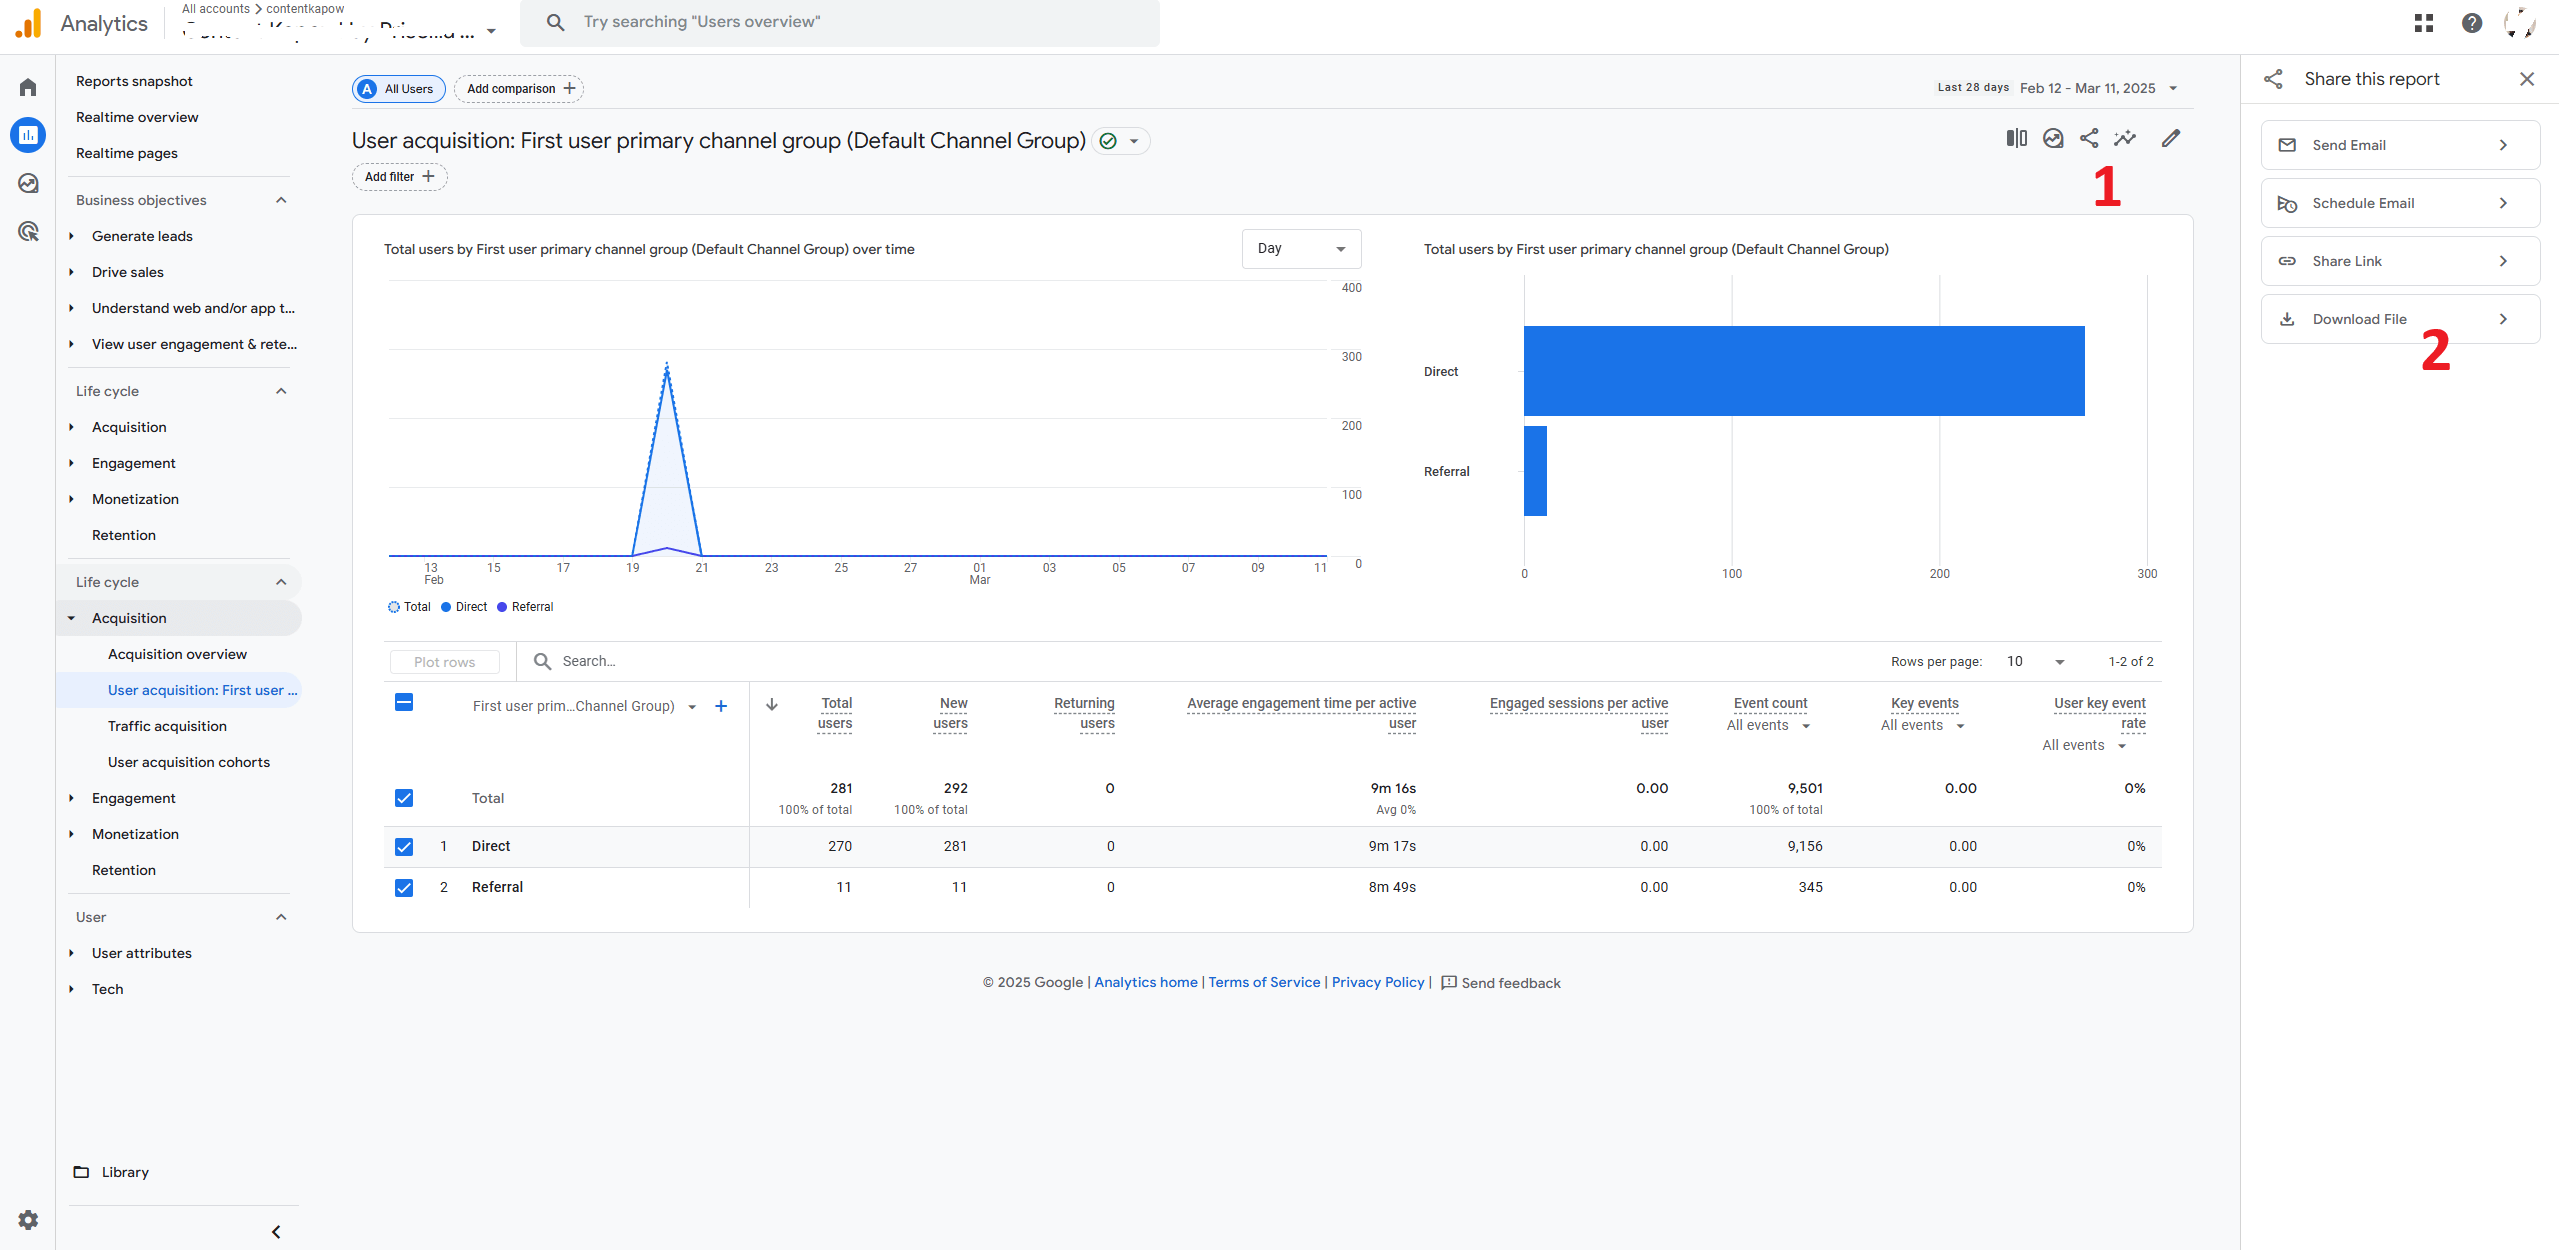
Step 4: Export the report
In the top right corner, click the Share this report icon > Download File > Download PDF.
Here, you can also download it as a CSV file or export to Google Sheets.
Step 5: Share your PDF downloads
Now that the PDF report is downloaded, you can either upload it to your team communication platform or print it for meetings.
The Limitations of Google Analytics' Built-In PDF Reports
While Google Analytics excels in affordability and in-depth data, its reporting process and customization options leave much to be desired. Here's a deeper look.
Restrictions that result in time-consuming manual process
One quirk of Google Analytics reporting is its 12-metric restriction. With only 12 metrics allowed in a report, you risk missing deeper insights into your digital marketing performance.
Sure, you can use multiple reports, each focusing on different sets of metrics to cover all relevant KPIs, but this manual process eats up a lot of time.
You need a better solution, like one that lets you add all relevant KPIs and metrics — with no restrictions.
Lack of customization
A quick search reveals users lamenting the inability to customize their Google Analytics reports, specifically the lack of:
- Custom annotations. Unlike Universal Analytics that allowed users to add timeline notes, this feature is missing in GA4.
- Branding. Currently, it's impossible to add a logo or custom color theme directly in the dashboards. While it matters little for in-house reporting, it's different for agencies that want to create a memorable client experience.
To bypass these limitations, consider using a third-party automated reporting tool like DashThis.
Introducing DashThis: Automate Your Google Analytics PDF Reports
DashThis is the easiest automated reporting tool.
Thanks to our native integration, you can automatically gather your entire data from multiple Google Analytics accounts and sources into one report.
There's no metrics or dimensions restriction. Fetch all your site performance, digital marketing strategies, and ecommerce data — all in one place.
Here's how automating a Google Analytics PDF report looks like on DashThis:
- Select a free report (note: DashThis offers 40+ free report templates)
- Connect your Google Analytics 4 account with DashThis
- Pick your KPIs or metrics in Preset Widgets
Wait a few seconds while DashThis collects data into your dashboard automatically. Drag and drop the metrics as desired.
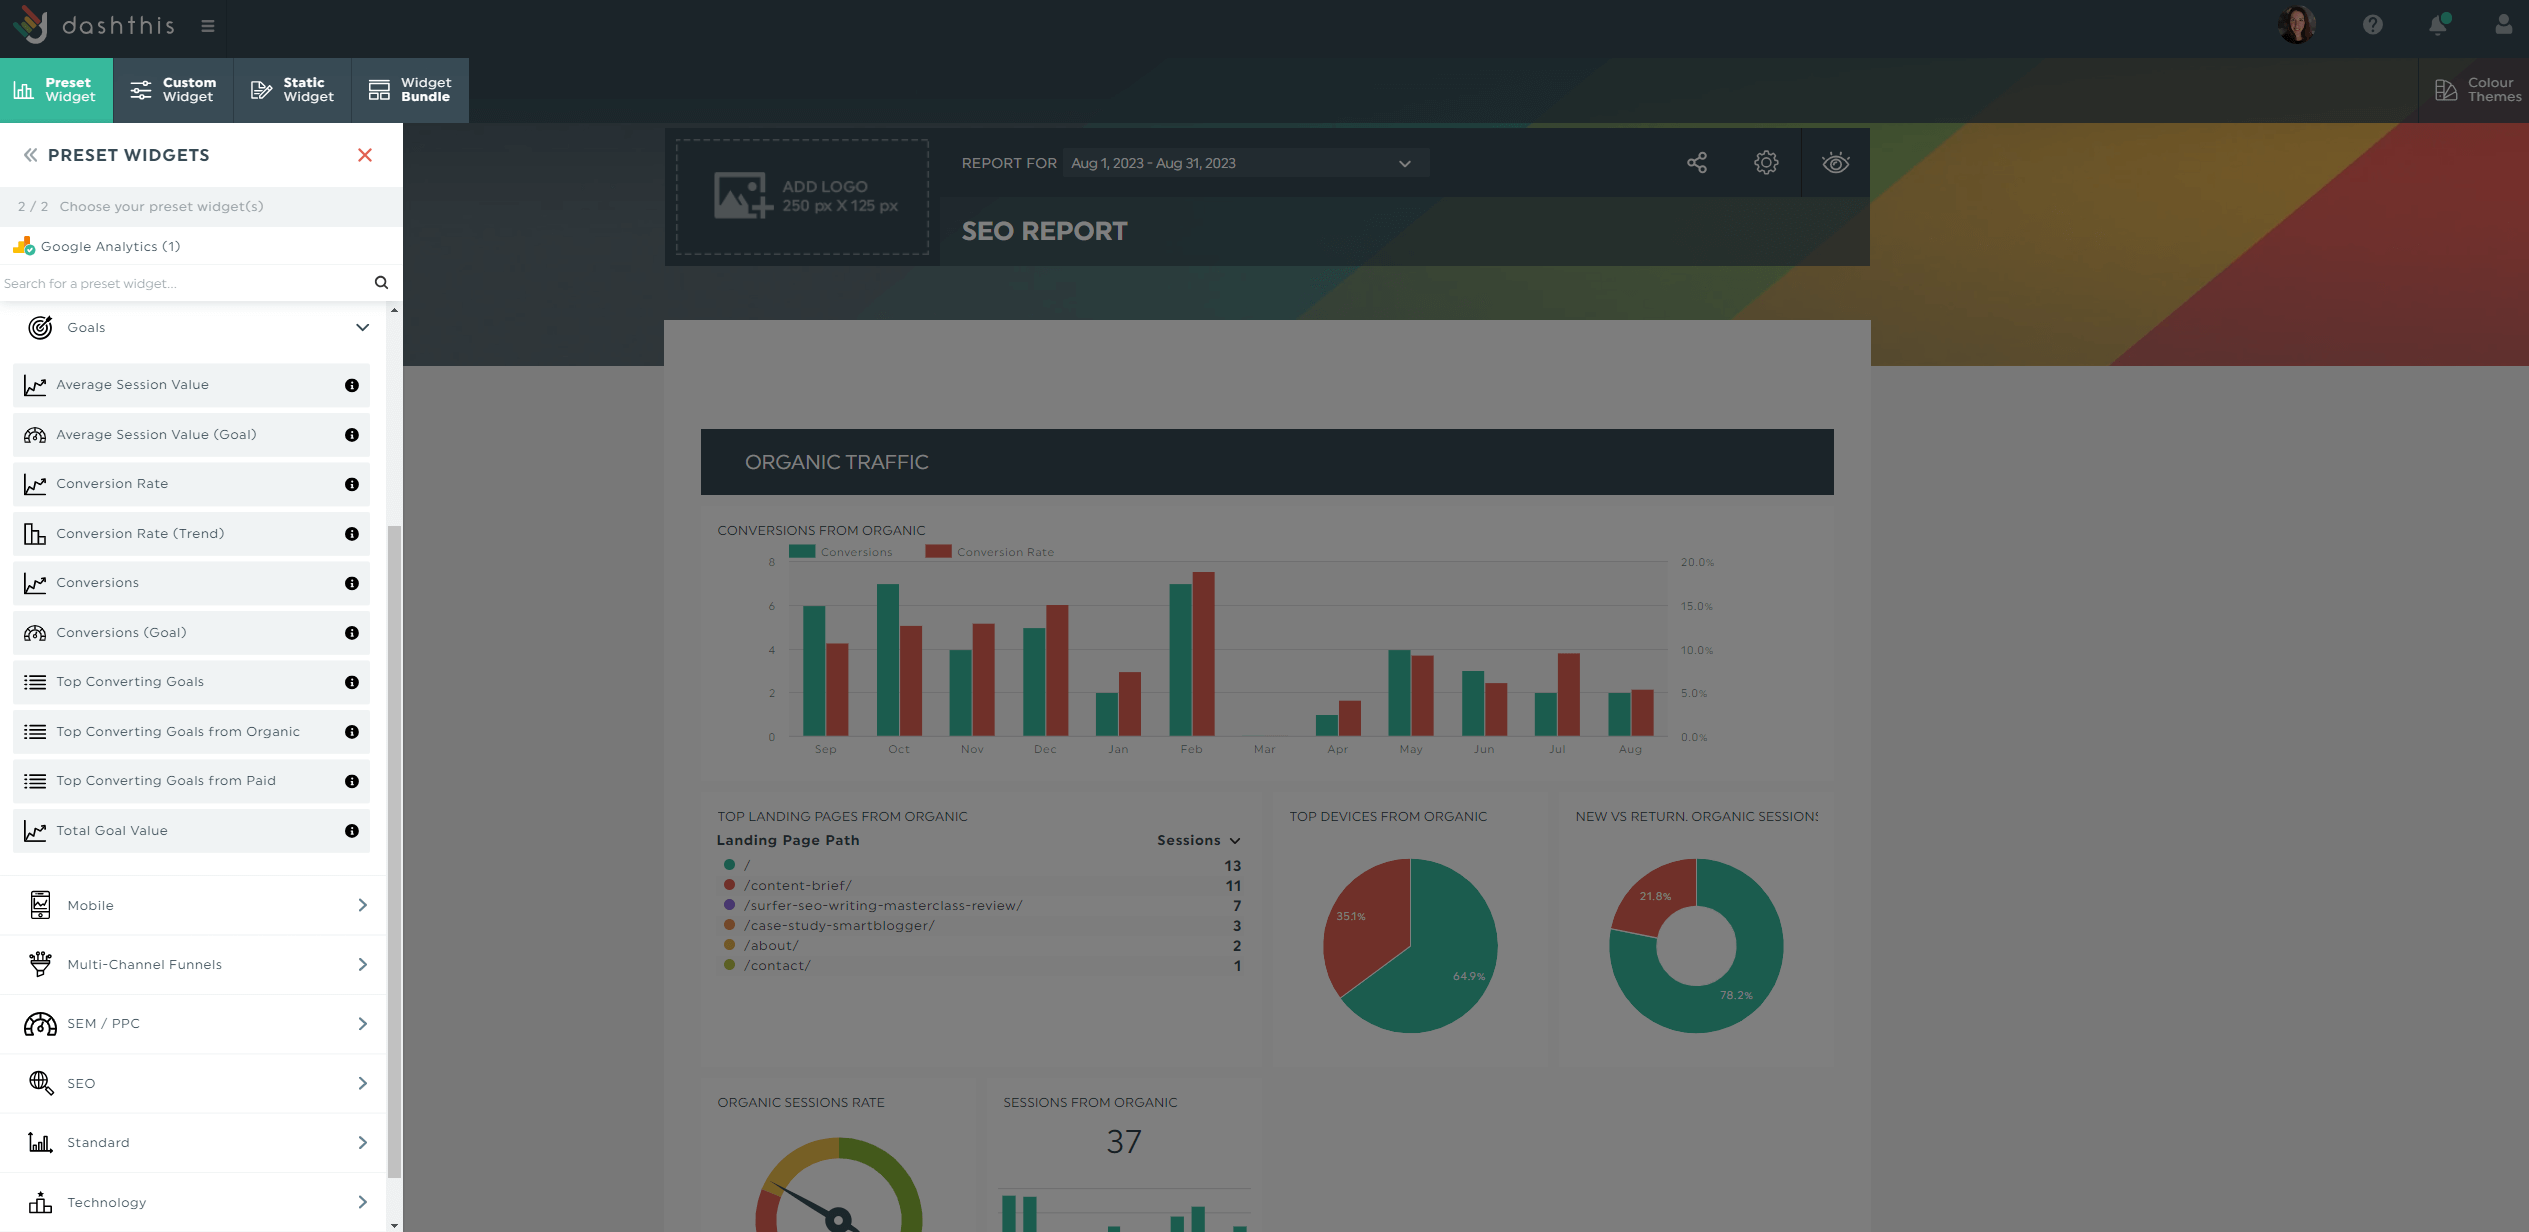
Customize the dashboard accordingly.
(i) ADD COMMENTS DIRECTLY IN REPORTS
Google Analytics 4 reports currently lack built-in annotations (though there are workarounds like third-party plugins, Looker Studio).
Fortunately, DashThis offers a similar feature.
Click Static Widget > Comment to add observations, suggestions, or the next recommended steps. For example, here's how to explain how a specific event (e.g., new PPC campaign) impacted traffic and conversions and how you plan to move forward.
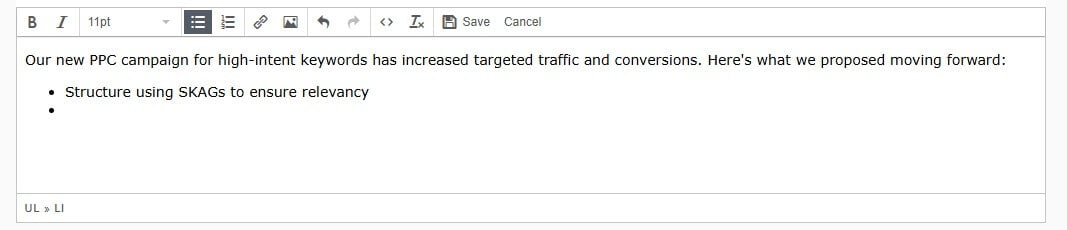
Click Save when you’re done.
(ii) SPOTLIGHT YOUR BRAND
Click Colour Themes > Preset Themes to choose a color set that reflects your brand the most. Alternatively, upgrade to the Professional plan to add your brand colors.
You can even pick the colors for the graph fluctuations.
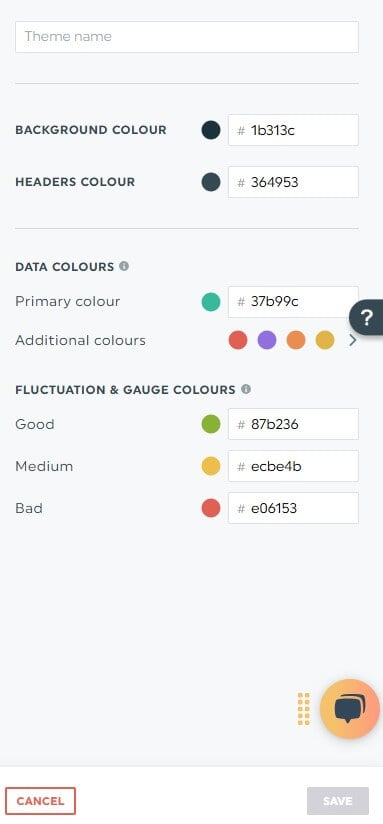
Click Save.
(iii) EXPORT AS A PDF
To export your report as a PDF format, complete these steps:
- Click the Sharing options icon
- Select Export as PDF
- Edit the file name
- Click Export PDF
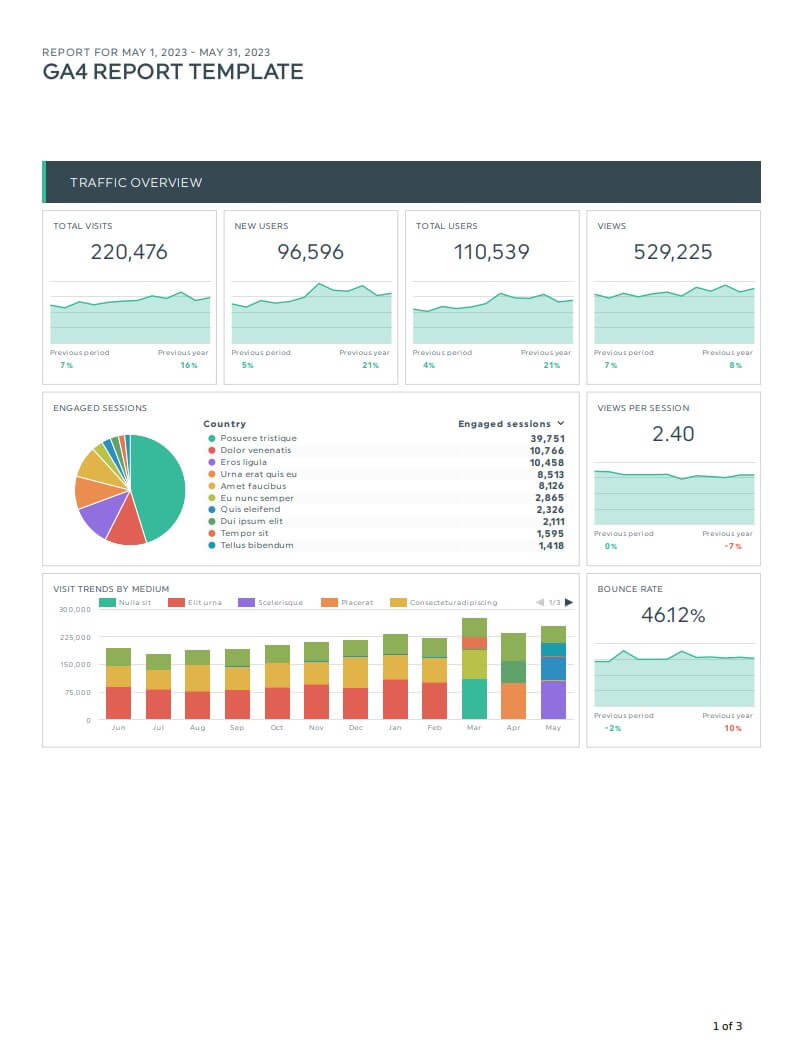
You'll get an aesthetically pleasing report like this.
BONUS TIPS: SAVE TIME WITH CLONING, AUTOMATED EMAIL DELIVERY & MORE
As mentioned earlier, there's no limit to the number of metrics and dimensions you can add to your dashboard.
Whether it's standard reports or "combo" reports — like a social media PDF report and SEO PDF report — you can add as many data sets as you want.
To reuse your report for future campaigns, clone it.
Go to the Dashboard Manager and locate the report to clone. Click the menu icon > Clone.
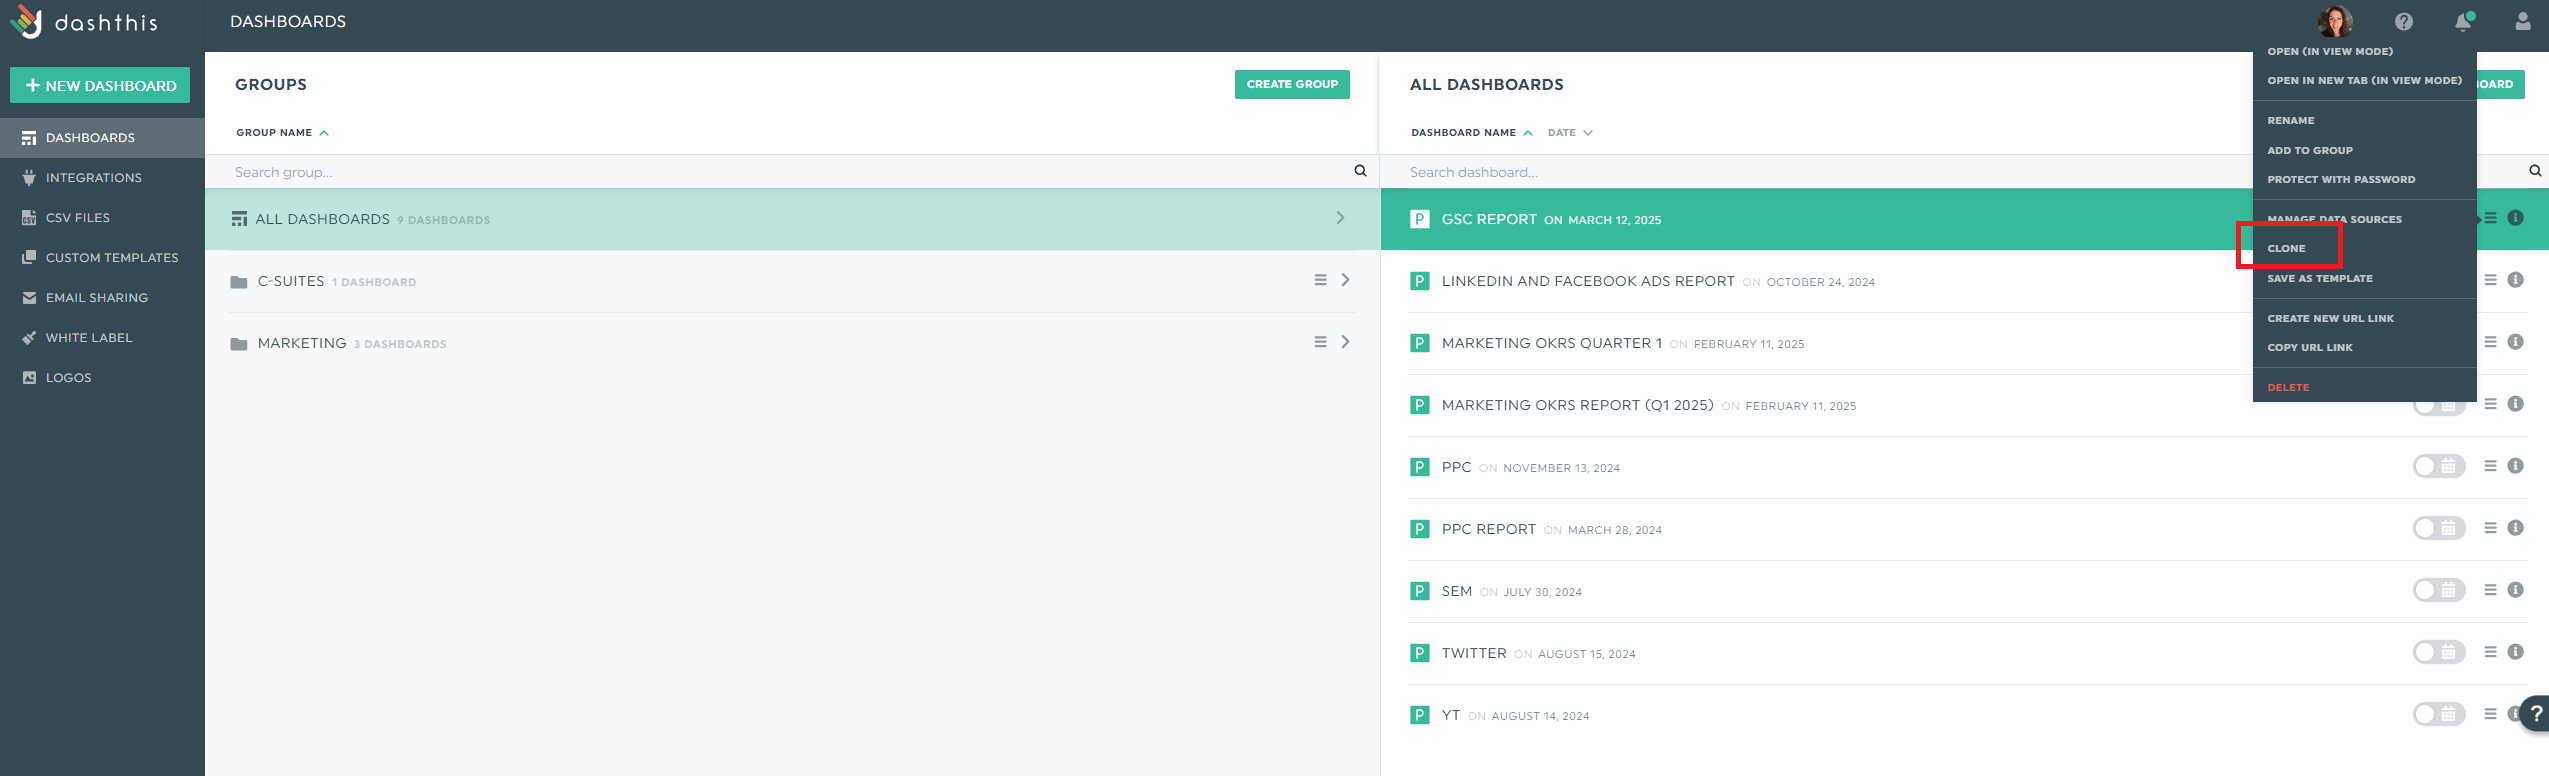
Select the data source(s) and preferences (e.g., time period) and add an optional password.
The cloned report will have the same title, logo, and widgets (including metrics) in the same place. The only things not cloned are comment boxes and custom color themes.
DashThis Tip: If you're using the same report for all clients, save it as a custom template instead.
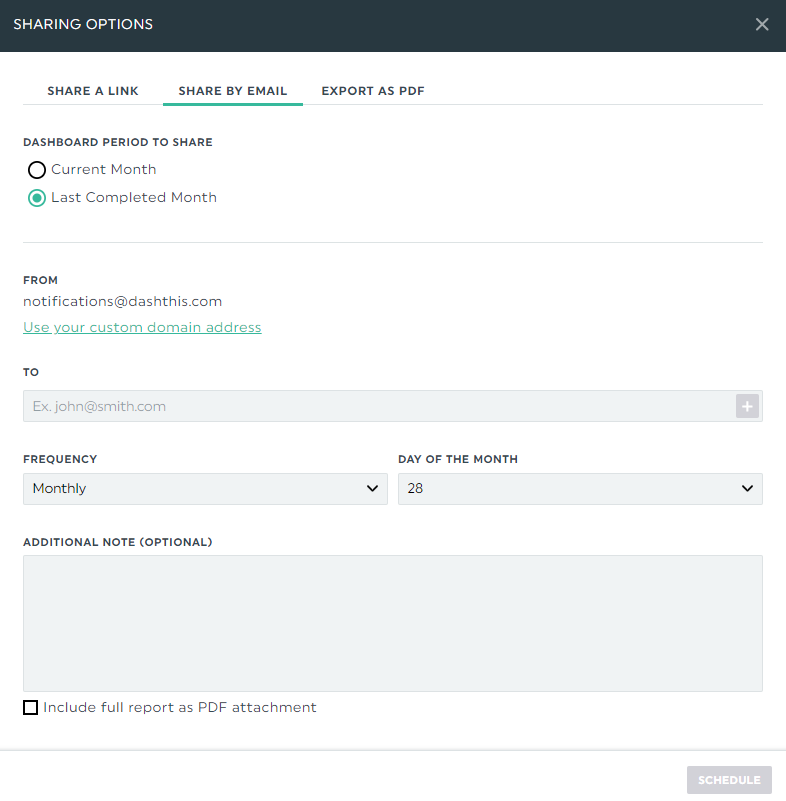
You can also schedule an automatic email dispatch. Here's how it works:
- Hover over the Sharing Options icon in the top right
- Click Share by Email
- Set the dashboard period and frequency
- Add an optional note
- Click Schedule
And voilà, you can now send your report on a pre-determined schedule. Anyone who receives it can view it in real-time.
Automate Your Google Analytics Reporting Today
It's fairly straightforward to export your report directly from Google Analytics.
But that doesn't mean it's perfect.
If you're frustrated by the lack of customization or time-consuming process, switch to the easiest automated reporting tool, DashThis.
Automatically gather your entire Google Analytics data (including Google Ads performance and ecommerce data) from multiple accounts and sources into one report.
Start your free 15-day trial today.

Ready to automate your Google Analytics reports with Dashthis?
Read More

Don’t miss out!
Follow us on social media to stay tuned!
Automate your reports!
Bring all your marketing data into one automated report.
Try dashthis for free