How to build a marketing report like a boss: our account managers’ secrets

A couple of weeks ago, I moved office: I entered the account managers’ kingdom. Once I got here, I quickly realized that all the account managers tend to answer the same questions. And these questions, most of the time, are not about super technical topics, no. These questions are about how to bring a client’s report to the next level. ‘Cause most people can build a marketing report, but our account managers are the ones who can show you how to do it like a boss. I’ve gathered some of their tips and tricks so you too can become a reporting boss!
Get a ROI for your time
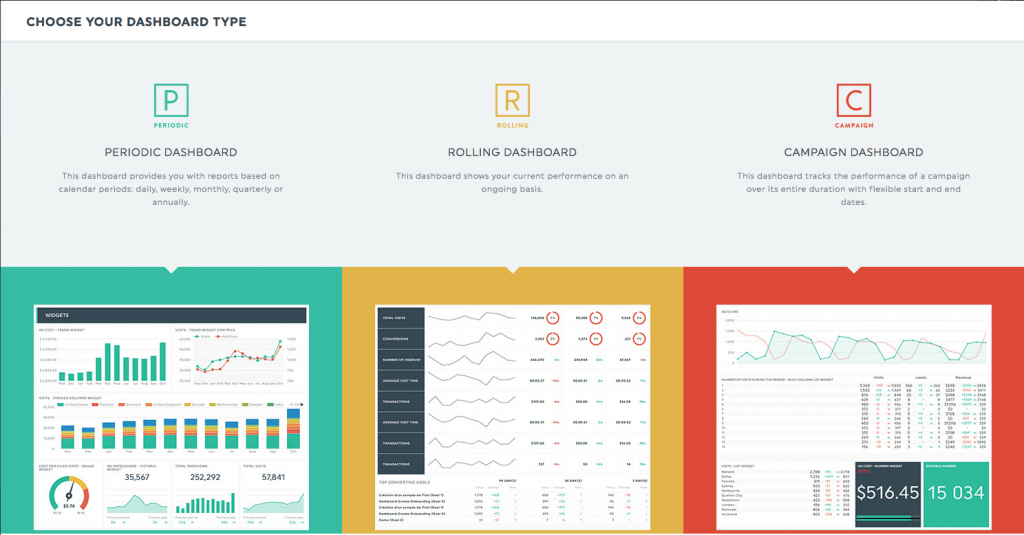
When you first arrive in the app, you find yourself with many different options: three types of reports (each of them with different date ranges), nine types of custom widgets, a myriad of preset widgets and preset templates… it’s like a reporting buffet!
In order to get the most out of the tool, Paul, the dean of the department, strongly advises you to spend some time discovering all your options. Go create the three types of dashboards with the same metrics to see how they look, create every kind of widget to know what they are and how you can customize them. You might spend 20 or 30 minutes trying everything, but you’ll know exactly what to look for when the time comes. These first moments in the app, if spent wisely, will significantly improve the quality of your reports and save you valuable time in the long run.
Show what really matters
With the wide selection of metrics and dimensions, it’s easy to become overwhelmed and lose focus. If this happens, remember these two words from your reporting buddies at DashThis:
ROI and growth.
Both ROI and growth are what your client wants to know first: how much is (s)he making from what (s)he spent? And how can (s)he observe the improvement related to his/her business objectives? According to our reporting rockstars, these two things are what you need to show first in your report.
So before you even start building your digital marketing report, define your goals. Once the metrics and dimensions related to your ROI and growth are done and clearly displayed, you can show something else.
Your client = your first priority
While you might be comfortable with most metrics, and the analytics world in general, your client may not be. And this brings us to one of the tips that our account managers repeat the most: the report isn’t for you, it’s for your client. It’s all about your client.
Keep your report straight to the point with data that (s)he will understand. It’s easy to pile widget on top of widget, because there are so many ways you can show your good work to your client! However, too much data will probably overwhelm him/her, and you certainly don’t want that. So here’s how our account managers suggest you proceed: When selecting a metric, always ask yourself, “is this data relevant for my client? Is (s)he going to easily understand this number?” In the case that the data is crucial but maybe a bit complicated, don’t hesitate to add explanations in your report.
Marie-Claude actually put this idea in a brilliant way: “your report isn’t about analytics, it’s about showing how your work is profitable to your client.” She’s so right. After all, if your client doesn’t look at your report or doesn’t understand it, it’s useless. Make your marketing efforts count! And if that happens, you don’t shine. So you should show less, so that your client reads more. Listen to Marie-Claude, she knows what she’s talking about!
Aaall the integrations in your marketing report!
There’s one tip which Gabriel focuses on a lot: whenever applicable, add multiple data sources to your report. He tends to repeat this pretty often to his clients, because this little trick really brings their report to the next level.
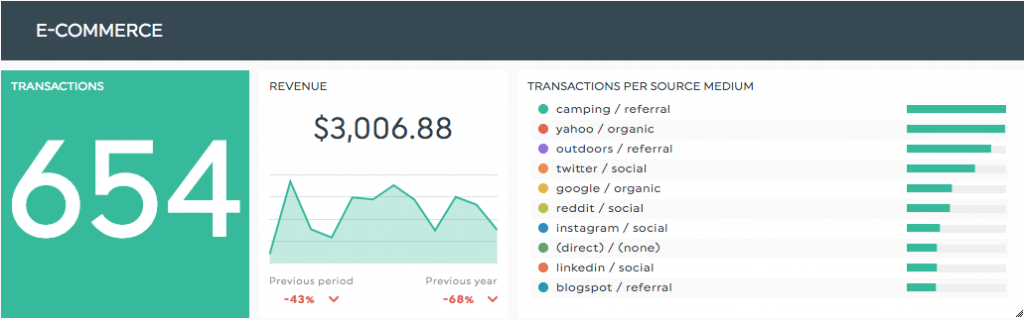
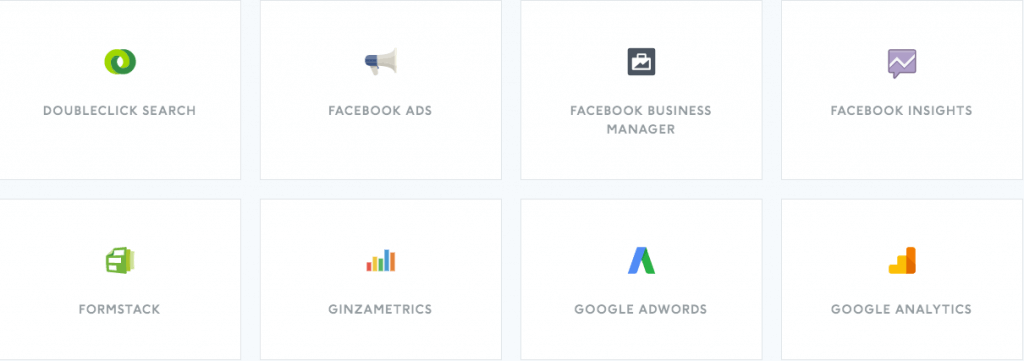
You can either connect multiple integrations during the creation process of your digital marketing report or add them afterwards, it’s up to you! What matters is that you create a comprehensive report. You can, for example, create one widget with Google Analytics data to show the increase of your organic traffic and a second one with Moz data showing the keywords used by this same traffic.
Gabriel sees (too) many users using only one data source per report, which really isn’t taking full advantage of what DashThis has to offer. So connect all the data sources you need in one report. This way, not only do you get the big picture, but so does your client. THIS is how a boss creates a marketing report.
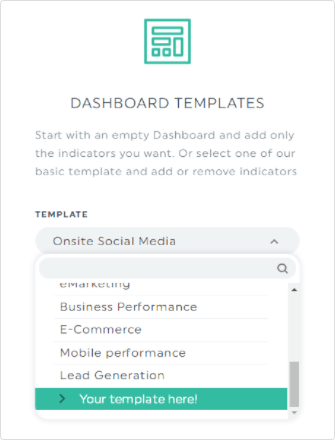
One template to rule all your reports
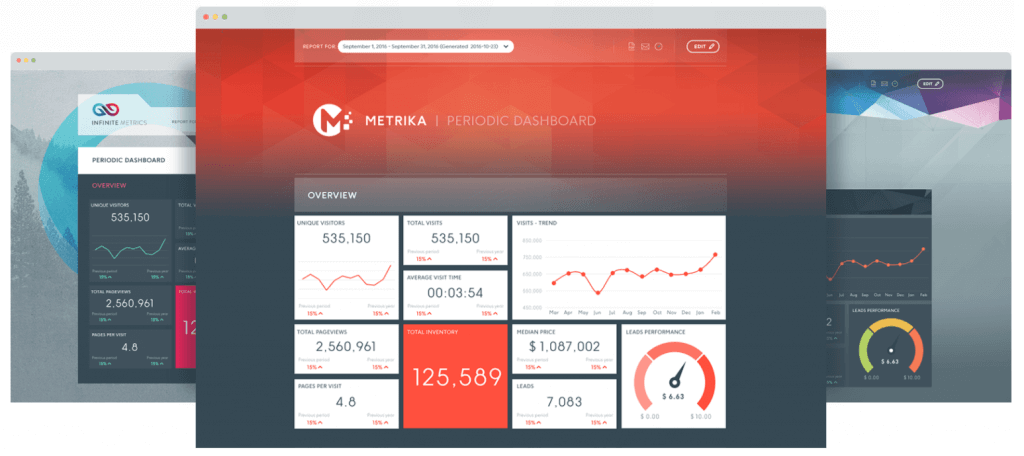
Paul is all about wisely investing your time in the right places and with the right priorities. First, he advised you to spend time getting to know the tool before creating your first report. Now, he’s also strongly suggesting that you take the necessary time to create a perfect first marketing report if you have clients with similar needs. Why? Because you can create a template out of it.
If you want to show similar KPIs to many of your clients, take the time to create a killer first report and once it’s all done, contact our support to have a template out of it. Then, when it comes time to create another report for a client with similar needs, you can just choose this same template, connect the new client’s data sources, and you’re done! The widgets and the overall layout will already be set up. You can have automated marketing reports whenever you need them.
So take your time now to save it later. What a wise man!
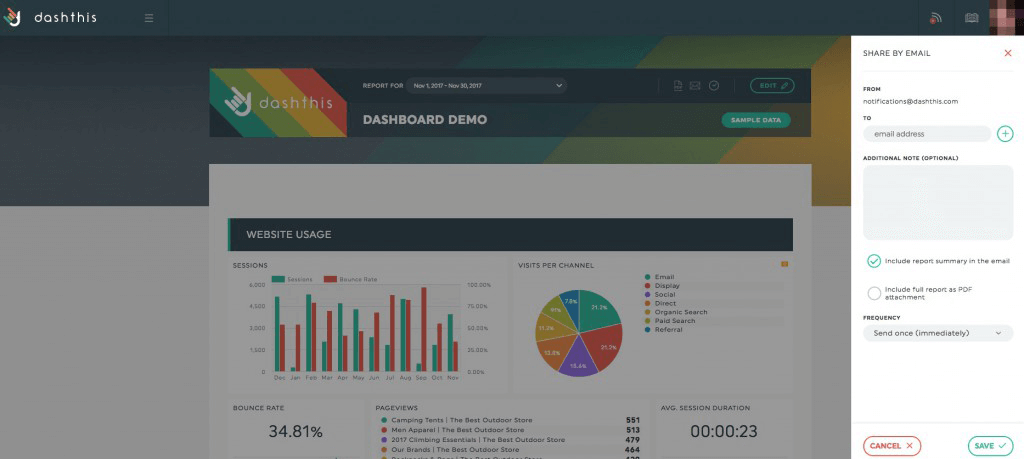
Web version for the win!
You’re all about creating an interactive report? Laury’s got a special tip for you: when sharing your report, don’t limit yourself to the PDF, use the web version!
Why, you ask? Because it’s more dynamic! In the web version, which is viewing the dashboard directly in the app, your client can really interact with your report: (s)he can hover over the widgets to get more accurate information, read notes you’ve left in there, and just be more active and therefore, compelled by it. To share the web version, you can either create a URL link in the dashboard menu and share it, or use the Share by email function in the Viewer mode.
Of course, you can share a PDF version of your report anytime; maybe your client wants to keep the report in his/her folders. But you shouldn’t stop there! Take advantage of everything DashThis has to offer by sharing the web version as well!
You should try it, if you haven’t already; Laury’s convinced that your client will love it! Web version for the win, as she said!
They don’t bite
“Don’t forget to write that we’re nice and we’re always happy to talk with our users,” said every single account manager at DashThis.
If you’re ever in doubt, don’t hesitate to contact them; they’re your reporting partners, after all. For real, they don’t bite, they’re all lovely (and I spend all day, every day with them. I know.). Whatever questions or comments you might have, they’ll find a way to make sure you have what you need. You might also get a hilarious GIF as a bonus; they have an impressive collection.
I mean, look at them. Aren’t you under their spell already?
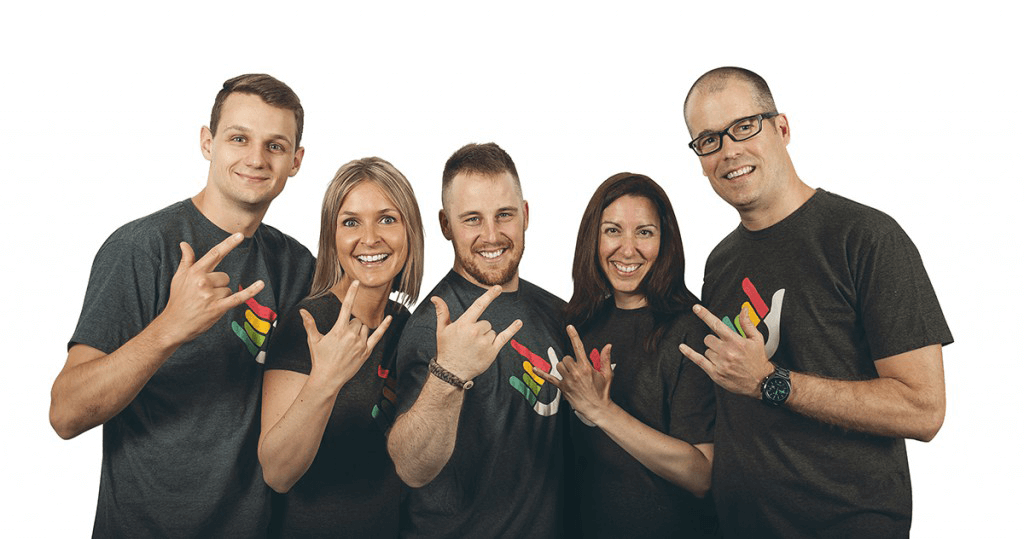
From left to right: Philippe, Laury, Gabriel, Marie-Claude, and Paul. What a team!

Ready to automate your reporting?
Read More

Don’t miss out!
Follow us on social media to stay tuned!
Automate your reports!
Bring all your marketing data into one automated report.
Try dashthis for free