Marketing Insight Reports: Build Smarter Client Reports with AI-Powered Analysis

Table of contents
- Introduction
- What is a marketing insight report?
- Why do marketing insight reports matter?
- Key elements of an effective marketing insight report
- How to build an effective marketing insight report in DashThis
- Automate your marketing insight reports with DashThis
Introduction
Marketing insight reports transform scattered metrics into focused recommendations, but creating them manually for multiple clients each week is time-consuming and tedious.
HubSpot research confirms this challenge. Just one in five marketers reports that their marketing data is fully integrated, but 30% say their various marketing tools don’t work well together.
Artificial intelligence (AI) -powered reports solve this mess by pulling everything together automatically and spotting trends you might miss when jumping between platforms. No more wrestling with data, you can automate the analysis and focus on strategy instead.
This guide demonstrates how reporting tools like DashThis streamline reporting, while generative AI functionalities provide comprehensive insights, helping you to save time on reporting and deliver tangible client results.
What is a marketing insight report?
Marketing insight reports, also known as marketing reports or analytics performance reports, summarize key metrics for clients and serve as a valuable source of business intelligence. Each report focuses on specific aspects of its digital marketing results.
The most common report types are:
- Campaign reports focus on a specific initiative, like a summer sales email marketing push. You'll cover relevant metrics, such as open rates, click-through rates (CTR), overall email list engagement, and discuss content effectiveness and A/B testing results.
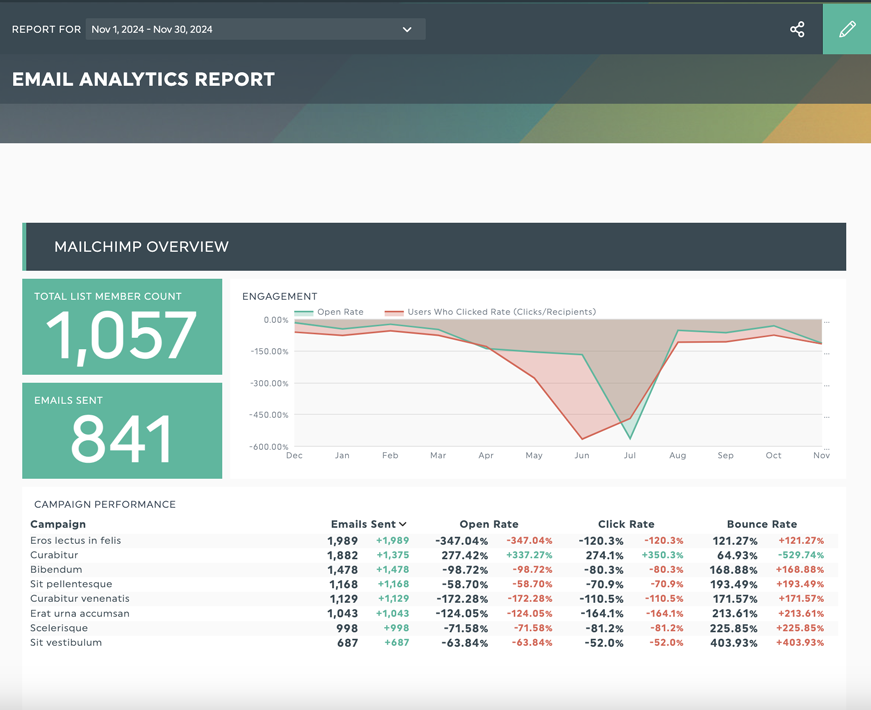
Get this email performance report template with your own data!
- Return on investment or attribution reports measure marketing ROI by comparing business returns against marketing costs. Understanding how different interactions influence conversions throughout the customer journey helps track the effectiveness of your conversion path.
- Cross-channel marketing reports consolidate marketing results from multiple channels, enabling you to compare performance, identify top performers, and allocate your budget more effectively.
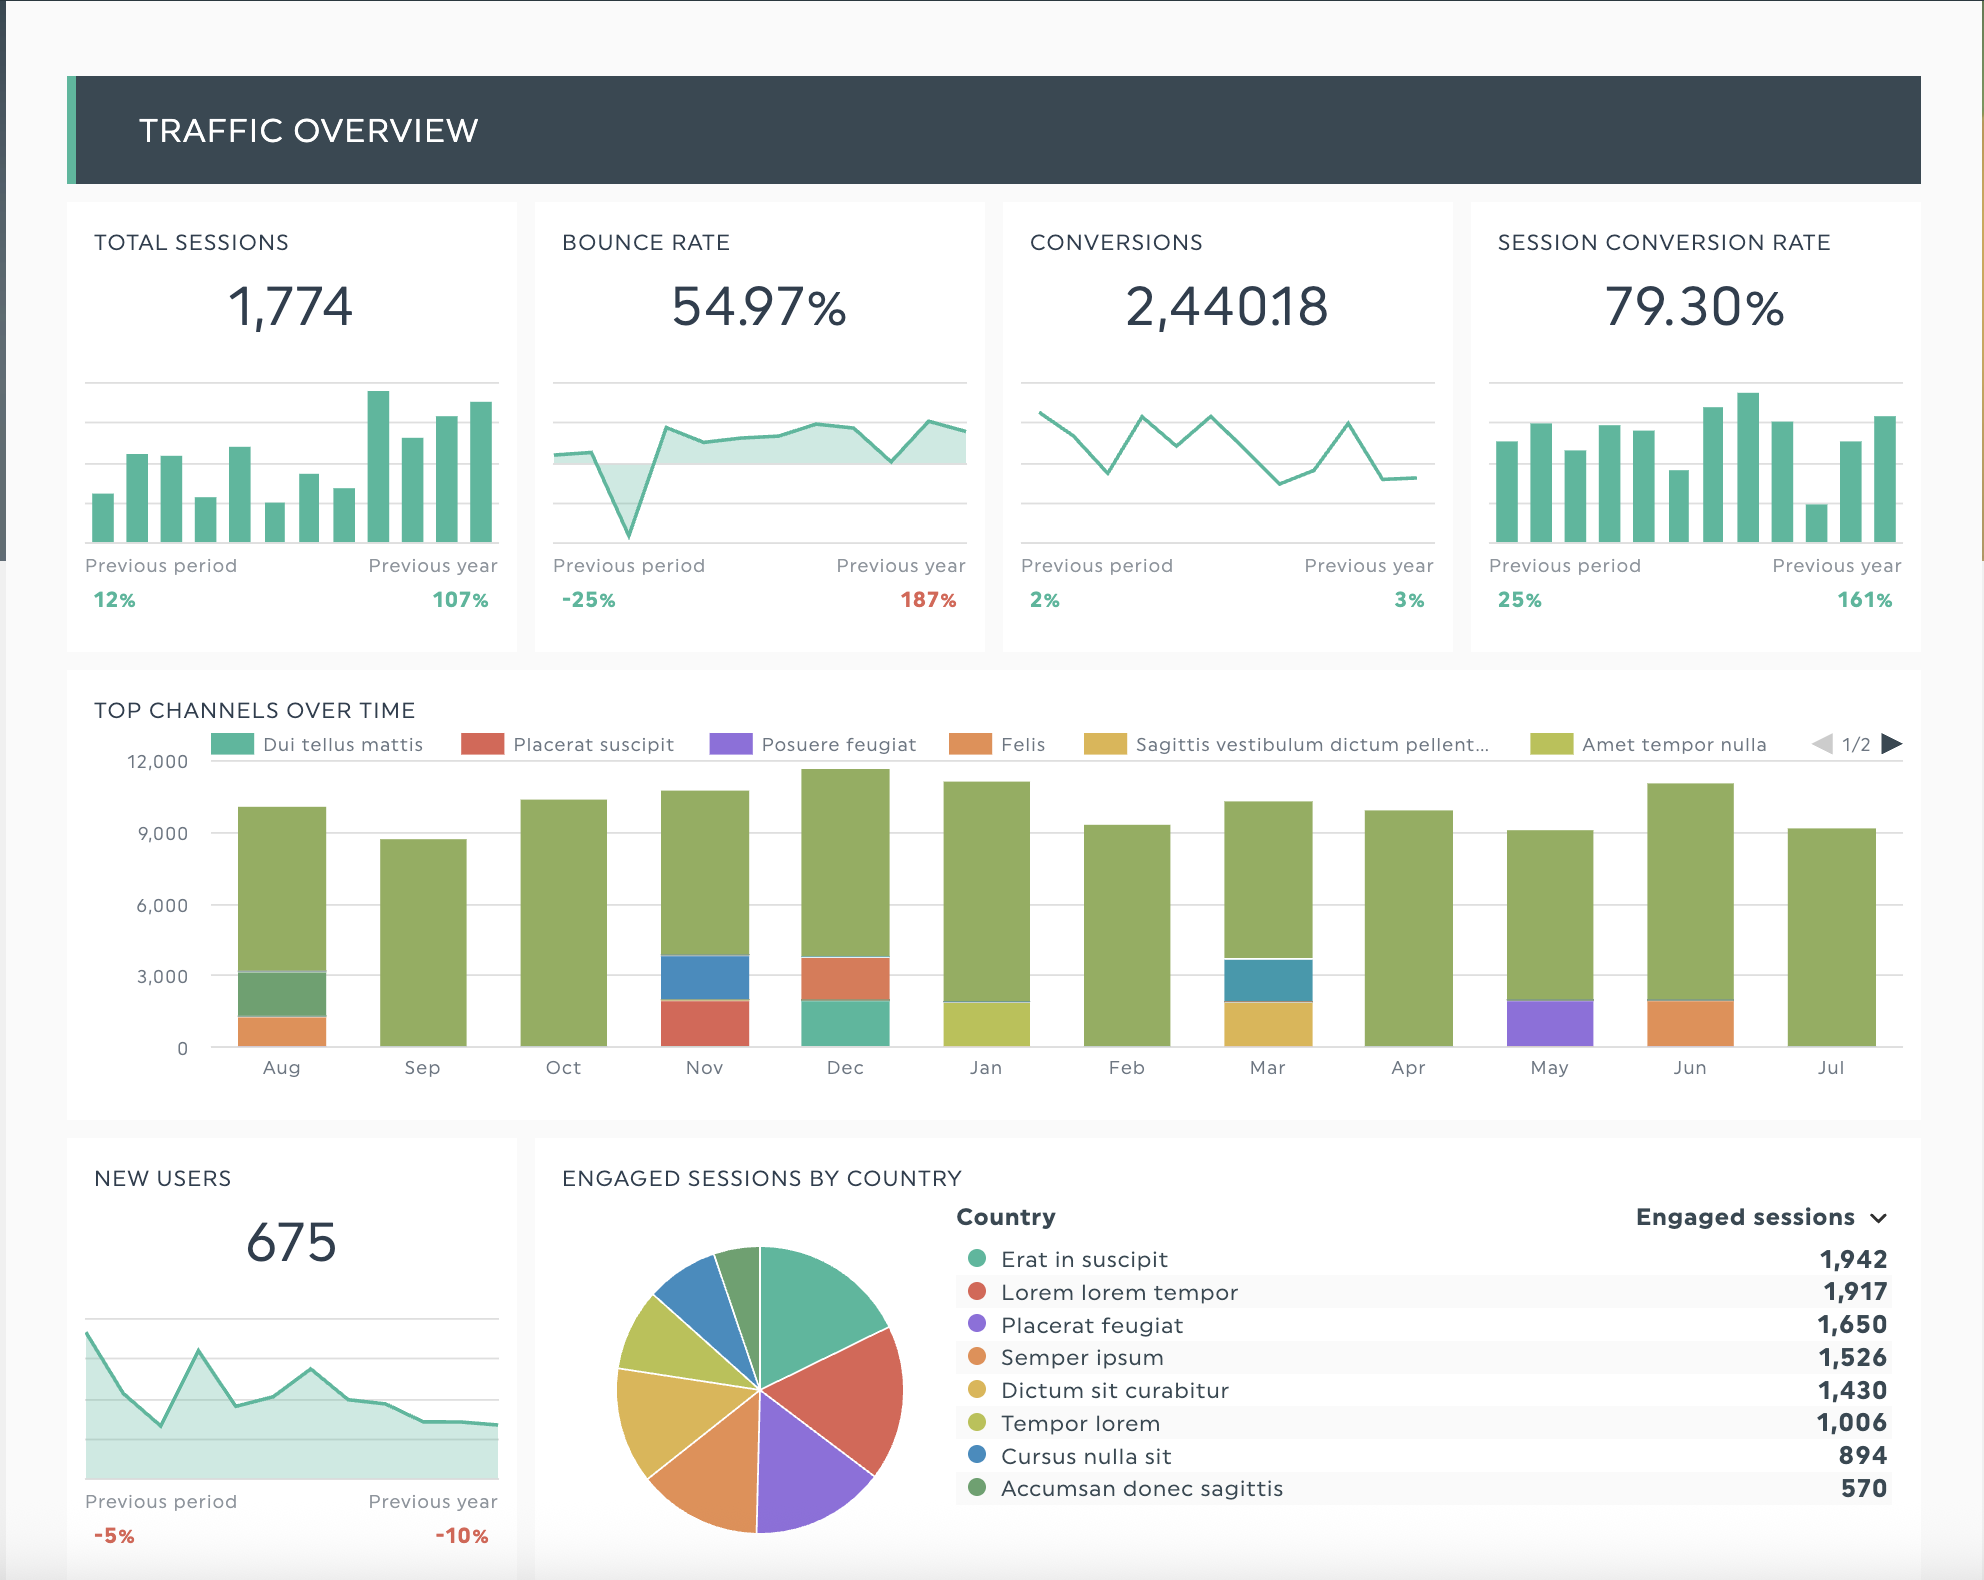
Get this digital marketing report template with your own data!
- Monthly or quarterly performance reports show results at set intervals and measure progress toward KPIs and campaign goals. Examples include weekly marketing updates for clients or quarterly internal marketing reviews.
All of these reports share a common goal: to help your clients understand what's working in their marketing and what they should do next. You're backing up those recommendations with in-depth data and your expertise.
Why do marketing insight reports matter?
Insight reports reveal more than raw data; they connect metrics to your client’s business and marketing goals through meaningful analysis. These reports help you:
- Explain performance and lay out recommendations and next steps: Show why your numbers changed and what to do next. Use data to support your recommendations, enabling clients to act with confidence.
- Demonstrate marketing ROI and gain stakeholder confidence: Clear results help clients get bigger budgets and approval for new strategies. DashThis customer, Jelly Marketing for example, relies on marketing reports to prove the need for their marketing budget based on specific and real results.
- Support data-driven decision making: When your complete marketing data set lives in one spot, it's easier to see what's working and what isn't. Your clients can make more informed decisions about where to allocate their budget, and everyone is clear about their objectives.
Key elements of an effective marketing insight report
Creating marketing insight reports doesn’t need to be a terrible process. Here’s a structure that can help organize your marketing insight reports for clients and turn them into a repeatable process for your clients.
1. Start with a clear goal and target audience
Before you touch any data, nail down who you're writing for and what they need to make a decision. This foundational step keeps your reports focused and ensures they don't end up ignored in someone's inbox.
Start by answering three key questions:
- Who will be reviewing this report?
- What decisions will they need to make based on this data?
- Which specific metrics matter most for those decisions?
Getting clarity on these answers early prevents wasted time by avoiding irrelevant metrics or excessive explanations for busy stakeholders.
For example, when crafting a content marketing report for a client's head of sales and SEO team, the head of sales requires conversion data to identify content that converts prospects into qualified leads. In contrast, the SEO team focuses on technical performance metrics, including search rankings and organic visibility.
2. Lead with an executive summary that summarizes the essential points
After identifying your audience’s needs, write a clear summary that busy readers can review in 30 seconds. Since this overview might be the only section some people read, focus on your key messages.
We recommend writing the executive summary after you’ve built the full report. That way, your summary matches up with your data, and you’ve done the analysis and thinking you need to do to explain your report accurately.
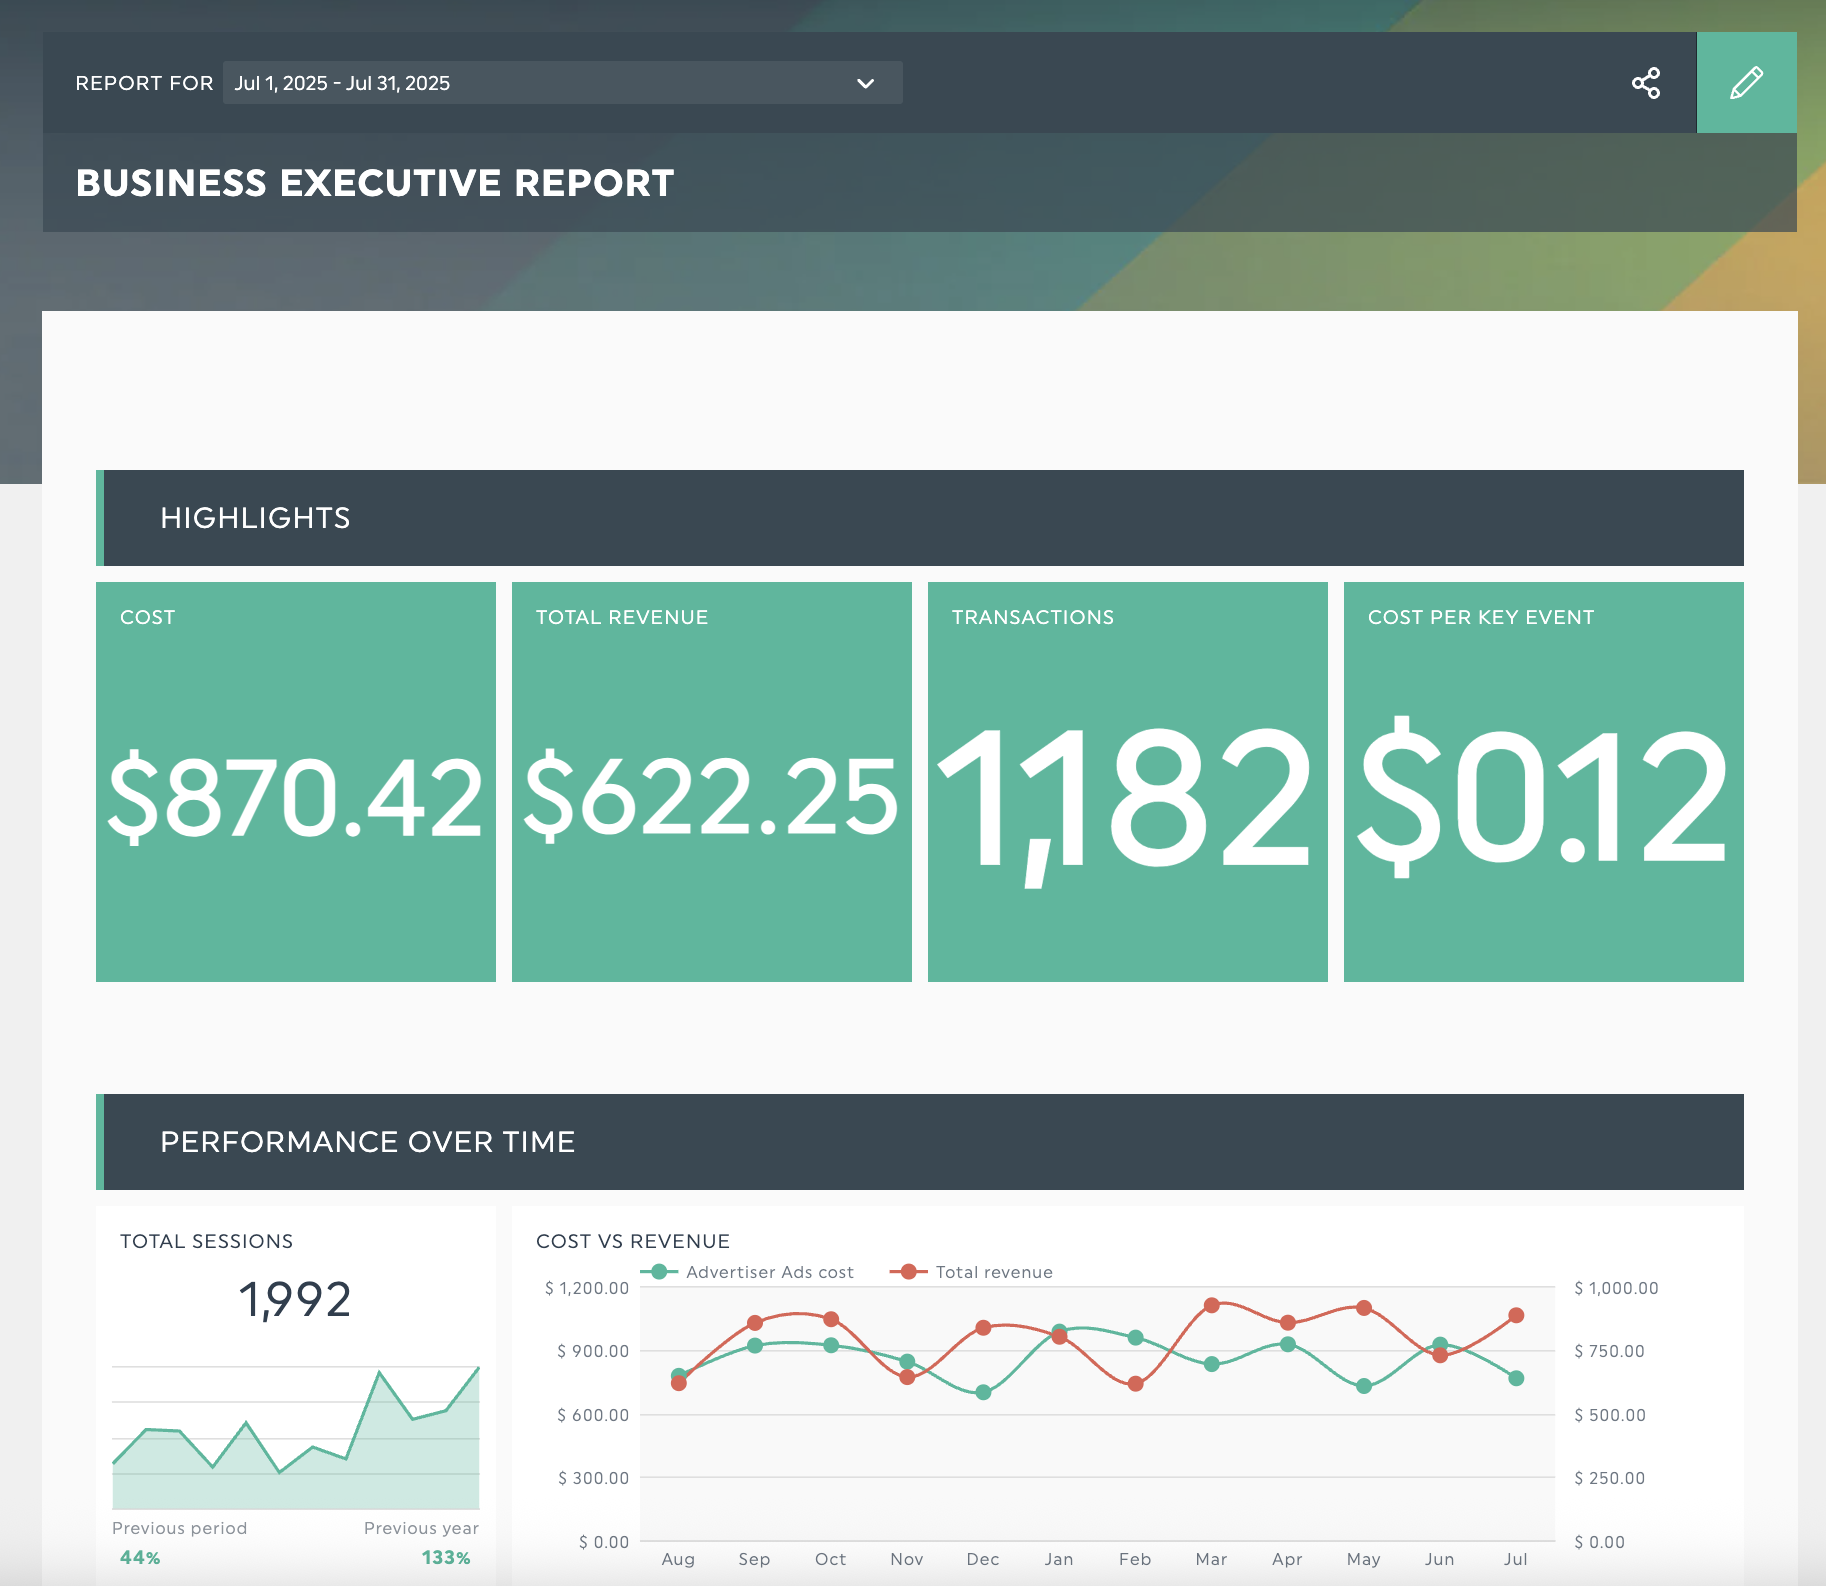
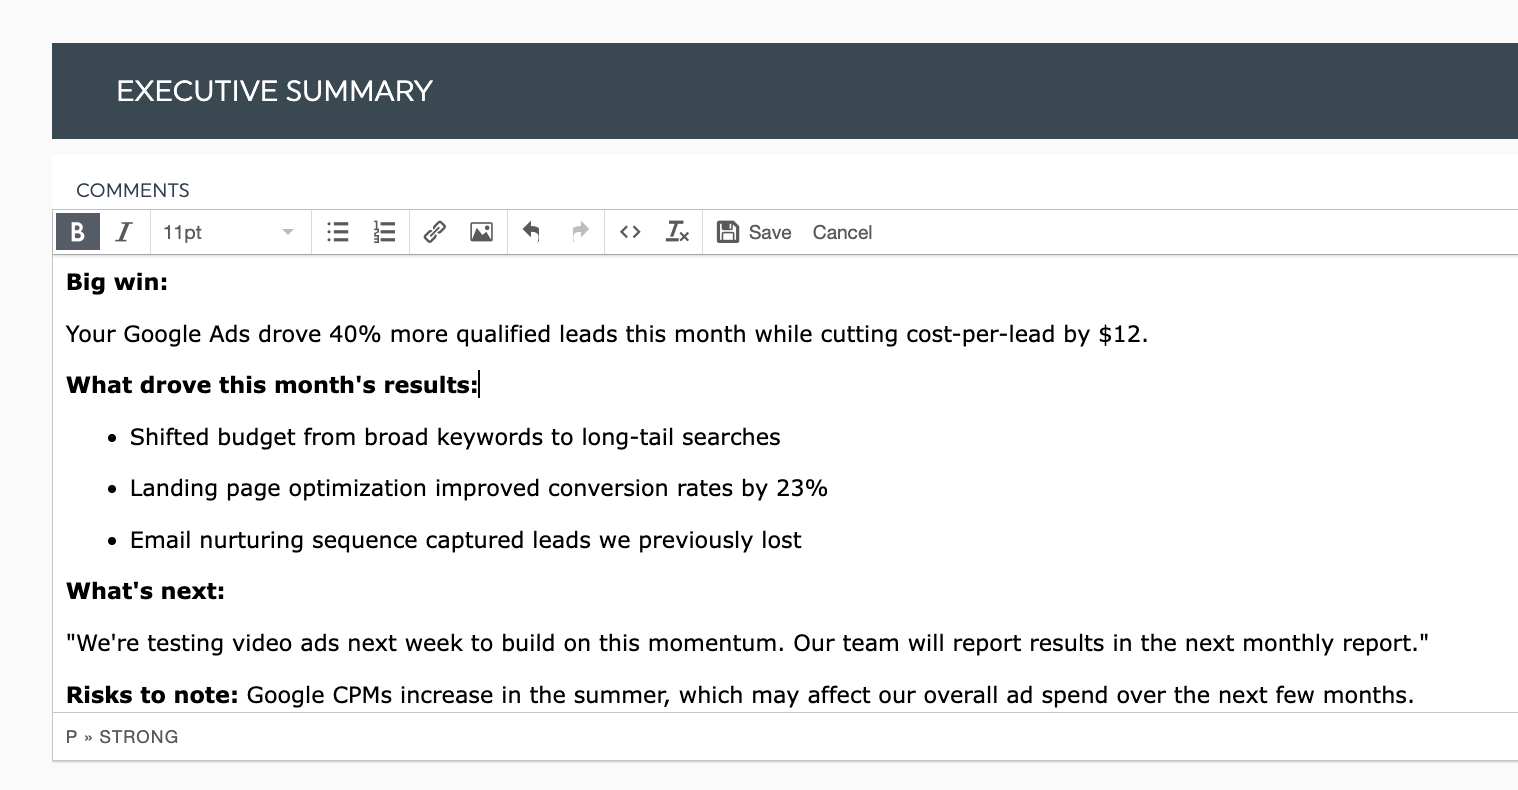
Consider this template for writing an executive summary, using a Google Ads report as an example.
- Open with your biggest win or key result, such as:
"Your Google Ads drove 40% more qualified leads this month while cutting cost-per-lead by $12."
- Explain what drove these results in three key points with supporting metrics
You want to break down what specific actions led to these results. Here’s an example:
- Shifted 60% of the budget from broad keywords to long-tail searches
- Landing page optimization improved conversion rates by 23%
- New email nurturing sequence captured 35% more leads we previously lost
- Outline your recommended next steps
Based on these results, outline what you'll do next. Strong performance calls for maintaining momentum or applying learnings to other campaigns, while underperforming areas need specific improvement plans.
Example:
"We're testing video ads next week to build on this momentum. Our team will report results in the next monthly report.”
- Flag any risks briefly
Beyond your recommendations, give clients a heads-up about anything that might affect next month's numbers. Maybe it's Black Friday season, driving up ad CPC, or you noticed a competitor just launched a major SEO campaign that could affect your client’s performance in search rankings.
This helps to set reasonable expectations with your client. For example:
"Google CPMs tend to increase in summer, which might affect our overall ad spend over the next few months."
Here’s how to add a summary box in your DashThis dashboard:
In your dashboard, select the Widget menu, then Static Widgets, and choose Comments. Use this comment box to add an executive summary.
Speed up your executive summary with AI insights
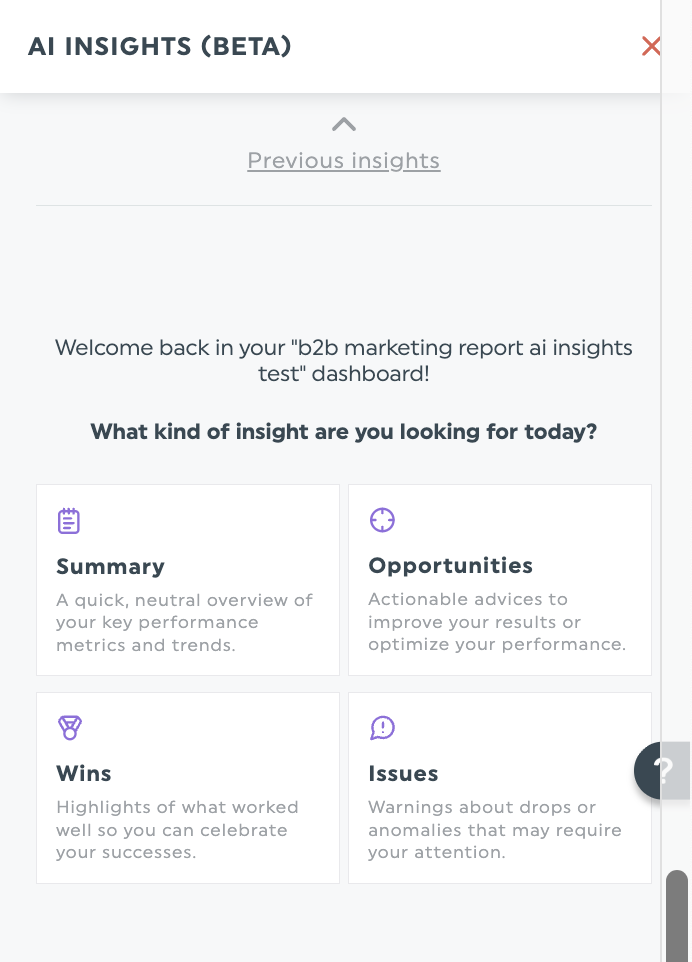
While you can write executive summaries manually using the framework above, DashThis's AI insights can speed up this process. The Summary lens automatically analyzes your dashboard data, while Wins and Opportunities help you quickly identify the key results and next steps that clients care about most.
3. Present data that drives decisions
Now for the heart of your report, your data analysis. To make this manageable and repeatable across clients, use a simple four-question framework for every metric you include.
- What's different this time? Compare against your baseline period
- What caused the change? Look for campaign shifts, seasonal patterns, or external factors
- How does this impact the business? Connect numbers to revenue, leads, or brand goals
- What should we do about it? Give one specific, actionable next step
How does this work in practice? Take this example from an e-commerce client's back-to-school campaign:
Basic analysis: "Email open rates increased to 24% this month."
Strategic analysis: "Email open rates rose from 18% to 24% this month, a 33% improvement that exceeds your seasonal engagement targets. This increase is from A/B testing urgency-driven subject lines during the back-to-school campaign, with '24 hours left' delivering the strongest performance.
Next step: Put this urgency framework into action during your product launch to keep customers engaged.
Tip: Write your analysis as if you're explaining it to someone who wasn't in the meeting when you set up the campaigns. This way, it prompts you to consider the context that makes your recommendations more actionable.
4. Identify performance patterns that need attention
Finally, review your complete report for data patterns that require attention. You should expect and address your clients' likely questions about these trends.
These patterns require more explanation because they're the details your clients will most likely notice and ask about. When you're reviewing your complete report, watch out for these specific patterns:
Priority performance measures to focus on:
- Traffic drops without campaign changes
- Ad spend up, but conversions flat
- Email engagement declining for more than three months straight
- Top content losing search rankings
High-opportunity areas for optimization:
- Content driving both leads and traffic
- Ad audiences below the target CPA
- Email segments with high open rates
- Keywords ranking 4-6th position, with potential to hit the top 3 positions
These trends aren't always easy to spot. DashThis's AI insights can help you detect them. Use this analysis as a foundation, then apply your experience and understanding of each client's needs to develop practical, tailored solutions that work.
How to build an effective marketing insight report in DashThis
Ready to put this framework in action? Here's how DashThis makes your reporting easier:
We integrate with over 34 marketing tools, including Google Analytics, Search Console, Facebook Ads, Google Ads, and LinkedIn Ads. That means all your clients' data flows into one report automatically, without you having to juggle multiple dashboards.
Here's a more straightforward way to get started. Start your 14-day free trial, then follow these three steps:
- Pick a report template (or build your own from scratch)
- Connect your client's marketing platforms as data sources- we integrate seamlessly with 34+ email, SEO, PPC and social media platforms
- Drag and drop the widgets you want
Once setup is complete, DashThis handles the tedious parts. Our AI analyzes your data to reveal key metrics, from successful campaigns to areas for growth.
- Summary insights: See what's performing well in your marketing data
- Opportunities: Areas in which you can improve your campaigns
- Wins: Find your top campaigns and most effective channels
- Issues: Spot and fix problems before they impact performance
These AI insights work best when combined with your marketing expertise. Use them to support assumptions and uncover gaps in customer understanding.
How about an actual example? Take a look at how HubSpot partner CRO:NYX used our AI tools to support their data analysis efforts.
Automate your marketing insight reports with DashThis
DashThis already helps you save time creating reports. Now, with our AI reporting tool, we can make your analysis process even faster and simpler by reviewing your marketing dashboards alongside you. This frees up your time to run tests, analyze competitor moves, and optimize campaign performance.
Here's what this means for your weekly reporting routine. Instead of spending Tuesday mornings exporting data from five different platforms and formatting reports, your client reports update automatically with DashThis. Our AI insights identify patterns and support your analysis for each client, allowing you to focus on campaign optimization and strategic planning that drives results.
Start your free 14-day DashThis trial and try out our automated AI insights for yourself!

Generate Marketing AI Insight with DashThis
Read More

Don’t miss out!
Follow us on social media to stay tuned!
Automate your reports!
Bring all your marketing data into one automated report.
Try dashthis for free