KPI Benchmarking: Differences + 6 Marketing KPIs That Matter

What do all best-in-class marketers have in common?
They keep a close eye on the competition.
They’re constantly challenging themselves to beat the average engagement rate, CAC, you name it. In other words, these marketers set KPI benchmarking to outperform their peers and speed ahead to conversions.
If you’re unsure about this practice, fret not, you’re in the right place.
In this guide, we’ll unpack the relationship between KPIs and benchmarking before diving into the KPIs you’ll want to measure.
- Understanding KPI Benchmarking
- 6 Key Marketing KPIs You’ll Want to Benchmark
- Tracking KPIs Automatically with DashThis
- Automate Your KPI Reporting Today
Understanding KPI Benchmarking
Key performance indicators (KPIs) are internal measurements that show how successfully your company accomplishes its business objectives.
KPIs are useful when measuring high-priority areas of performance. They monitor your progress and help you focus on initiatives that move the needle (tip: check out these 100+ KPIs examples to see what we mean).
Benchmarking is the practice of comparing your performance to competitors, leading companies, or best practices. It comes in handy when identifying growth opportunities and setting realistic targets — like your KPIs for the next quarter.
Putting it together: KPI benchmarking is the practice of comparing your business KPIs with other companies in your field.
What’s the difference between KPIs and benchmarking?
KPIs are internal measurements specific to your organization.
Check out this KPI report, for instance. Based on these metrics measured internally, we can deduce while the overall revenue has improved to some degree, we still need to monitor the ad costs to prevent burning through our budget in the next period.
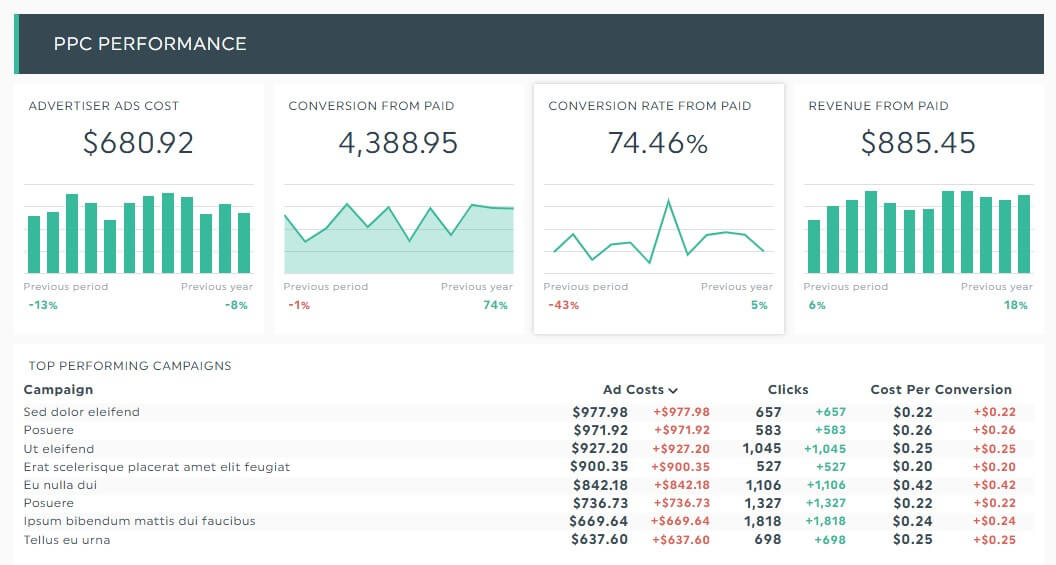
Data via DashThis, the easiest automated marketing reporting tool
Conversely, benchmarking usually compares your in-company performance to external standards (e.g., similar companies in your field). It provides context for your performance, evaluating if you fare better...or worse.
What’s the relationship between KPIs and benchmarking?
While KPIs provide the numbers, benchmarking sets ambitious targets for your organization. Together, KPI benchmarking creates a roadmap for measuring and improving your performance.
For example, an agency owner who wants to improve her newsletter on Substack might speak to fellow owners in her space to better understand their gross annualized revenue over the first 30, 60, and 90 days.
Using these KPIs as a benchmark, the agency owner might compare her individual performance and assess if she’s progressing in the right direction.
How does benchmarking accelerate performance?
KPI benchmarking compares your company to others, ensuring you improve your performance continuously. Here’s how it looks on a deeper level.
(i) You learn from top performers
The big kahunas are the one to beat. By watching over your most successful competitors, you learn best practices in strategy and execution — which you can then replicate with your own unique spin.
(ii) You build a roadmap for continuous improvement
Benchmarking also identifies strengths and weaknesses.
For instance, a Net Promoter Score (NPS) lower than industry standards means it’s high time to conduct a full strategic analysis of the entire customer experience and determine the next-step experiments to improve customer satisfaction.
(iii) You innovate and differentiate
Benchmarking avoids complacency. It’s an ongoing process that requires round-the-clock innovation, making sure you keep your wits about you and always stay ahead of the pack.
6 Key Marketing KPIs You’ll Want to Benchmark
Which KPIs should you benchmark to ensure your marketing efforts are improving continuously?
While this depends on a myriad of factors — your business model comes to mind — there are several marketing KPIs you can’t go wrong with, no matter what your strategy is.
Here’s our recommendation.
1. Customer acquisition cost (CAC)

WHAT IT IS:
Cost of acquiring a new customer
HOW TO CALCULATE IT:
Total marketing costs / number of new customers
WHY BENCHMARK IT:
Reduce marketing spend while maintaining or improving return on investment (ROI)
2. Click-through rate (CTR)
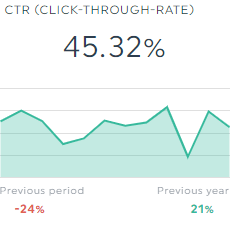
WHAT IT IS:
Percentage of clicks an ad or link receives from all users who see it
HOW TO CALCULATE IT:
(Clicks / impressions) x 100%
WHY BENCHMARK IT:
Evaluate the effectiveness of your targeting, placement, or copy (e.g., messaging, offer)
3. Return on ad spend (ROAS)
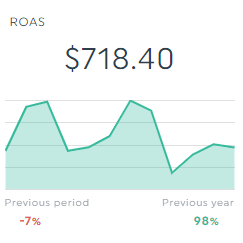
WHAT IT IS:
Revenue returned for each dollar spent on advertising. ROAS is usually measured by eCommerce stores and digital companies.
HOW TO CALCULATE IT:
Total revenue from marketing / cost of advertising
WHY BENCHMARK IT:
Optimize ad spend and budget allocation across your most successful channels
4. Customer lifetime value (CLV or CLTV)
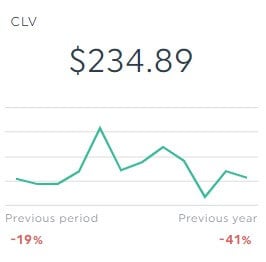
WHAT IT IS:
Total worth of a single customer throughout their relationship with your business
HOW TO CALCULATE IT:
Customer value X average customer lifespan
WHY BENCHMARK IT:
Identify opportunities to improve customer retention, loyalty, and profitability (e.g., recommend relevant products in checkout to increase average order value)
5. Engagement rate
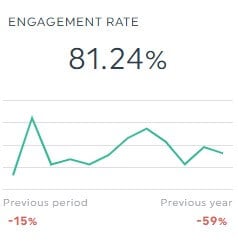
WHAT IT IS:
Level of interaction — like comments and shares on social media — with your brand’s content (i.e., how actively users are)
HOW TO CALCULATE IT:
(Total engagement / total number of followers) x 100%
WHY BENCHMARK IT:
Measure quality and evaluate if your content resonates with your target audience
6. Conversion rate
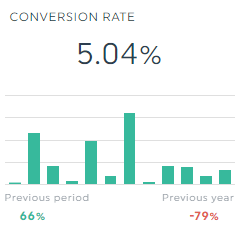
WHAT IT IS:
Percentage of users completing a high-value action (e.g., making a purchase)
HOW TO CALCULATE IT:
(Number of conversions / the number of visits x 100%
WHY BENCHMARK IT:
Identify optimization opportunities (e.g., improving the user experience, positioning, or copywriting). Tools like session replay provide visual insights into user behavior, helping pinpoint specific areas where these optimizations can have the most impact.
Tracking KPIs Automatically with DashThis
KPIs can go as high as a dozen, depending on factors like your industry and business model.
An executive dashboard, for instance, can have anywhere from three to ten. If it’s per goal, according to HubSpot, it’s common to measure four to six KPIs.
Whatever the number is, you’ll want your KPI reporting to be as automatic as possible.
Consider automating your reporting with DashThis.
It’s the easiest KPI dashboard software tool that gathers your entire data across multiple marketing channels into beautiful one report, automatically.
This way, you gain more time to complete billable work: distilling insights, strategizing how to beat your KPI industry average in the next quarter, you get the picture!
Here are six more reasons you should use DashThis in your reporting workflow automation:
(i) Over 40 customizable pre-made dashboards to visualize overall performance across different KPIs. DashThis offers multiple templates for different needs: sales KPIs for the executive, no. of leads from SEO and PPC, etc.
(ii) Ability to view performance on multiple date ranges within the same report. Click the timeline field if you want to benchmark your current performance with previous periods.
(iii) 30+ native integrations with popular data sources like Facebook, GA4, and Ahrefs. Can’t find the integration you’re looking for? Use our Google Sheets integration to add any custom data from any source.
(iv) Unlimited accounts and users, regardless of your plan.
(v) Multiple sharing options, including automatic email dispatch. Your data collection updates daily, giving you access to the latest results.
(vi) Notes and Comments widgets to provide insights and suggestions directly in your reports.
But enough about the features and benefits. Let’s explore how you can create the perfect KPI report on DashThis.
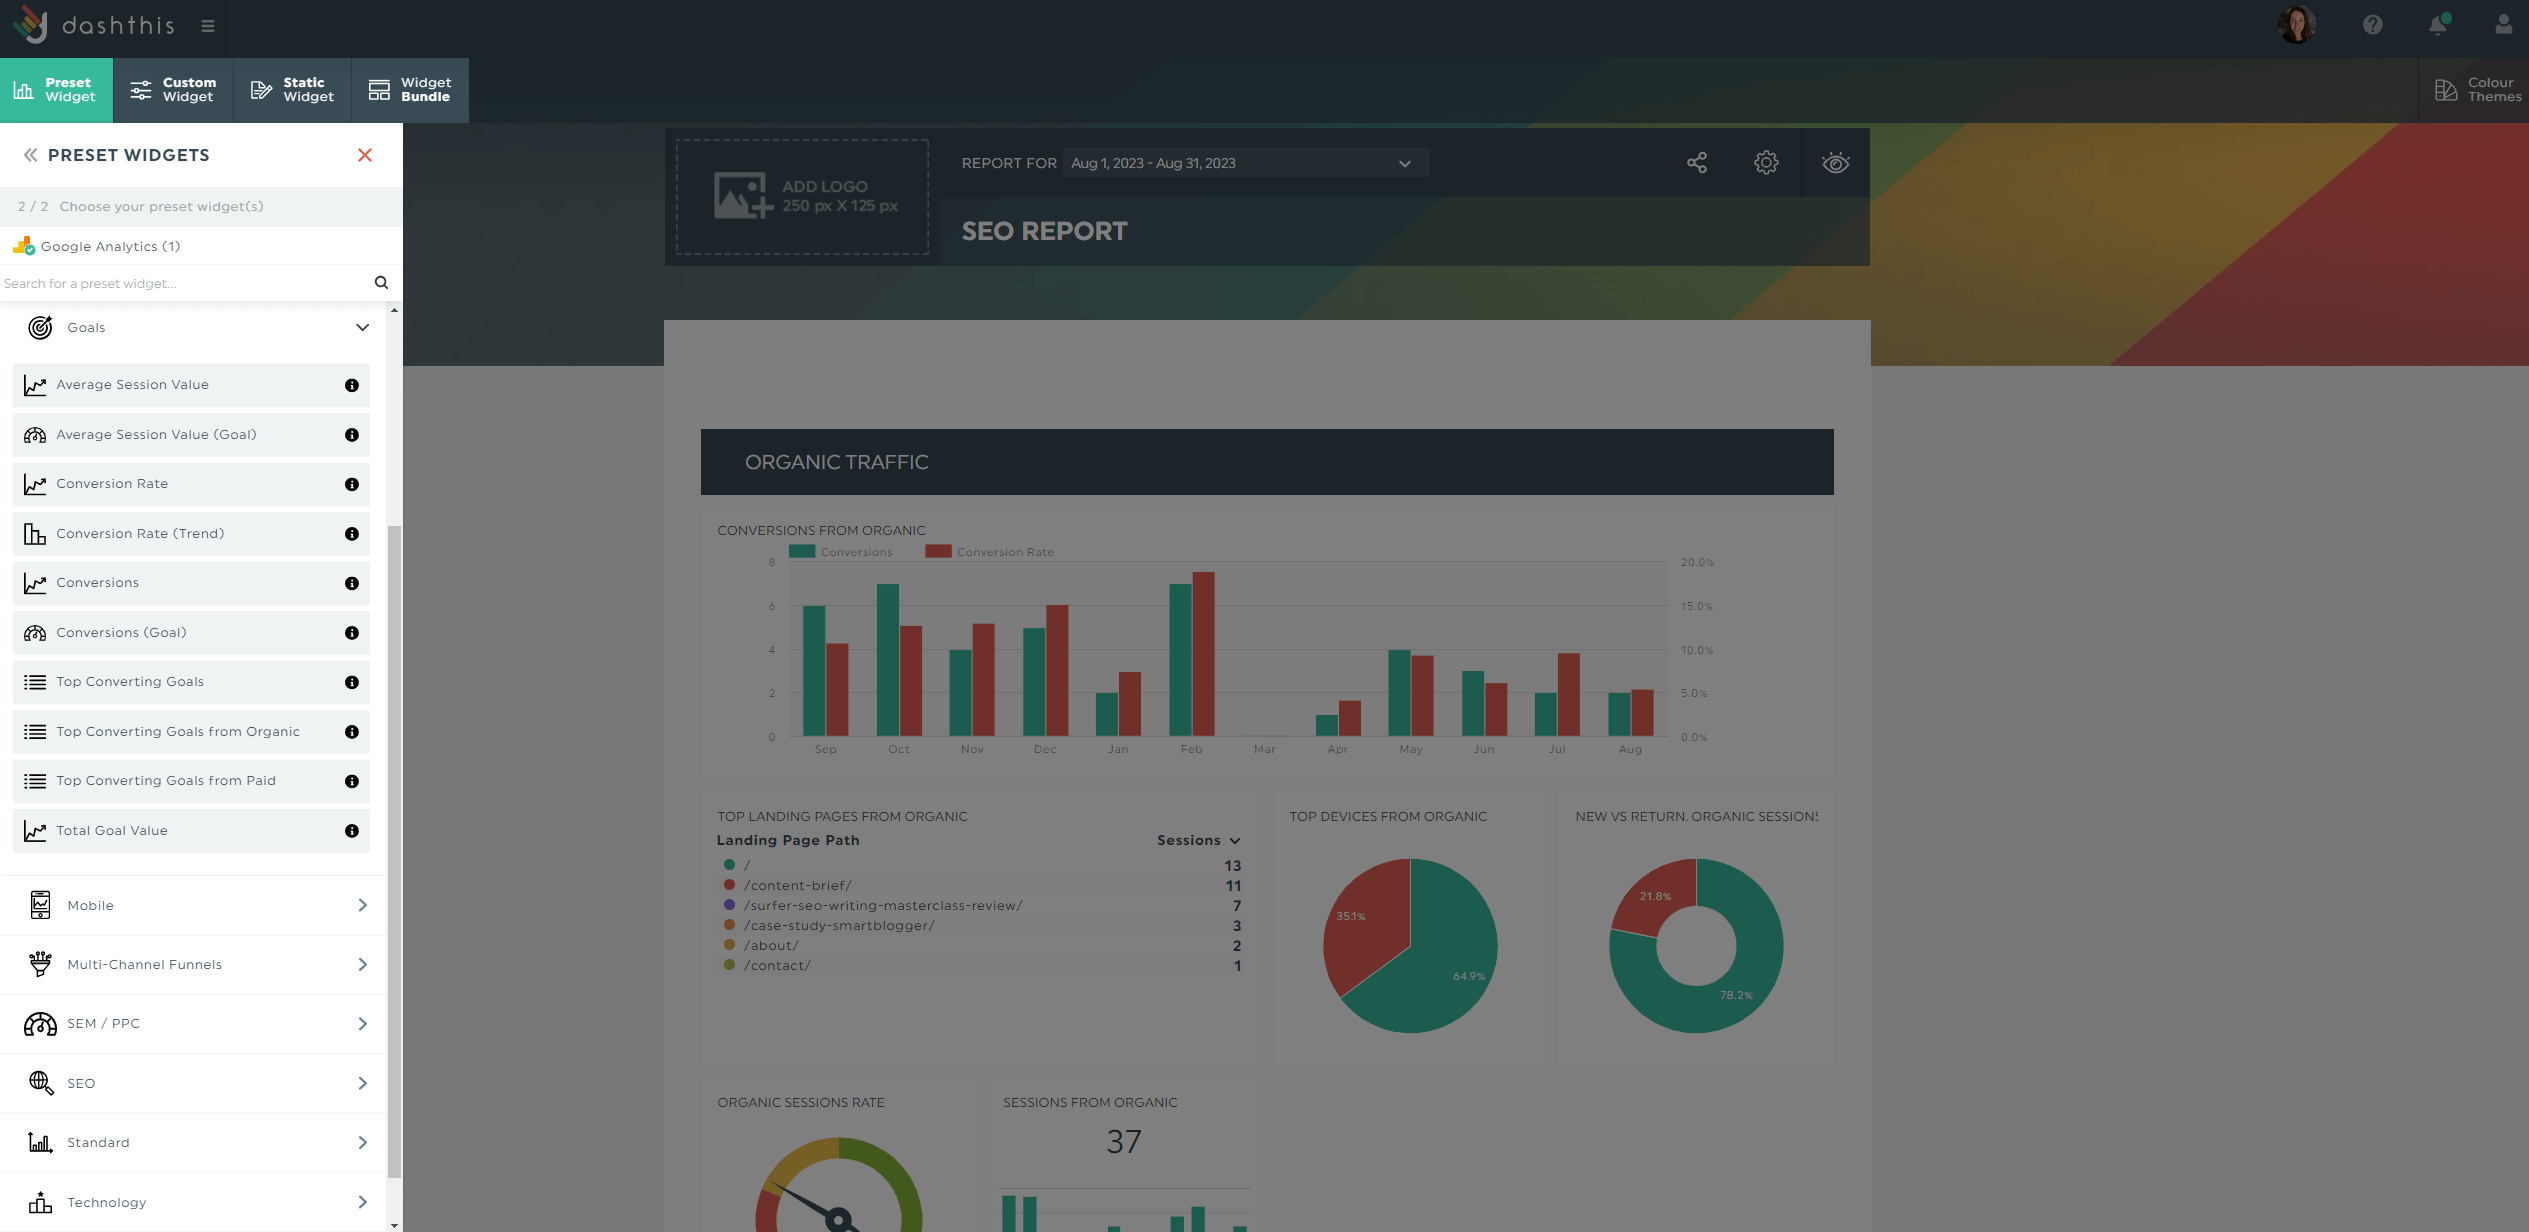
Here’s how it works:
- Select a free report template
- Connect your marketing channels with DashThis
- Pick your KPIs or metrics in Preset Widgets
Wait a few seconds while DashThis collect data into your dashboard, automatically. Drag and drop your KPIs to form a cohesive look.
Customize the report to fit the client's or leadership’s needs.
For example, use the Notes widget to provide context for specific metrics (hover to widget > click Add Note).
If you want to highlight previous benchmarks, use the Comment widget. For example, here’s how it looks when you explain how you’re progressing towards your email marketing KPIs (list growth rate and conversions) to stakeholders.
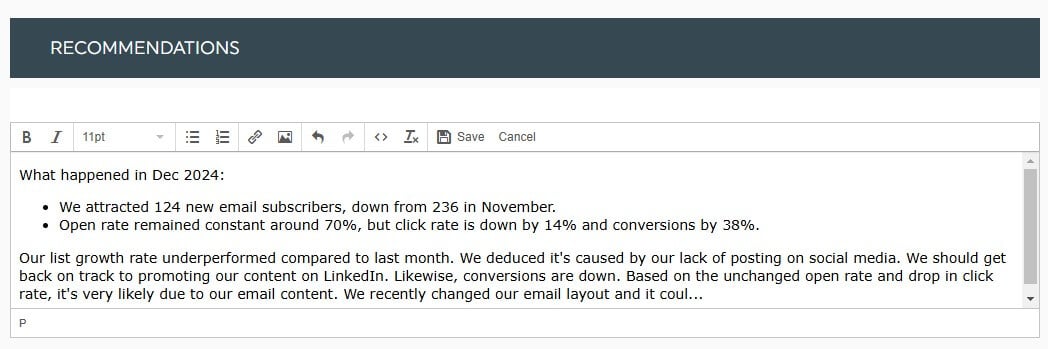
To add a comment directly in your report, click Static Widget > Add Comment > Save
With all benchmark data, valuable insights, and recommendations in one report, the client or leadership can make data-driven decisions in a snap and step in to improve their KPIs before it’s too late.
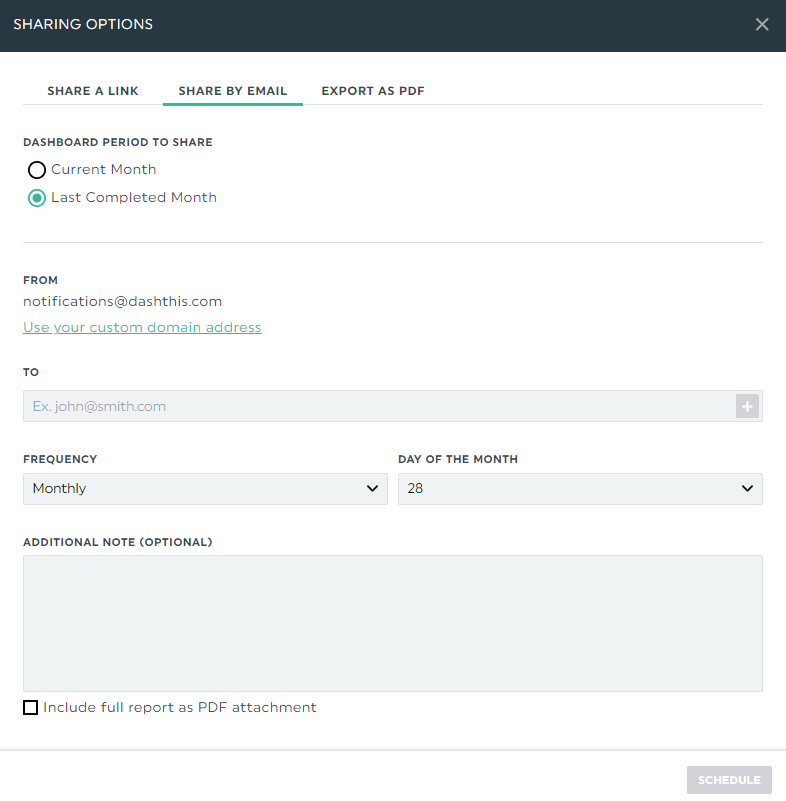
Once you’ve completed your report, configure an automatic email dispatch:
- Hover over the Sharing Options icon in the top right
- Click Share by Email
- Set the dashboard period and frequency
- Add an optional note
- Click Schedule
Automatically send your report based on your preferred schedule. Everyone receiving this dispatch can view the report in real-time.
DashThis is the easiest marketing reporting tool. Start your free 15-day trial today.
Free KPI report template for marketers
Are you performing above or below industry benchmarks?
This free KPI report template quickly compares different periods. Use it to spot monthly improvements or benchmark your performance against the industry average.
Hover the data points in the dashboard to see how your performance metrics perform across months (note: see the mouse cursor below). Don’t forget to use our Notes or Comments widgets to contextualize all your benchmark data. If you’re pitching new marketing strategies to management, this will increase your chance of getting buy-in.
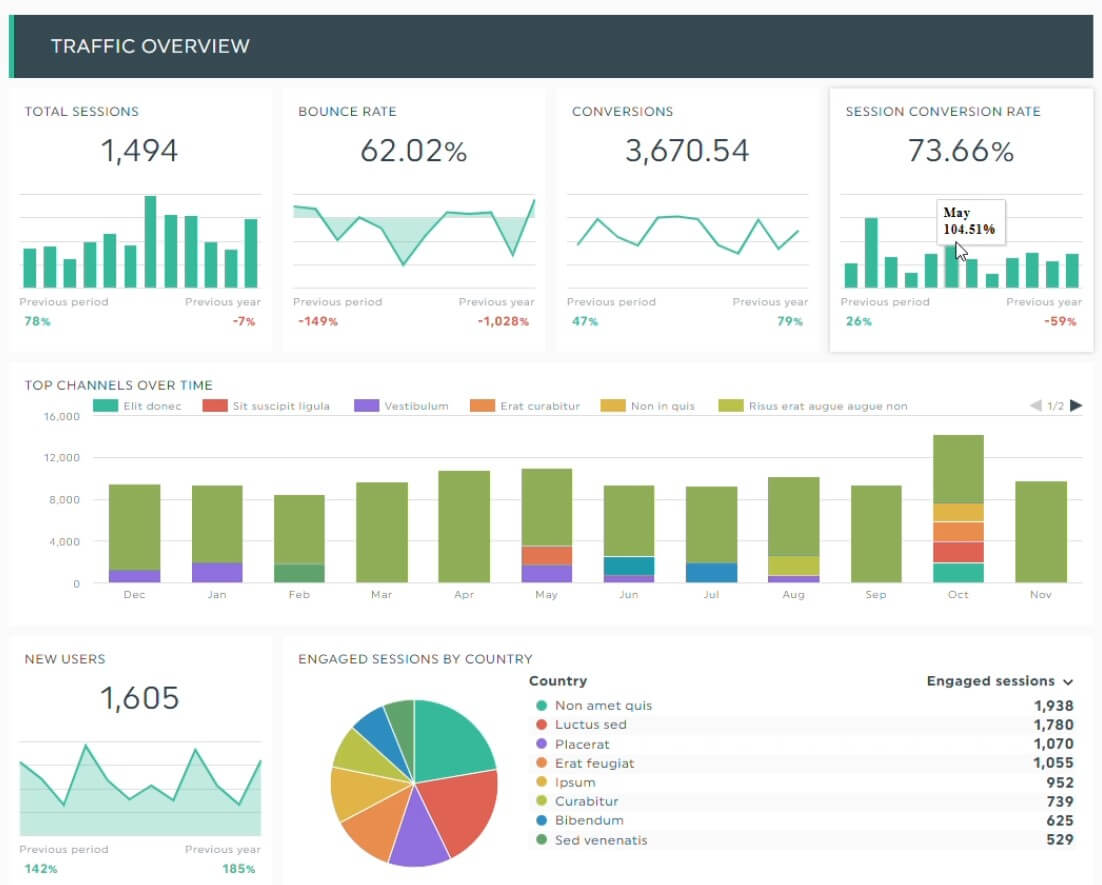
Grab this free KPI report template with your own data!
Automate Your KPI Reporting Today
KPI benchmarking keeps you on your toes.
It ensures you’re constantly improving, all the while learning best practices in strategy and execution.
But for this to happen, you need to first select the right KPIs. If you don’t know what to measure, start with our recommended list. It works across channels and campaigns.
And while you’re at it, automate your KPI reporting with DashThis.
DashThis is the easiest marketing reporting tool.
Automatically create beautiful KPI reports in the blink of an eye, gain back hours of your time, and speed up decision-making. Pricing starts at $44/month when billed annually.
Start your free 15-day trial today.

Ready to automate your KPI reporting?
Read More

Don’t miss out!
Follow us on social media to stay tuned!
Automate your reports!
Bring all your marketing data into one automated report.
Try dashthis for free