5+ helpful monthly business report template ideas & examples

Did you know Play-Doh started as a failing wallpaper cleaner?
It only pivoted to become the successful children’s toy it now is when one of the founder’s sisters-in-law heard people were buying their product to make affordable Christmas ornaments for children.
Now, hearsay isn’t the only source of information we have to help us make business decisions. Today, we have tools like weekly reports and monthly activity reports to help us evaluate our performance.
Here's how to create impactful business reports, why they're essential, and templates to help.
What is a monthly business report?
As the name suggests, it’s a regular report sent on a monthly basis to all your internal stakeholders to update them on what’s happened in the month, progress towards goals, and what’s in store for next month.
Creating a clear, structured monthly report is beneficial regardless of your seniority or position. Done well, it communicates that you’re clear on your responsibilities, proactive with communication, and excellent at your role.
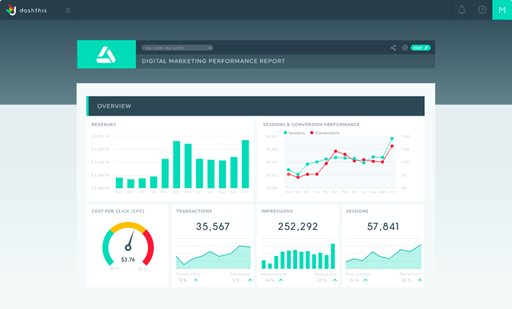
5 different types of monthly business reports
- Monthly project status report: Project reports come in handy for project management. They communicate if the project is on track, whether there are any schedule, budget, or resource risks for your team members, and recommendations to mitigate these risks for next month.
- Monthly financial report: An overview of a business’s financial health, including expense reports and cash flow analysis to guide decisions around pricing and any investments in sales, marketing, or product.
- Department performance report: Summarizes the department's performance and tracks their critical KPIs' performance. For example, the performance marketing department might report on the KPIs of their active campaigns, the progress of current initiatives, and progress towards quarterly goals like conversions and lead generation in their monthly marketing report.
- Individual performance report: Evaluates the performance of individual contributors and managers by tracking how they’ve performed on their tasks and their progression against set KPIs or OKRs.
- Overall business monthly progress report: High-level view of your critical business metrics like financial health, cash flow, sales numbers, and headcount to help executives quickly get a grasp on how a business is performing
Why are monthly reports important for your business?
Helps you make better decisions
Monthly reports give you a precious opportunity to zoom out from your day-to-day activities to refocus on what helps create value and move you towards your goals.
With reports, you’ll get an overview of what’s working and what’s not working in your role or small business, helping you make better decisions regardless of your role or seniority.
Showcases significant results to others
Your management team, clients, and stakeholders rely on monthly reports to answer these essential business questions.
- How did a campaign, team, or business perform this month?
- Are we still on track for our targets and deadlines?
- How does our balance sheet look this month?
- Are there any gaps or blockers hindering performance?
- Any opportunities for others to help us get to the next level?
Analyzes trends and inspires action
Similar to how Play-Doh was invented by observing trends, business reports provide data to optimize campaigns, pivot to new markets, and introduce new products.
How to write a monthly report: 5 things to include
1. Structure your report with your essential business goals and metrics
For every report, think about what you’re trying to achieve.
What am I reporting on here? What KPIs will be relevant to measure progress or support my message?
Not sure which KPIs to include in your report? We’ve got over 50 KPI examples for you to use as a starting point.
Once you’ve agreed on a structure and KPIs to include, keep your report format consistent. Consistent structure and elements make it easier for everyone to assess how metrics change from one month to the next.
It’s a win-win situation, faster reporting for you, and easier decision-making for your recipients.
2. Import and organize your raw data from multiple sources
Next, get all your raw data into one place. With our integrations, you can import all your tools' data into one report, saving time and energy.
3. Use visuals to represent your KPIs
Make your report visual! Visuals help comprehension and look much more professional than a plain black and white document or a boring Excel spreadsheet.
3 ways you can use visuals in your project report template.
- Data visualization: Tap on data visualization to visualize your metrics. For example, if you’re tracking the performance of a specific conversion/sign-up flow, depict this as a flowchart to make it easier to follow. Line and column graphs help visualize trends, whereas gauges are best suited to show progress towards goals. More here.
- Color: Too many colors overwhelm, whereas relying solely on black and white is plain boring to look at. Use a consistent color scheme of 6 colors or below while putting together your report. A test found using vibrant colors for text and images on a white background for a report retained data 4 times more often than black and white text on a muted background.
- Layout: Most people read from left to right, so you’ll want to put leading metrics on the left for each section. Use the top-most section for monthly highlights.
Need some design tips for your report or dashboard? We’ve got a guide here to help you.
4. Recommendations backed up by data
Every report needs to answer the ‘So What’ question - why this data is essential and what it means to the business.
Do this by including recommendations and next steps in your report. DashThis has a neat notes and comments feature to help you add context and create a story around your data while keeping your dashboard presentable.
Ideally, these recommendations should answer one of these questions:
- How is initiative X progressing? Any opportunities for improvement?
- How should we prioritize our next steps?
- Should we start/stop something?
5. Track and assign action items
Once you’ve got your recommendations, assign who is going to make your recommendations a reality.
How to write a clear action item? Answer these 4 questions.
- What needs to be done?
- Why is this action necessary?
- Who will do it?
- When is this due?
Either use a separate page in your report to track action items or track it within your DashThis report using notes and comments.
Quickly get organized with our 5 business monthly report templates
The best monthly reports are visual and get to the point quickly.
To help you out, we’ve got several report examples you can customize and re-use for all your reporting needs.
Monthly management report
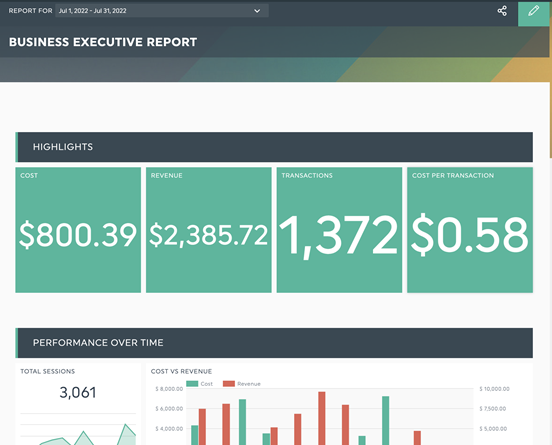
DashThis’s management report template: See it with your own data.
Get to the point by presenting monthly highlights upfront. This template includes a variety of goal performance trackers to help busy executives see how the business is performing against assigned targets in real-time for easier decision-making.
Monthly digital marketing report
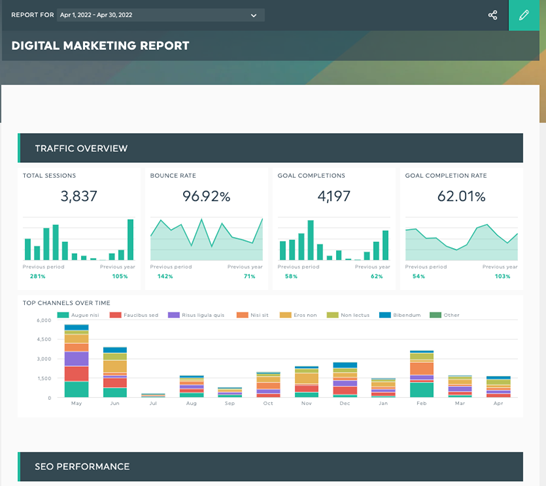
DashThis’s digital marketing report template
Get all your data from your entire digital marketing suite organized and neatly presented in one report. This digital marketing report is built to simplify the life of a busy digital marketer, helping you bring all the data across multiple tools in one place.
Monthly Google Analytics report
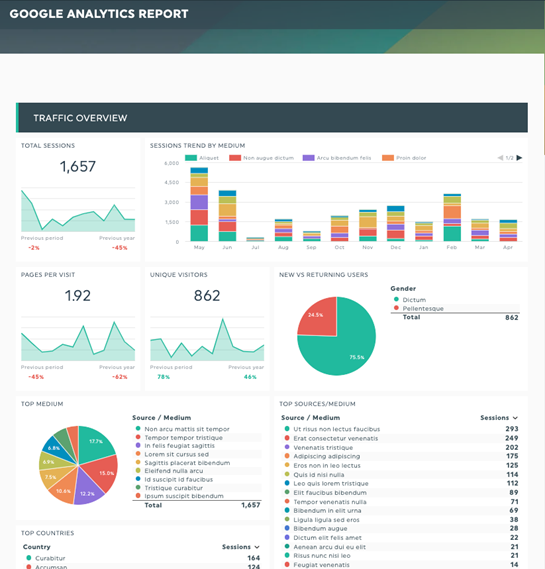
DashThis’s Google Analytics report template
Work regularly with Google Analytics?
With our Google Analytics integration, you’ll quickly get your Google Analytics data out of the tool into a beautifully formatted report in minutes. without having to overwhelm your readers with irrelevant metrics and data.
Psst, we also support GA4 as a native integration. Check it out here.
Monthly sales report
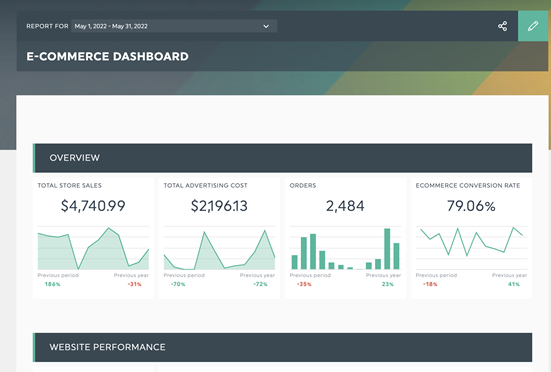
DashThis’s sales report template
Tracking monthly sales, marketing effectiveness and where customers come from is essential. Have all these metrics in one place for easy review with this template.
Monthly SEO report
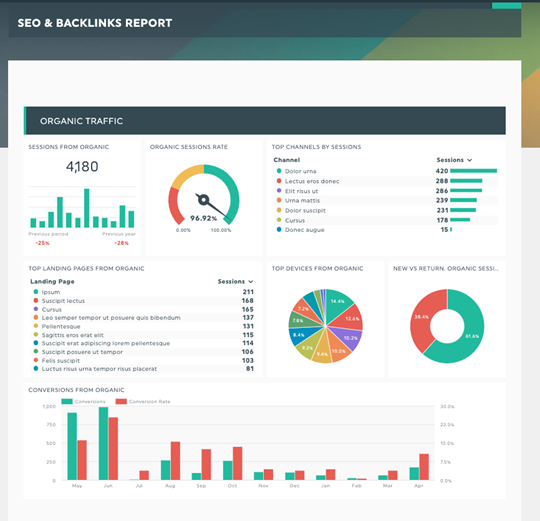
An SEO report template in DashThis. See it with your own data
Keeping an eye on your SEO metrics ensures your optimization efforts improve your organic traffic and bring in qualified leads for your business.
How to create (and automate) a business monthly report with Dashthis
Step 1: Sign up for an account with DashThis. We have a fully-featured 15-day free trial to see if we’re right for you.
Step 2: Choose from over 40+ integrations and connect your marketing tools and data sources in seconds.
Step 3: Select the metrics to include in your report from DashThis’ preset widgets.
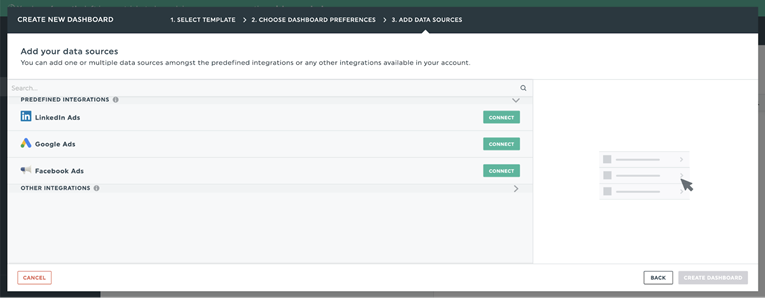
Step 4: Add as many data points as you need to set up your report. Once done, save your completed report as a template so you can reuse the template for future monthly reports and clients - saving even more time!
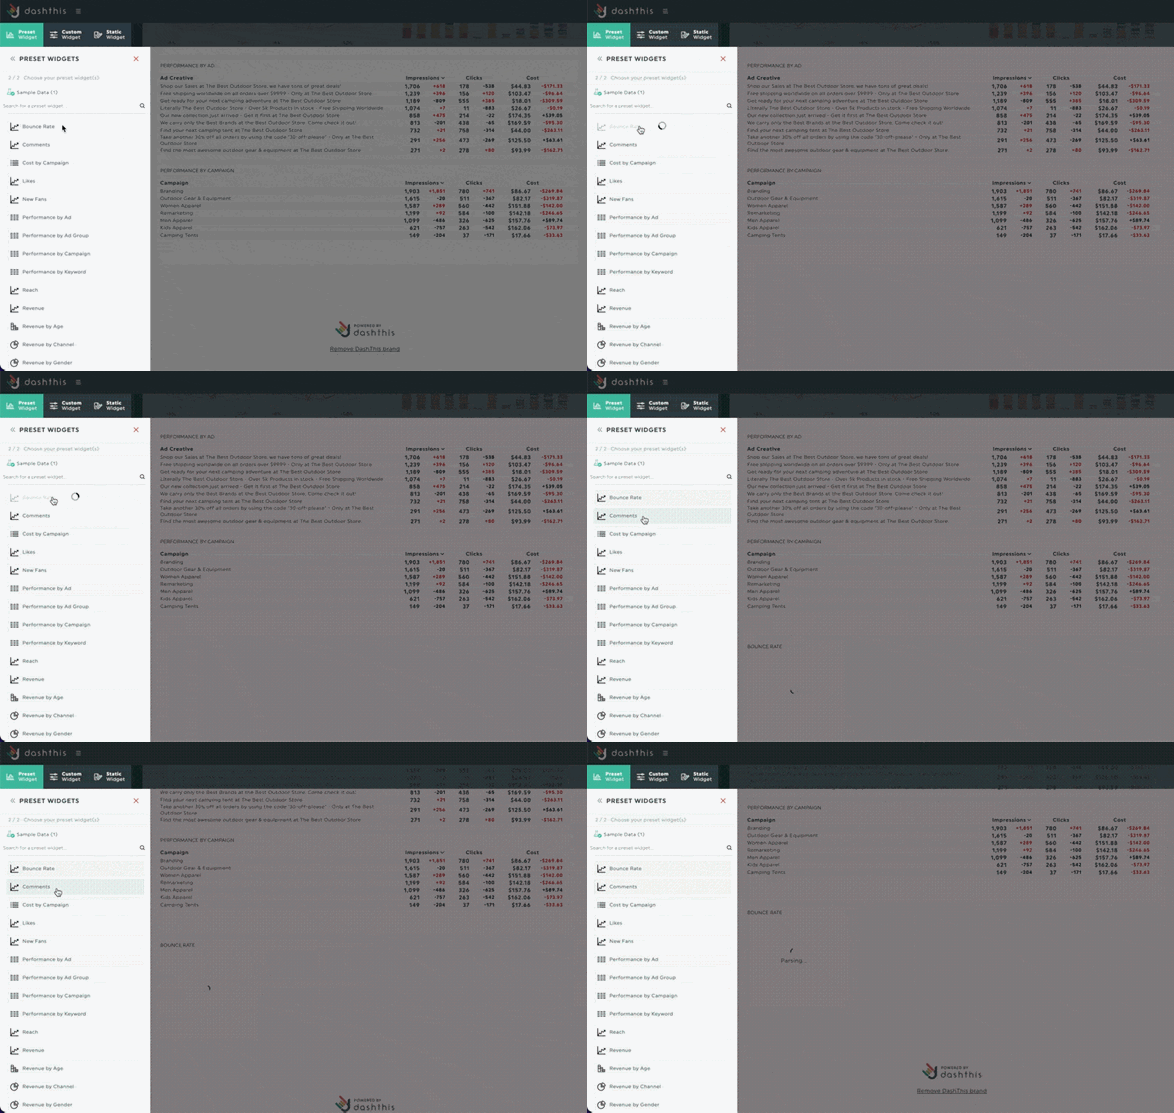
Bonus time-saving tip: Automatically schedule to send your report through email. Just enter the email addresses of the recipients you want to send your report to, and you’re done!
Start building your monthly business report!
Read More
Don’t miss out!
Automate your reports!
Bring all your marketing data into one automated report.
Try dashthis for free

