How to Present a Digital Marketing Performance Report

As a marketer, you most likely are interested in how your website and digital marketing efforts are performing and using a tool like Google Analytics to pull some sort of monthly analytics reports. (If not, install Google Analytics now and start tracking that marketing data!).
You might also track campaign performance from different marketing channels like Google Ads (formerly Google Adwords), Facebook, LinkedIn, or Mailchimp.
In addition to pulling digital marketing reports on a regular basis, you might need to present these reports to either an internal team or your clients.
Today, we will be talking about creating a digital marketing performance report and how to present it.
- How to create a digital performance report
- Prepare your marketing performance report presentation
- Make adjustments
How to create a digital marketing performance report
First, you’ll need to prepare your reports. DashThis is an excellent tool for streamlining your reporting, which saves you so much time and helps you present top-notch reports that are clear for your team and clients to understand.
Here are some tips to prepare your marketing reports:
1. Establish your goals & KPIs
Are you using a digital marketing report to show various marketing activities, inform a decision, or justify an action? Or some other business goal? Be sure that your report includes all the data necessary for your goal.
For example, if your goal is to increase conversions and calculate your return on investment on a landing page, you would probably want widgets that show:
-
A trend graph of your landing page views
-
A number of leads (qualified)
-
Sessions by sources to know if your visitors are arriving from paid search, organic search / organic traffic, email marketing, social media, or direct traffic
-
A trend graph of your conversion rate
-
A trend graph of your bounce rate over the past few months
Once you have this data, you’ll be able to make informed decisions about what is working with your campaigns, what isn’t working, and where to focus future efforts.
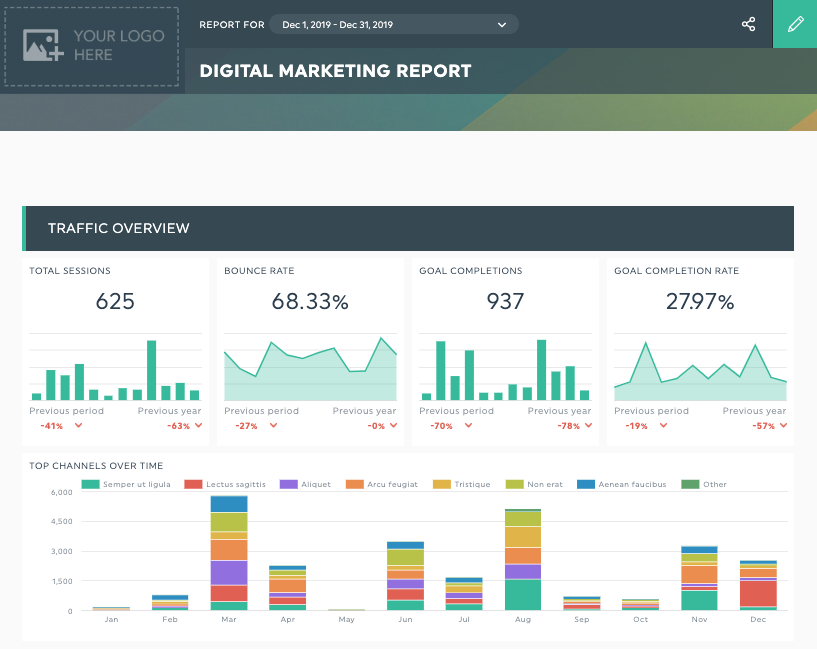
See this report live | Use it with your own data
2. Get to know your audience
The way you present to upper management might be different than how you present to the marketing team. Are the people in your audience “numbers people” or do they get scared off by too much data? Do they want high-level information or the nitty-gritty stats? Will multiple audiences be viewing the same report?
Depending on the answers to these questions, you might want to modify the user experience and set up your report differently. In all cases, though, here are some good guidelines to follow:
-
Select one of DashThis’s report templates based on which key performance indicators you’re looking to pull. This is a huge time-saver as it will do most of the work for you, you just need to integrate your data sources. You can always add your own widgets too, but it’s great to have a starting point—especially one designed by the pros.
-
Try to use visuals such as pie charts and trend graphs wherever relevant. Some marketing metrics can only be displayed in list format (e.g. the top 20 URLs driving traffic to your site), but as long as you make the rest of the data as visual as possible, your report will feel easier to digest at first glance.
-
Group similar content into sections and then visually separate the sections with headers. For example, your headers could be Traffic Overview, User Engagement, Traffic Sources, SEO, PPC, and Social Media.
-
Include all of the data you need and none of the data you don’t. Your report can fill up quickly and you don’t want it cluttered with stuff that isn’t actually useful.
Prepare Your Marketing Report Presentation
Now that your digital marketing performance report is set up and you have a solid understanding of what it represents and what your audience is looking to glean from it, you’re ready to prepare your presentation.
Here are a few questions to consider:
-
Will you be presenting in person, over the phone, or via email?
-
Will the people you’re presenting see the reports beforehand?
When you present in person, you have the benefit of being able to read your audience’s cues and adjust your presentation accordingly. You can speed up the dry parts and delve deeper into the parts that interest them. And it’s easy to make sure you’re all looking at the same thing and following along in real-time since you’re all in the same room.
If you do a conference call, it’s crucial that your audience be able to follow along. You’ll want to email the reports in advance and be sure to insert page breaks throughout so it’s easy to refer to which page you’re on and that they see the big picture.
Whether presenting in person or via conference call, be sure to prepare a list of talking points in advance. I usually highlight a few trends or anomalies I noticed in that month’s marketing report, along with recommendations for improvements.
If you will be “presenting” via email, i.e. simply sending the report over without explaining in person, this will be a bit harder but still doable. You can write notes directly in DashThis or use a “comments” widget in each section where you can write your notes.
How often will you be presenting?
I provide monthly digital marketing performance reports for my clients, which is a pretty standard reporting period. Any more frequent than that could be too soon to draw conclusions (though you should still be keeping an eye on things throughout the month), and any longer than that makes the data harder to muddle through.
Having individual monthly reports allows you to go back and see specific stats for a particular month, but it’s also a good idea to include trend graphs so you can spot trends for the year without having to open 12 separate reports.
How often you prepare reports is different than how often you’ll be presenting. While it’s useful to touch base with your clients to review reports, it does take time—time that you could be spending working on your website and digital marketing efforts. So it’s important to find the balance. You want your team/clients to be on board with the program and your decisions, but you also need time to actually do the work you’ve promised to do. My general rule of thumb is that for large budgets and big decisions, meet more frequently (perhaps monthly or bi-monthly). For smaller budgets or programs with few changes, quarterly is probably fine.
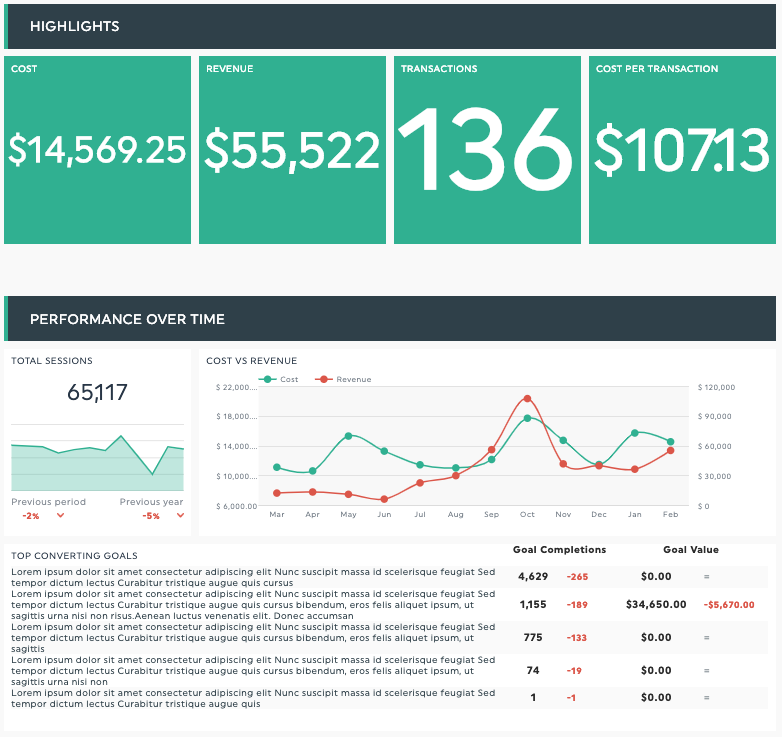
See this report live | Use it with your own data
Make Adjustments
The first time you present, you might have to make assumptions: You’ll have to take an initial guess at what data they want to see in their digital marketing performance report, how they would like it presented, and how often they would like to see it. During your presentation, take notes and collect feedback on what they would like to see next time. Maybe they would like you to add new stats or report on some of the data in a different way. Perhaps they would like to meet more or less frequently. Maybe other people should be included in the next presentation. Always take their feedback into consideration and incorporate it where possible.
Bottom line, when you present marketing reports with the data your audience wants and the way they want to see it, they’ll look forward to your presentations and the value you provide. Everyone wins!
I hope these tips help you prepare excellent reports and deliver successful presentations!
Start automating your digital marketing performance reports now!

Create your performance marketing report
Read More

Don’t miss out!
Follow us on social media to stay tuned!
Automate your reports!
Bring all your marketing data into one automated report.
Try dashthis for free