The Ultimate Beginner’s Guide to PPC Reporting

Your boss recently instructed you to create weekly reports for your high-spend clients.
The problem: You’re new to the job and not exactly sure how you should go about it.
"Do I really need to measure these many metrics? It feels excessive."
"Is it possible to show performance across all paid channels in one report without having to manually update the data?"
"Okay, so I should use a PPC reporting tool instead of Excel. Cool. So... which works the best?"
In this beginner’s guide, we walk you through how to streamline your PPC reporting with an automated reporting tool and recommend eight metrics to get you started.
- Why PPC Reporting Matters
- 8 Key Metrics for PPC Reporting (Most Commonly Measured in Our Experience)
- Speed Up Your PPC Reporting Process with DashThis
- 3 Free PPC Reporting Dashboard Templates
- Automate Your PPC Reporting Today!
Why PPC Reporting Matters
Paid ads is the easiest channel to squander a significant amount of money if you're new to the field. This section explains in detail why you need to make pay-per-click (PPC) reporting a habit.
Communicate the good and bad (and what you plan to do next)
One red flag businesses avoid in agencies is the lack of transparency, as highlighted in SEMrush’s latest agency report.
By presenting your ads reports daily, you keep clients in the loop and show you’re actively working towards their business goals.
To get on their good side, communicate how the overall campaign performance affects revenue. For example, if cost per acquisition increases, explain how it eats up profits and how you plan to bring it down in the next ad campaigns.
You can easily explain your strategies on a PPC reporting software like DashThis.
Click Static Widgets > Comments to add a comment box within the PPC report. Share what you’ve learned in bullet points and drag and drop the box to the top.
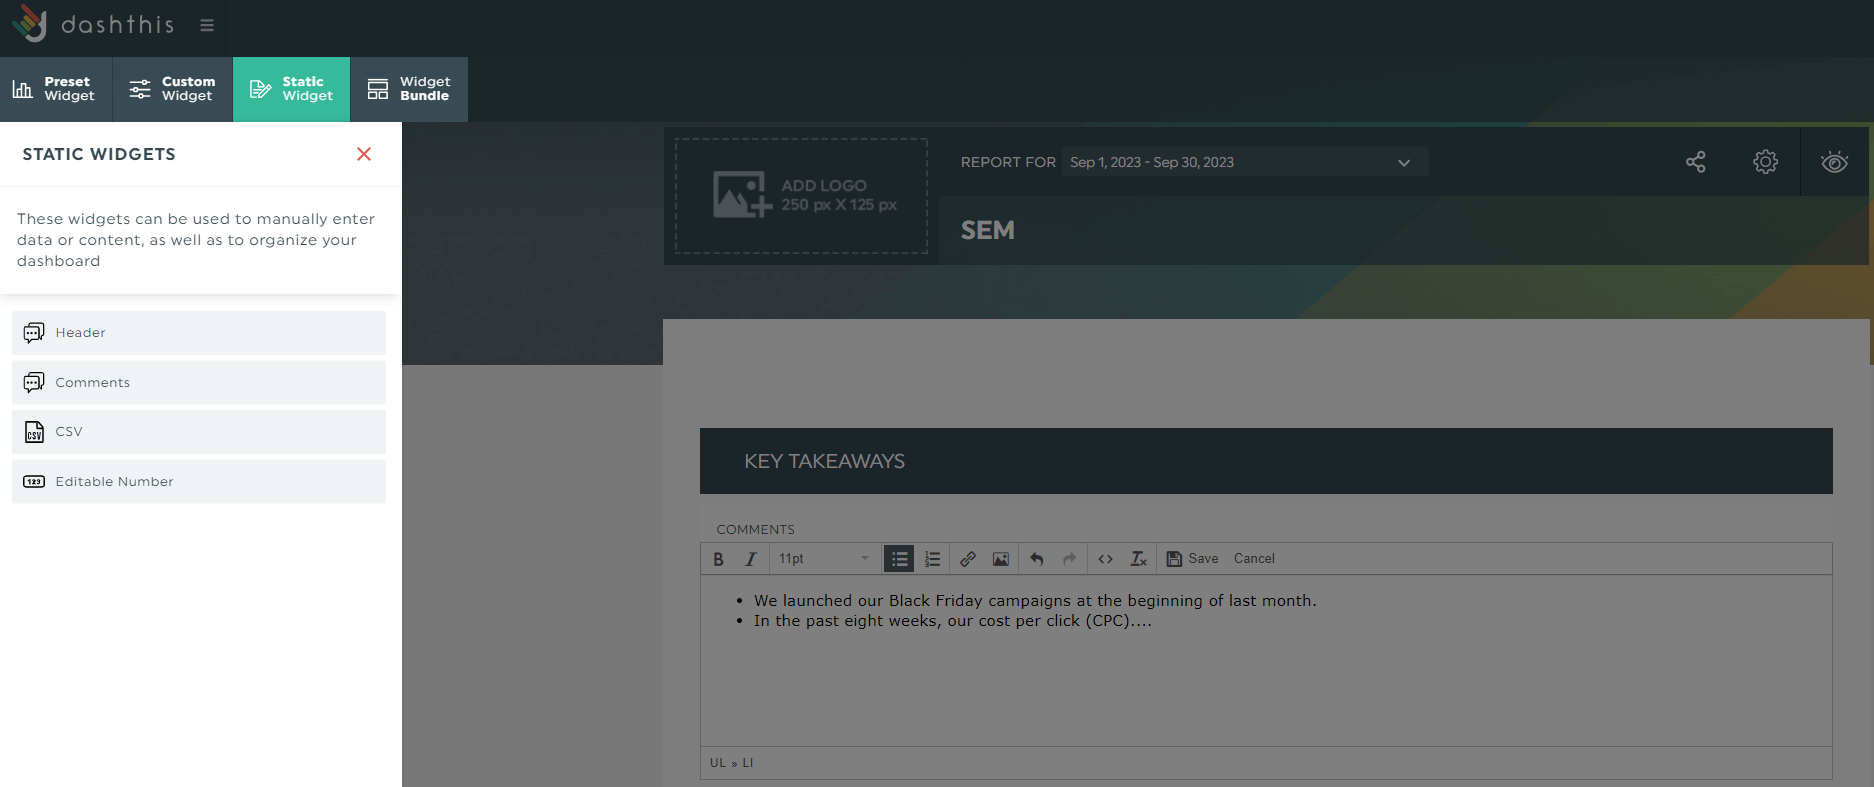
Your target audience—whether the client or project manager—will see it right off the bat in view mode.
Fire up decisions based on data, not gut
58% of organizations base at least half of their business decisions on gut. The same report also found these organizations underperform competitors.
To outrank competitors, start looking at your data.
These real-time insights, combined with sales enablement strategies, reflect audience behavior, which help you make data-driven decisions with zero guesswork.
Wondering which social media channels attract quality enterprise leads? Or which landing pages require optimization for higher conversions? Debating between Twitter or Quora for awareness campaigns?
Look at your PPC metrics–it's got everything you're looking for.
Understand ROI
If you’re running PPC ads in a highly saturated market where everyone is trying to outspend one another, the last thing you want is implementing strategies that don’t work.
Note how the PPC dashboard below stacks up cost against revenue. Instantly, it tells you the return on investment (ROI) is far too low and adjustments need to be made.

Without PPC reporting, you wouldn't know when to refine the strategy and allocate your budget.
8 Key Metrics for PPC Reporting (Most Commonly Measured in Our Experience)
Measuring the right KPIs and PPC metrics moves your campaign goal forward.
But which metrics should you focus on when there are dozens of them?
While it’s impossible to personally recommend the best PPC metrics without knowing your goal, we learned a comprehensively good PPC report tends to include the following.
Click-through rate
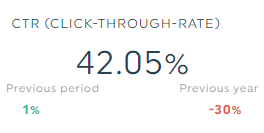
Click-through rate (CTR) is the percentage of clicks your ad receives from all users who see it.
Improve your messaging to bump up this metric. When ActiveCampaign swapped to educational ads instead of the standard promotional ads on LinkedIn, it achieved a 5-10% CTR.
Impressions
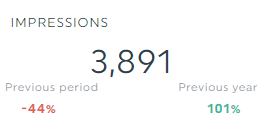
Impressions are the number of times an ad is shown. Measure this metric to gauge your potential ad reach.
Conversion rate
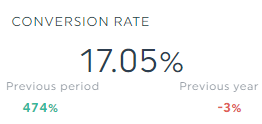
Conversion rate (CVR) is the percentage of searchers who completed an action measured against the total number of visitors.
There are multiple ways to increase this metric, like retargeting. Impactable, a B2B LinkedIn ads agency, increased its conversion rate by 10% in only six months after narrowing down its audience to specific segments (e.g., seniority level, industry).
Quality score

Quality Score is a diagnostic tool that stacks up your ad quality against other advertisers on a scale from 1 to 10.
A healthy ads performance sits between 7 and 10.
Cost per click (CPC)
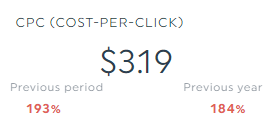
Cost per click (CPC) is the price you pay for each ad click.
This metric is often confused with cost per conversion, which tracks the amount you pay for each completed action (e.g., completed a demo form). Another relevant metric is cost per acquisition (CPA), which tracks the cost for each acquired customer.
Return on ad spend
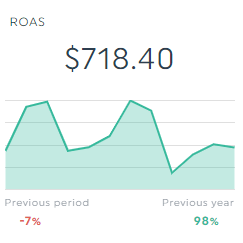
Return on ad spend (ROAS), a popular metric in eCommerce, tracks the revenue you get back for each dollar spent on advertising.
Ad position
Ad position is a defunct metric replaced by two new metrics:
- Impression (Absolute Top) % - percentage of impressions for your first ad above the organic search results
- Impression (Top) % - percentage of impressions for your ad anywhere above the organic search results
Track these two metrics to get a clearer picture of your ad position as a whole.
Keyword performance
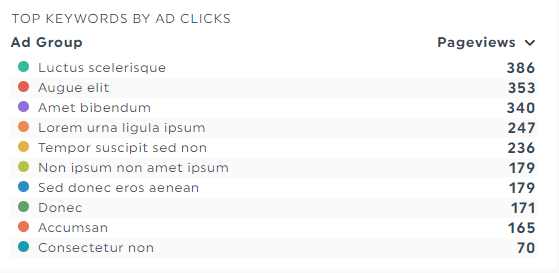
Keyword performance isn’t exactly a standalone metric.
Rather, it's a snapshot on Google Ads that shows keyword status, click-through rate, and quality score.
You can add your own version of keyword performance within the PPC report.
Note the screenshot created on DashThis above. it shows your top keyword ad groups by clicks. At just a glance, you know which themes perform best.
Speed Up Your PPC Reporting Process with DashThis
As a beginner, it’s daunting getting in the weeds of your ad channels.
Clicking through multiple campaign tabs, analyzing the metrics in a never-ending table, and not to mention account updates that happen out of nowhere… Remember the Google Ads automatic data migration that confused advertisers everywhere?
Suffice to say, it takes a significant amount of time to overcome the learning curve.
Consider using DashThis to quickly make sense of your ad performance.
This breezy PPC reporting tool boasts preset metrics across your favorite channels. Click once and let it automatically gather and turn your entire PPC data into digestible graphs and charts.
Here's how you can get started:
- Choose a free report from over 40 free report templates
- Connect your ads accounts with DashThis (note: DashThis offers 40+ integrations, including Facebook Ads, Google Analytics, Google Ads, and Microsoft Bing Ads)
- Select your PPC performance metrics in Preset Widgets
In just a few seconds, you'll see the metrics you selected on the right side of the screen.
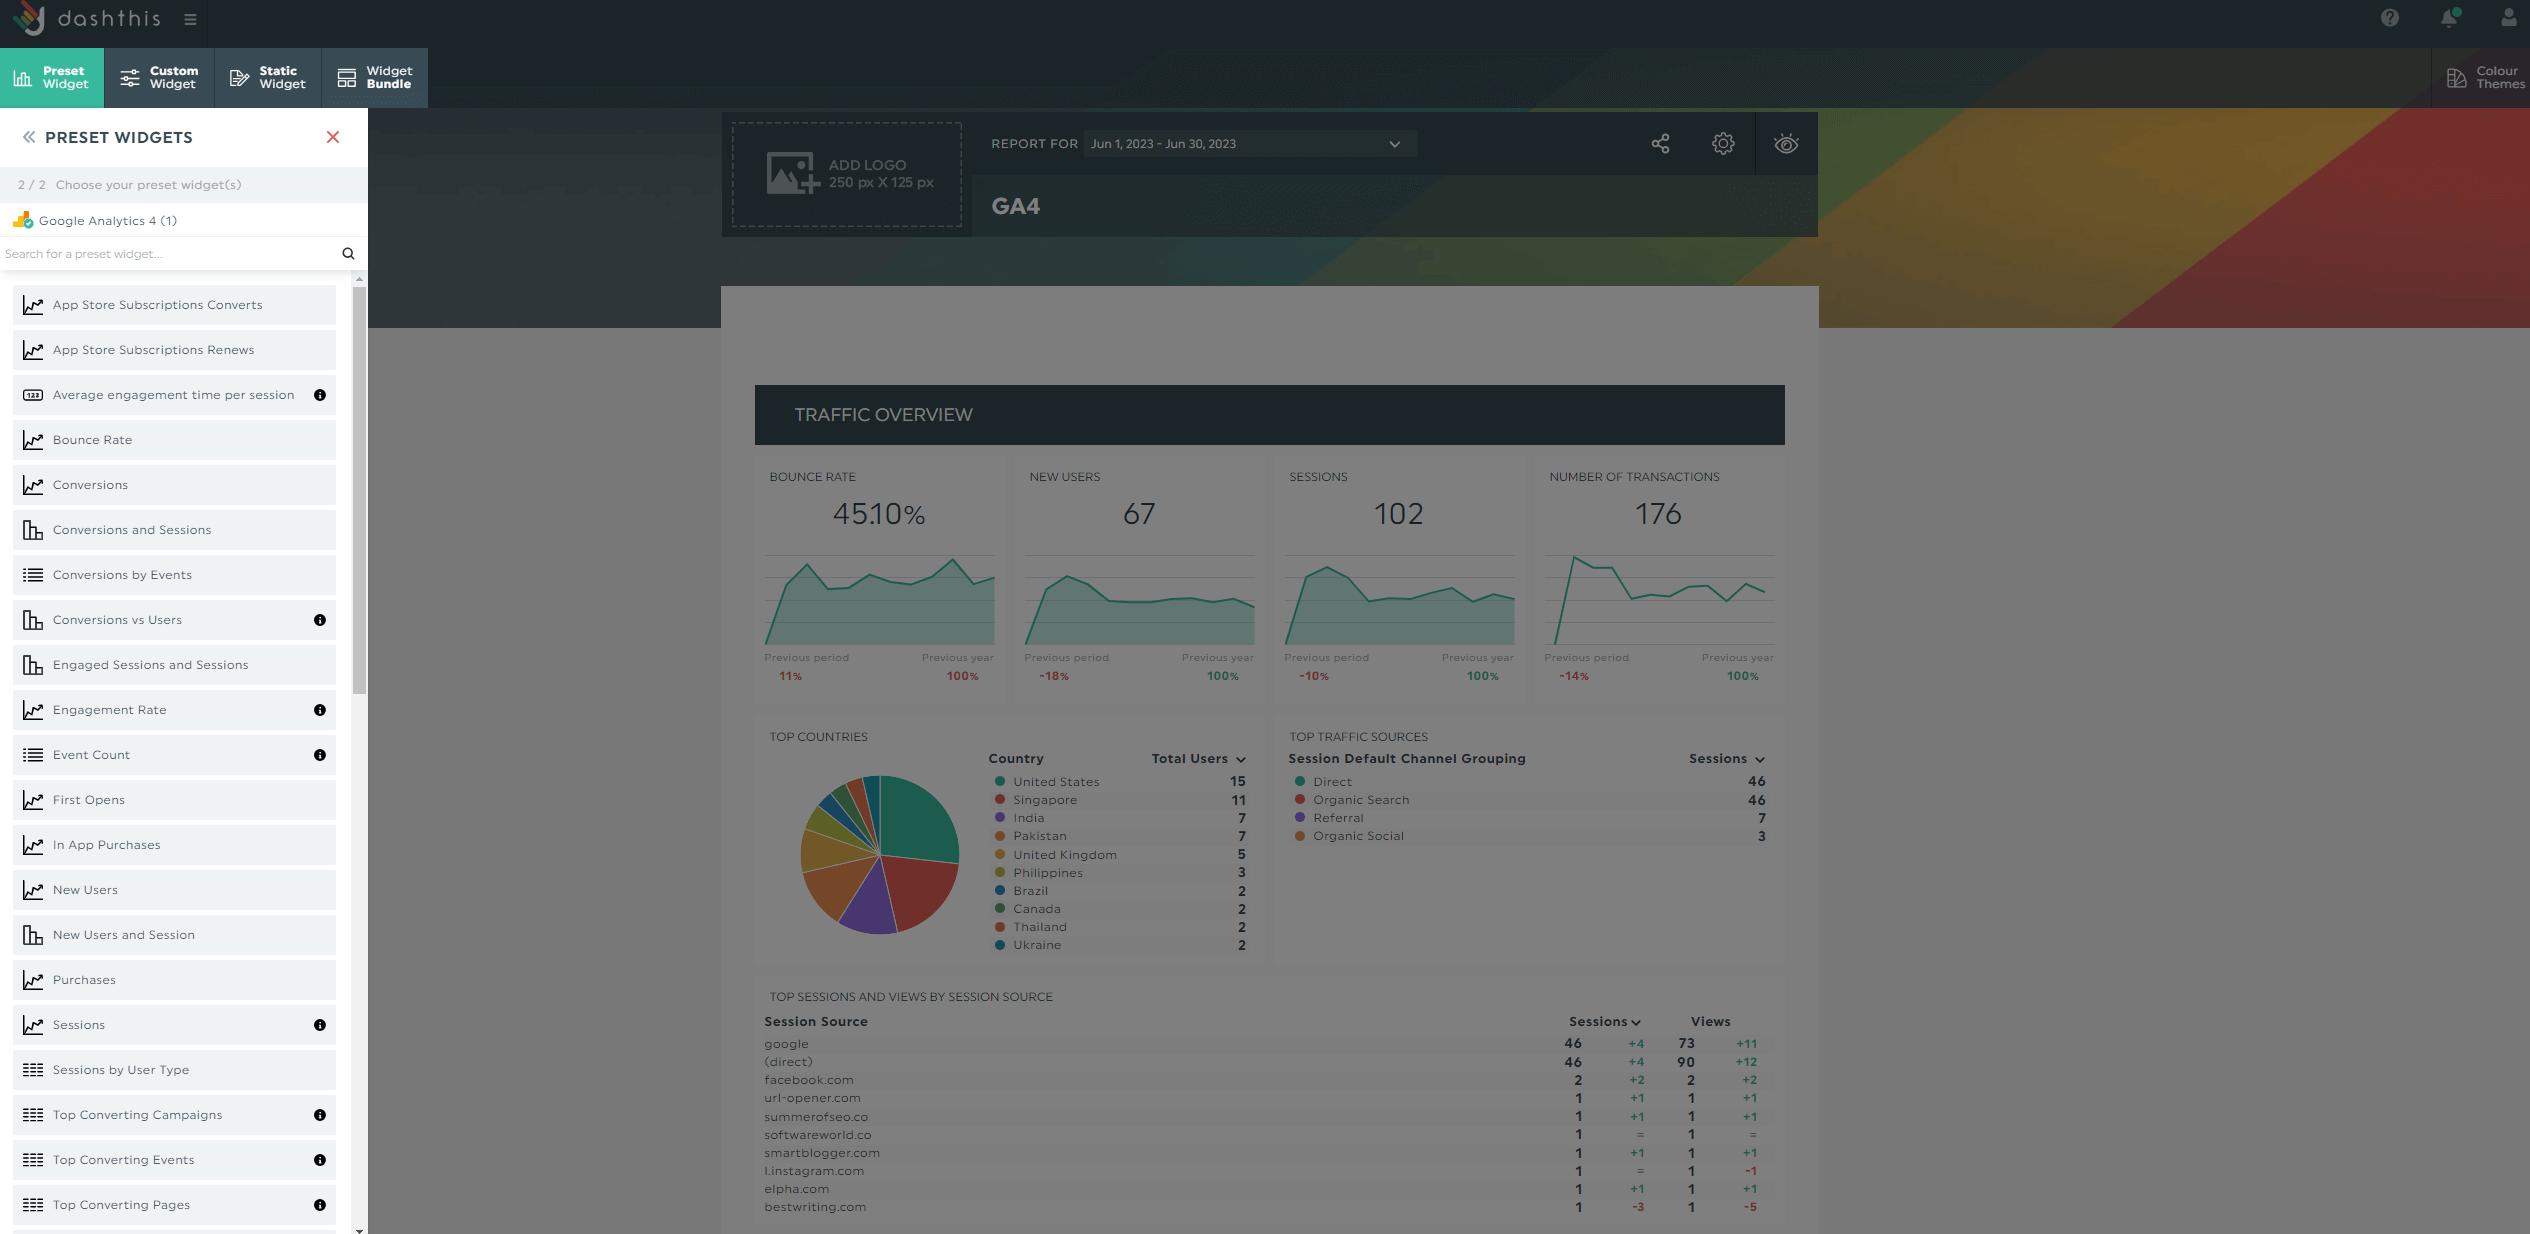
Drag and drop the metrics to form a cohesive look.
For example, if you want to illustrate the ROI of your LinkedIn Thought Leadership Ads, place the click-through rate, cost per click, and cost per acquisition widgets next to each other.
Once you’re satisfied with the PPC report, share it with clients (tip: save it as custom reports for future use!).
Hover to the Sharing Options icon and click Share by Email.
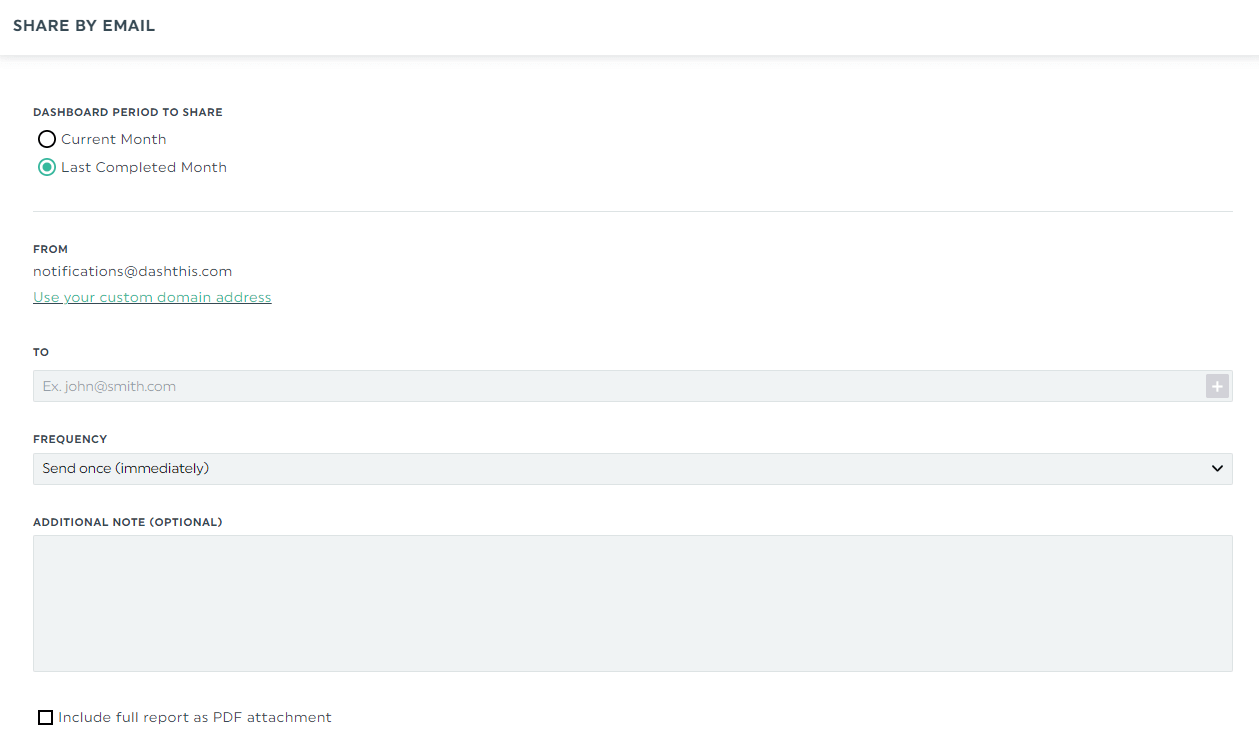
Here, you can set your preferred frequency.
DashThis will automatically dispatch the report according to your preferred timeline, saving you the extra step of manually updating the data.
Stumped by your ad accounts or looking for a professional alternative to Google Data Studio? DashThis is the easiest reporting tool. Try it free for 15 days to automate your PPC reporting today.
3 Free PPC Reporting Dashboard Templates
Use these plug-and-play templates to auto-grab all PPC marketing data and communicate your results to clients in a central location.
Google Ads PPC report template
Uncover your top-performing marketing campaigns across App, Display, Performance Max, etc. with this PPC ads dashboard.
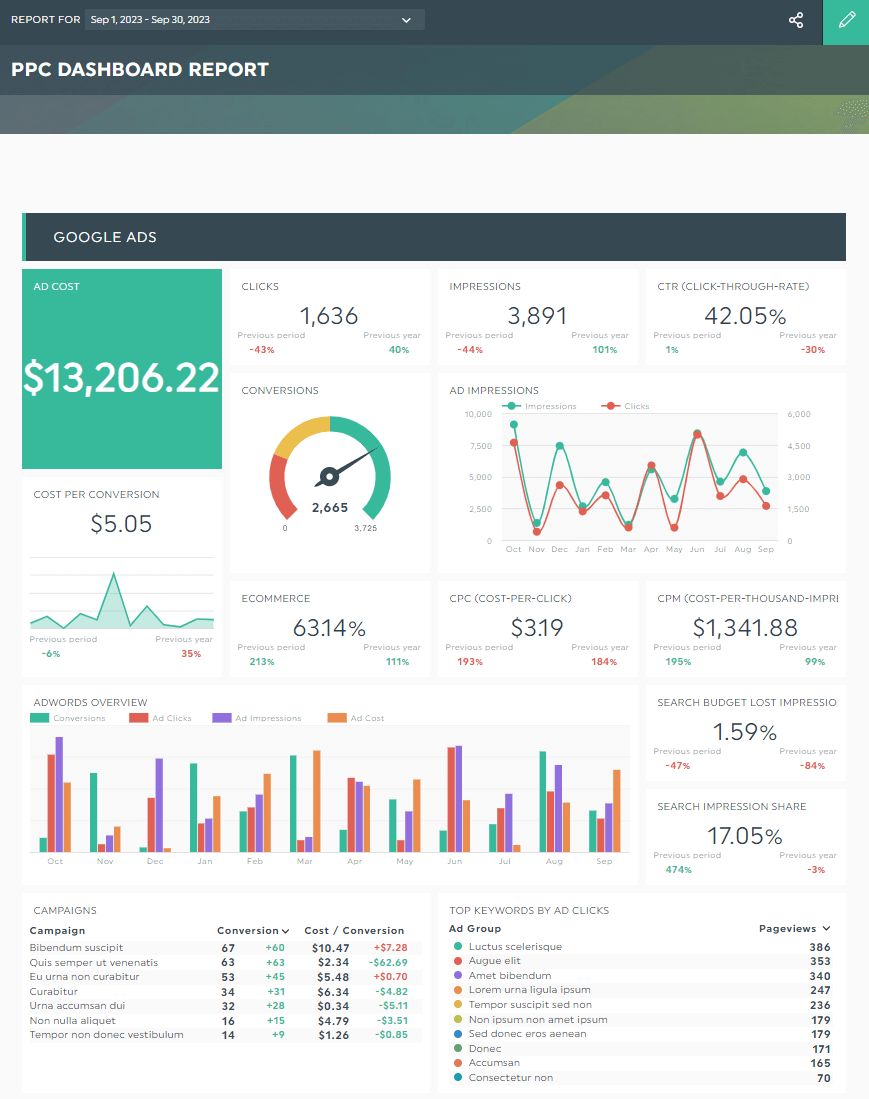
Grab this PPC advertising report with your own data!
All-in-one advertising campaign report template
Running a PPC marketing strategy across Facebook, Google, and LinkedIn for a B2B client? This complete advertising dashboard got you covered.
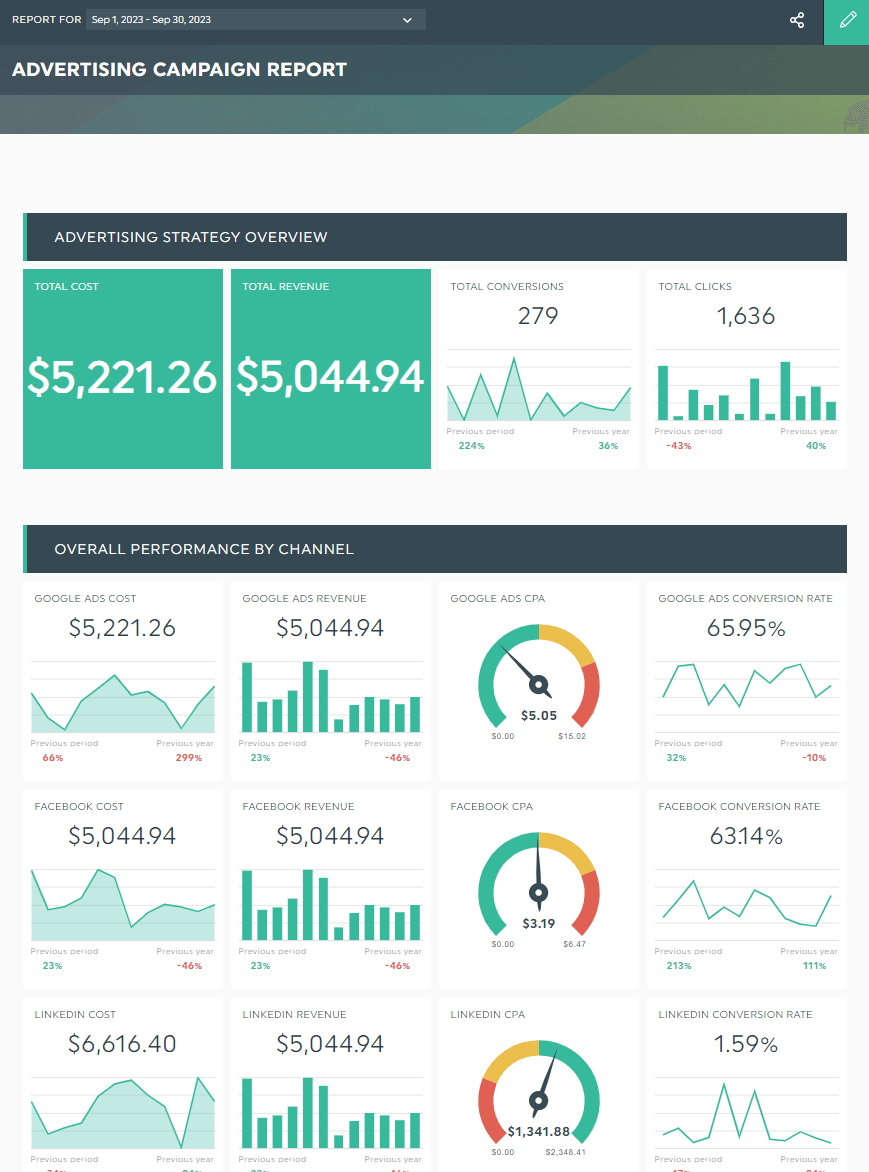
Grab this advertising campaign report with your own data!
Digital marketing report template
Inbound and outbound marketing channels work in tandem. Track your SEO efforts and PPC campaigns in one place using this free dashboard.
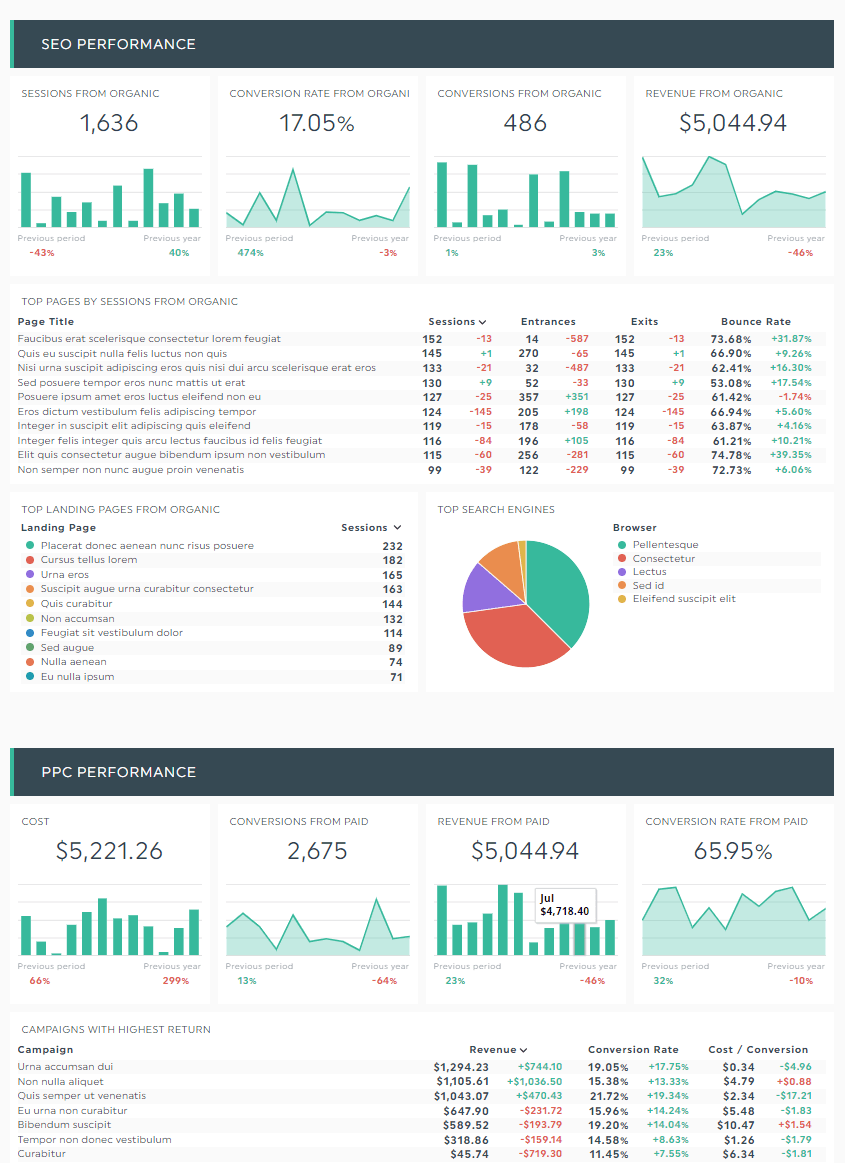
Grab this digital marketing report with your own data!
Automate Your PPC Reporting Today!
By tracking the right PPC metrics, you gain a step closer to hitting your goals while keeping your ad dollars down.
This beginner’s guide recommends the eight most commonly used metrics in PPC ads today. Use them as a starting point, along with a reporting tool to automate the process.
DashThis is the easiest reporting tool. With over 40 integrations, it automatically gathers your entire PPC data across multiple ad platforms into one beautiful report. Pricing starts at $38/month when billed annually. Sign up for your free 15-day trial on DashThis today.
Ready to level up your PPC reporting game?
Read More
Don’t miss out!
Automate your reports!
Bring all your marketing data into one automated report.
Try dashthis for free

