Mastering PPC Results: A Deeper Dive into 5 Key Metrics

When James Wilkinson ran his pay-per-click (PPC) ads for the first time, he only hit an extra five percent in sales.
“Beginners always underestimate the importance of understanding the process and how long it takes to get it right,” laments the CEO of Balance One Supplements.
After a myriad of changes—such as targeting high-intent keywords, analyzing his PPC results religiously, and A/B testing constantly—the CEO doubled his conversion rates, raising profits by 30%.
“Many beginners, like I used to be, obsess over huge site visits. But what I’ve learned as I gained more experience is this: not all traffic is equal.”
Throughout this guide, you’ll see the PPC specialists we speak to share different variations of the same sentiment.
So here’s the question: If more traffic doesn’t drive more sales, what metrics should you focus on?
Let’s find that out.
- Why Beginners Should Embrace PPC Results
- 5 Essential PPC Key Metrics (PLUS Tips from PPC Specialists on How to Improve It)
- How to Track PPC Results with DashThis Confidently
- Automate Your PPC Reporting Today!
Why Beginners Should Embrace PPC Results
Analyzing PPC results can be overwhelming, especially when you’re a beginner. Nonetheless, the pros unquestionably outweigh the cons.
Here's what we mean.
You identify your top-performing assets
Data never lies.
With cold, hard data at your fingertips, you know what works and doesn’t—like the keywords that attract high-quality leads, the ad creatives that drive the most traffic, and the ad placements that get you the most conversions at the lowest average cost.
PPC reporting also impacts your search engine optimization (SEO) efforts and vice versa.
Suppose web visitors have been downloading the annual whitepaper after reading your blog post. You might promote it further with Google Ads’ lead form asset to generate more leads.
You know which creatives to optimize
Sometimes all it takes is one minor change to make a big, drastic difference.
After only changing an ad’s headline, Trio SEO increased its purchase rate by 2-3% and return on ad spend (ROAS) by 37%.
“Those small gains compounded into huge profitability differences,” recalls Connor Gillivan, the founder and CEO of the SEO agency. “Looking under the hood with split testing is how you truly maximize the power of paid channels.”
Get rigorous with your A/B testing for better engagement. Whether it’s the ad copy, targeting, bid adjustments, or landing page experiences, optimize the control-beating creative to unlock bigger breakthroughs.
You know where to put your money in
Higher budget doesn’t equate to better ad performance.
While budget plays a role, explains Ashley Rector, founder of Quimbly Digital, it doesn’t necessarily drive success. Rather, it’s “the strategic allocation of the budget, targeting, and creative execution” that improves your PPC advertising results.
“It’s critical to emphasize quality over quantity,” says Rector. “Focus on well-targeted campaigns and compelling ad creatives that resonate with the audience, rather than simply pouring more money into your ads.”
Identify your winning ads. Once you spot the ads where you can simultaneously scale 2-3X your budget and meet your KPIs, double down on them.
5 Essential PPC Key Metrics (PLUS Tips from PPC Specialists on How to Improve It)
These five key performance indicators (KPIs) and metrics work across the funnel. Measure them today to see how close you are at generating leads and sales.
Click-through rate (CTR)
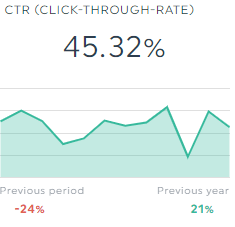
What it is: % of clicks an ad receives from all users who see it
How to calculate it: (number of ad clicks / total number of times the ad is shown) x 100%
How to improve it:
👉🏼 Include ad extensions to provide more information for potential customers
High CTR doesn’t always lead to conversions.
In Dmitriy Shelepin’s experience, solely depending on CTR risks you “overlooking the quality of traffic and the actual conversion rate.”
Instead, the CEO and head of SEO at Miromind focuses on ad copy that resonates with his target audience before ending with a strong call to action.
But the tactic that truly hit the jackpot was ad extensions. By enhancing the ads visibility and providing more information for potential customers to choose from, Shelepin increased his campaigns CTR by 15%.
To interpret your CTR data, analyze the number of times your ad was shown vs. the number of times the ad extensions were shown along with the ad. From there, you can compare how these different extensions perform—say sitelink and structured snippets—and determine which performs best.
Cost per click (CPC)
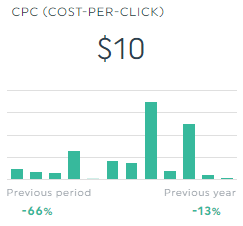
What it is: price paid for each ad click. Not to be confused with cost per acquisition (CPA), which tracks the price paid for each customer acquired.
How to calculate it: total advertising cost / number of clicks generated
How to improve it:
👉🏼 Measure the value of each click and adjust accordingly
Don’t be alarmed by high CPC.
While lower CPC often leads to a higher return on ad spend, as Laia Quintana, head of marketing and sales at TeamUp, explains, it’s crucial to understand that the value derived from a click can vary significantly.
“A higher CPC for a keyword that consistently leads to conversions is more valuable than a lower CPC for a keyword that rarely converts.”
Lilia Tovbin, founder and CEO of BigMailer, echoes the sentiment.
“Not all clicks lead to meaningful actions like purchases or leads,” says Tovbin. “Direct your efforts towards high-quality clicks to improve your PPC campaigns. It’ll lead to better conversion scores and return on investment.”
Conversion rate
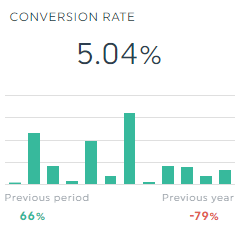
What it is: % of users who completed an action measured against the total number of visitors over a time period.
How to calculate it: (number of conversions / total number of people visited your website or landing page) x 100%
How to improve it:
👉🏼 Adjust bids on certain devices and exclude low-converting locations
This is especially important if you use manual CPC bidding, which is often the case for lead generation campaigns with a small addressable market but a high value per lead.
After discovering his B2B industrial client seeing lower conversions on mobile devices,* Nick Gibson, a PPC specialist, deduced that it was likely due to a difference in intent. It makes perfect sense, because the client’s service is something you’d only purchase as part of a big company.
“People searching from a mobile device have research purposes, whereas people searching from their work computers have buying intent,” explains Gibson.
“Excluding mobile devices allowed us to allocate more of their ad spend towards computer users, which increased conversion rate and reduced their cost per conversion significantly.”
Using these tactics, Gibson consistently achieves an immediate 30-50% increase in conversion rate and return on ad spend for clients.
*The client’s website was designed specifically with mobile usability in mind, so it’s unlikely the user’s experience caused the low conversions.
Quality score
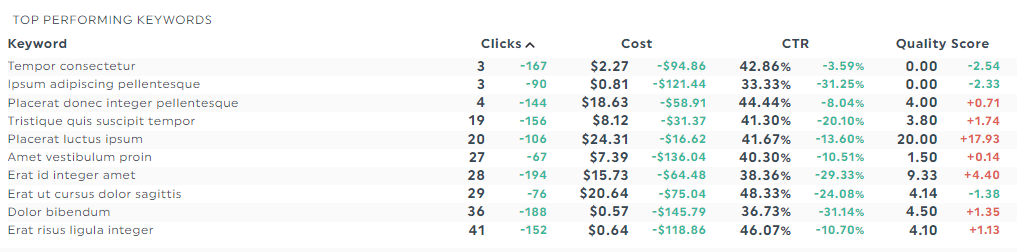
What it is: a diagnostic tool that measures your ad quality against other advertisers on a scale from 1 to 10. Ads with high Quality Score run cheaper and boast better placements. Aim for a score between 7 to 10 to stay visible.
How to improve it:
👉🏼 Improve landing page experience and ad relevance
Google prioritizes user-friendliness.
If an ad is the best option for customers, it will cause less expensive clicks and allow you to stretch your ad budget even further.
Hence, as Kevin Miller, an SEO expert, explains it for us, checking your ads relevance score, improving landing pages to match ads, and creating ad groups that can be tightly categorized, “will hit upon those Google metrics and result in a lower CPC.”
The higher the Quality Score, the lower your CPC, the better your ROAS.
Return on ad spend (ROAS)
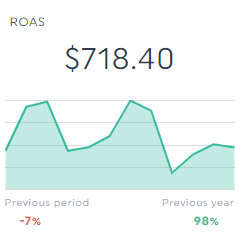
What it is: revenue you gain for each dollar spent on advertising.
How to calculate it: (total revenue / total ad spend) x 100%
How to improve it:
👉🏼 Implement a tiered re-marketing strategy
Start by segmenting your audience based on their interaction with your website or ads, like:
(i) Group A: viewed a product but didn’t add to cart
(ii) Group B: added an item to cart but didn’t complete checkout
Tailor your ad creatives and offers in each segment, gradually increasing the incentive for customers closer to the finish line. For example, you might offer a $5 discount for bottom-of-the-funnel customers who abandoned their carts.
“This personalized approach not only boosts engagement,” says Ashley Rector, founder of Quimbly Digital.
“It also significantly improves ROAS by targeting users more likely to convert, thus ensuring your ad spend is as efficient as possible.”
How to Track PPC Results with DashThis Confidently
DashThis is the easiest reporting tool for your marketing agency.
Automatically gather all your PPC ads into one beautiful report.
Our tool integrates with all major PPC advertising platforms—Google Ads, Microsoft Ads (formerly Bing Ads), you name it. DashThis also connects with other digital marketing channels, like Google Analytics and MailChimp; and social media platforms like LinkedIn and Facebook.
This means that you can easily create a standalone PPC strategy report or an all-in-one marketing campaign performance dashboard in one place.
Complete these steps to create a PPC marketing report on DashThis:
- Select a PPC report template
- Connect your PPC advertising platforms
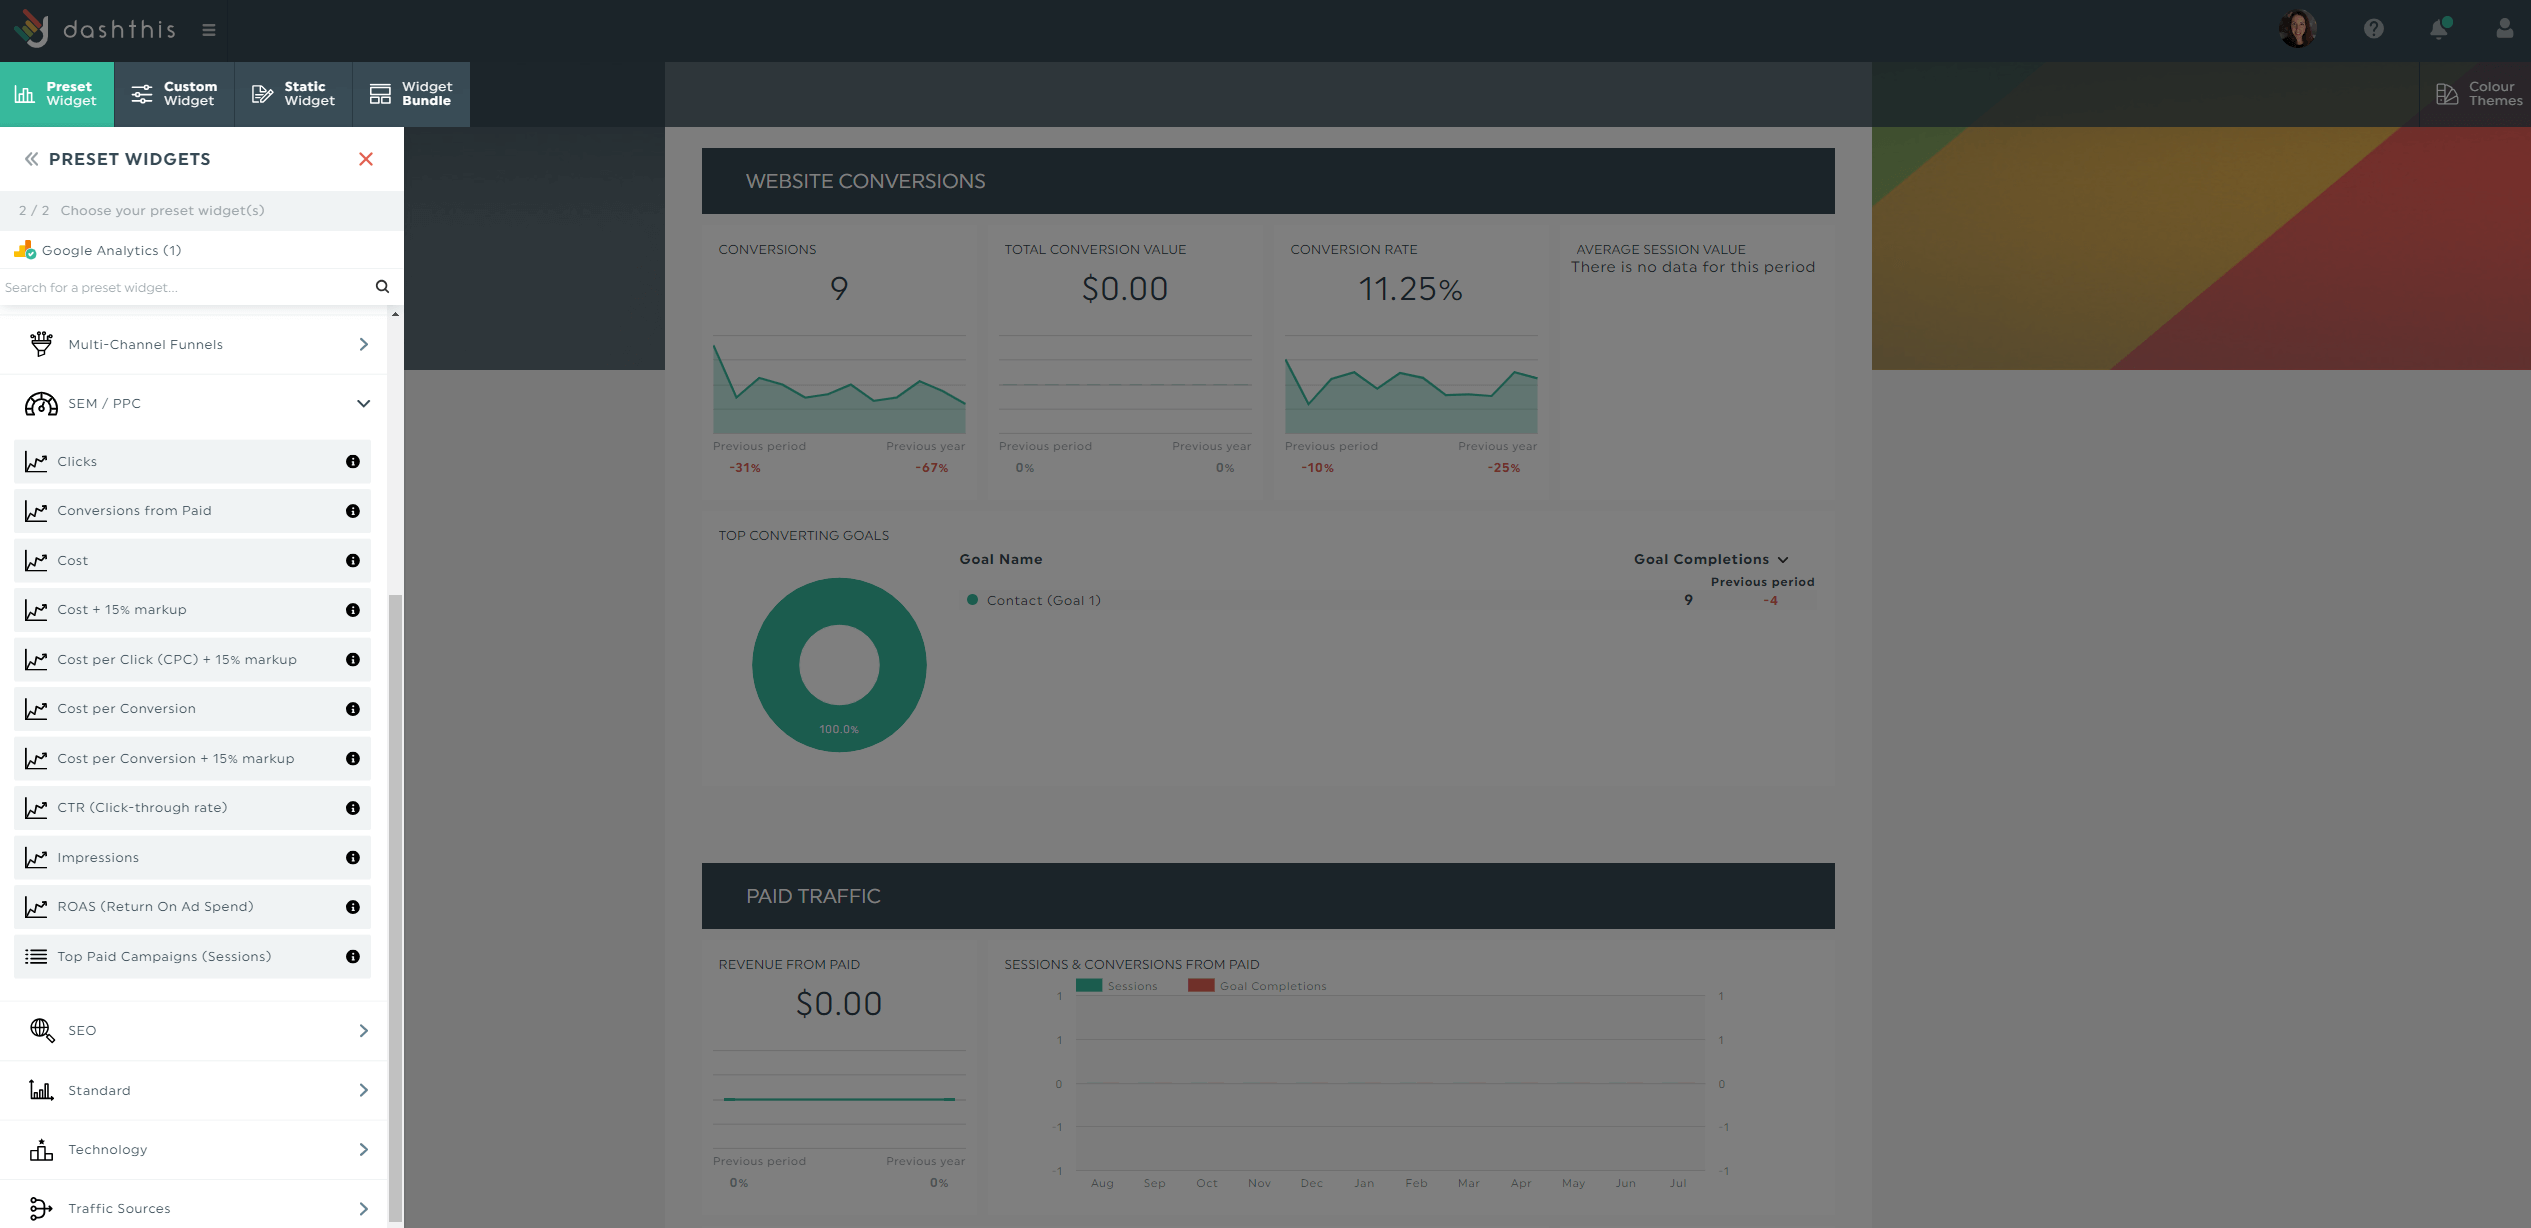
- Pick your metrics in Preset Widget
DashThis will automatically grab the metrics you selected into the dashboard. Drag and drop the auto-created graphs and charts as you desire.
Customize the PPC dashboard to fit every client’s unique needs.
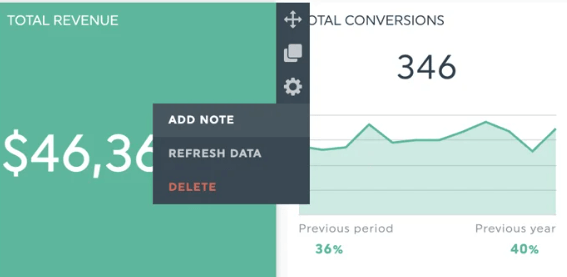
If you work with a client without any PPC knowledge, consider using our notes widget to provide contextual information.
Let’s say you want to make the case about tailoring the ads to small businesses, an untapped customer segment. Or you want to define what SERP means. Or you want to explain how top ad rankings in Google search impact conversions and the total revenue.
Hover to the metric and click Add Note > Save.
If a long explanation is needed, opt for the comment widget.
Click Static Widget > Comment > Save.
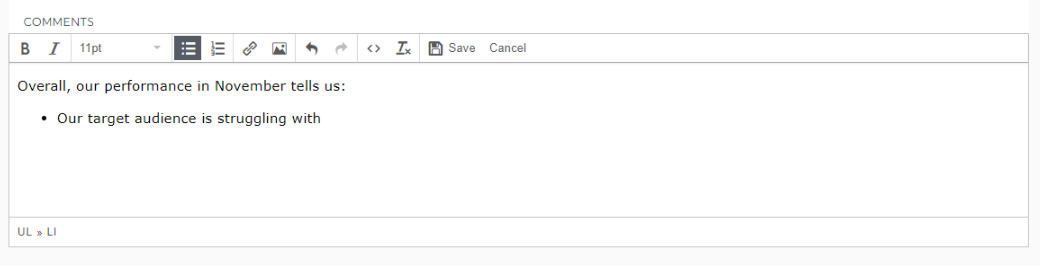
Here, you can recommend the next steps—like how you plan to optimize the messaging for next week’s ads or how you'll target specific demographics with bidding strategies.
Once you’re satisfied with the report, schedule an automated email dispatch. With this approach, you no longer need to manually send and update the reports for every campaign.
Here’s how it works:
- Hover to the Sharing Options icon on the top right
- Click Share by Email
- Set the dashboard period and frequency
- Click Schedule
You can also add a note and include the report as a PDF attachment.
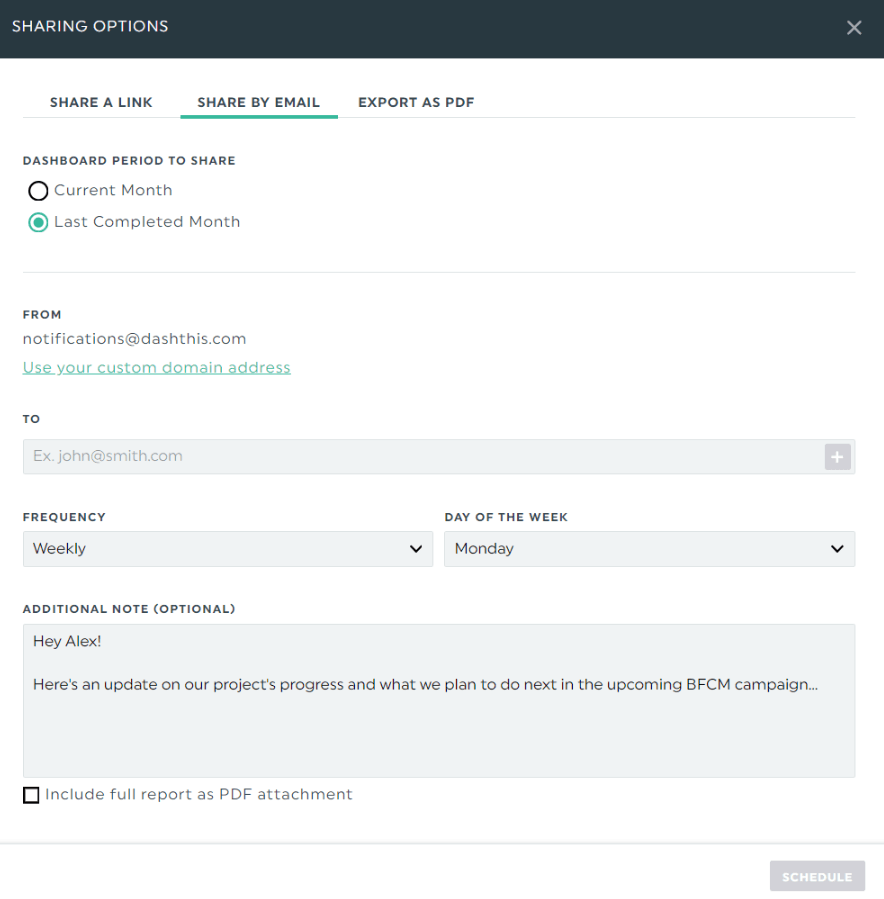
Alternatively, send over a shareable URL link.
Advertising campaign report template
This ad campaigns report’s got it all.
Track the overall marketing ROI across Google, Facebook, and LinkedIn Ads. You can even go granular, comparing conversions and click-through rates between search ads and display ads.
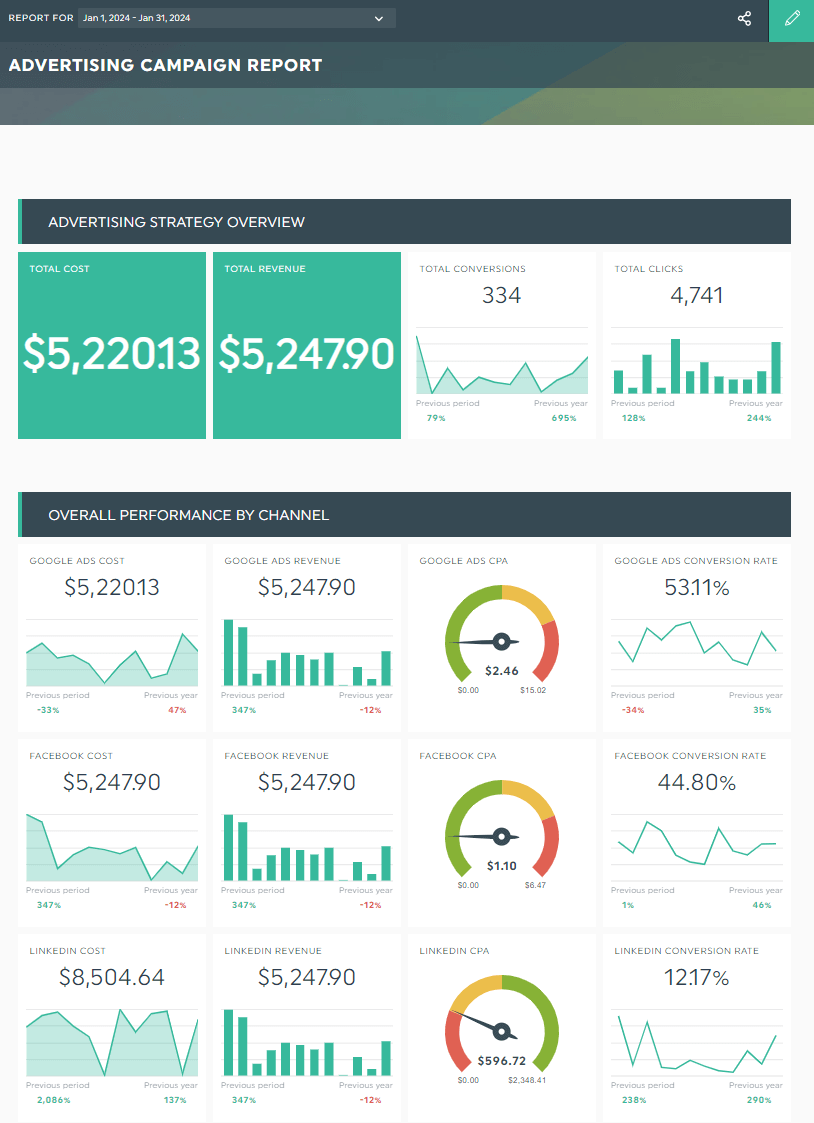
Grab this advertising campaign report template with your own data!
Automate Your PPC Reporting Today!
No traffic is equal.
If you’re seeing high traffic but zero conversions, consider adjusting your PPC strategy using the tactics we share above. Hopefully, along the way, you’ll simultaneously reduce your CPC and raise your ROAS.
DashThis is the easiest reporting tool. Combine your entire PPC performance across Google, Facebook, LinkedIn, and more into one beautiful report. Start your 15-day free trial today.

Ready to start tracking your PPC results?
Read More

Don’t miss out!
Follow us on social media to stay tuned!
Automate your reports!
Bring all your marketing data into one automated report.
Try dashthis for free