How to easily share your Google Analytics dashboard - a step-by-step guide

What are people doing on my website?
Do people find my website content interesting? Are they converting?
With over 35 million sites using Google Analytics in 2022, Google Analytics is one of the top ways to answer those questions. But analyzing its data takes time and effort - time your clients may not have.
As you work with your clients, you need to share that data with your clients or team members to either show the benefits of your work or make campaign improvement decisions.
Fortunately, Google Analytics offers some methods to share your data with others, which we’ll go over here.
What is a Google Analytics dashboard?
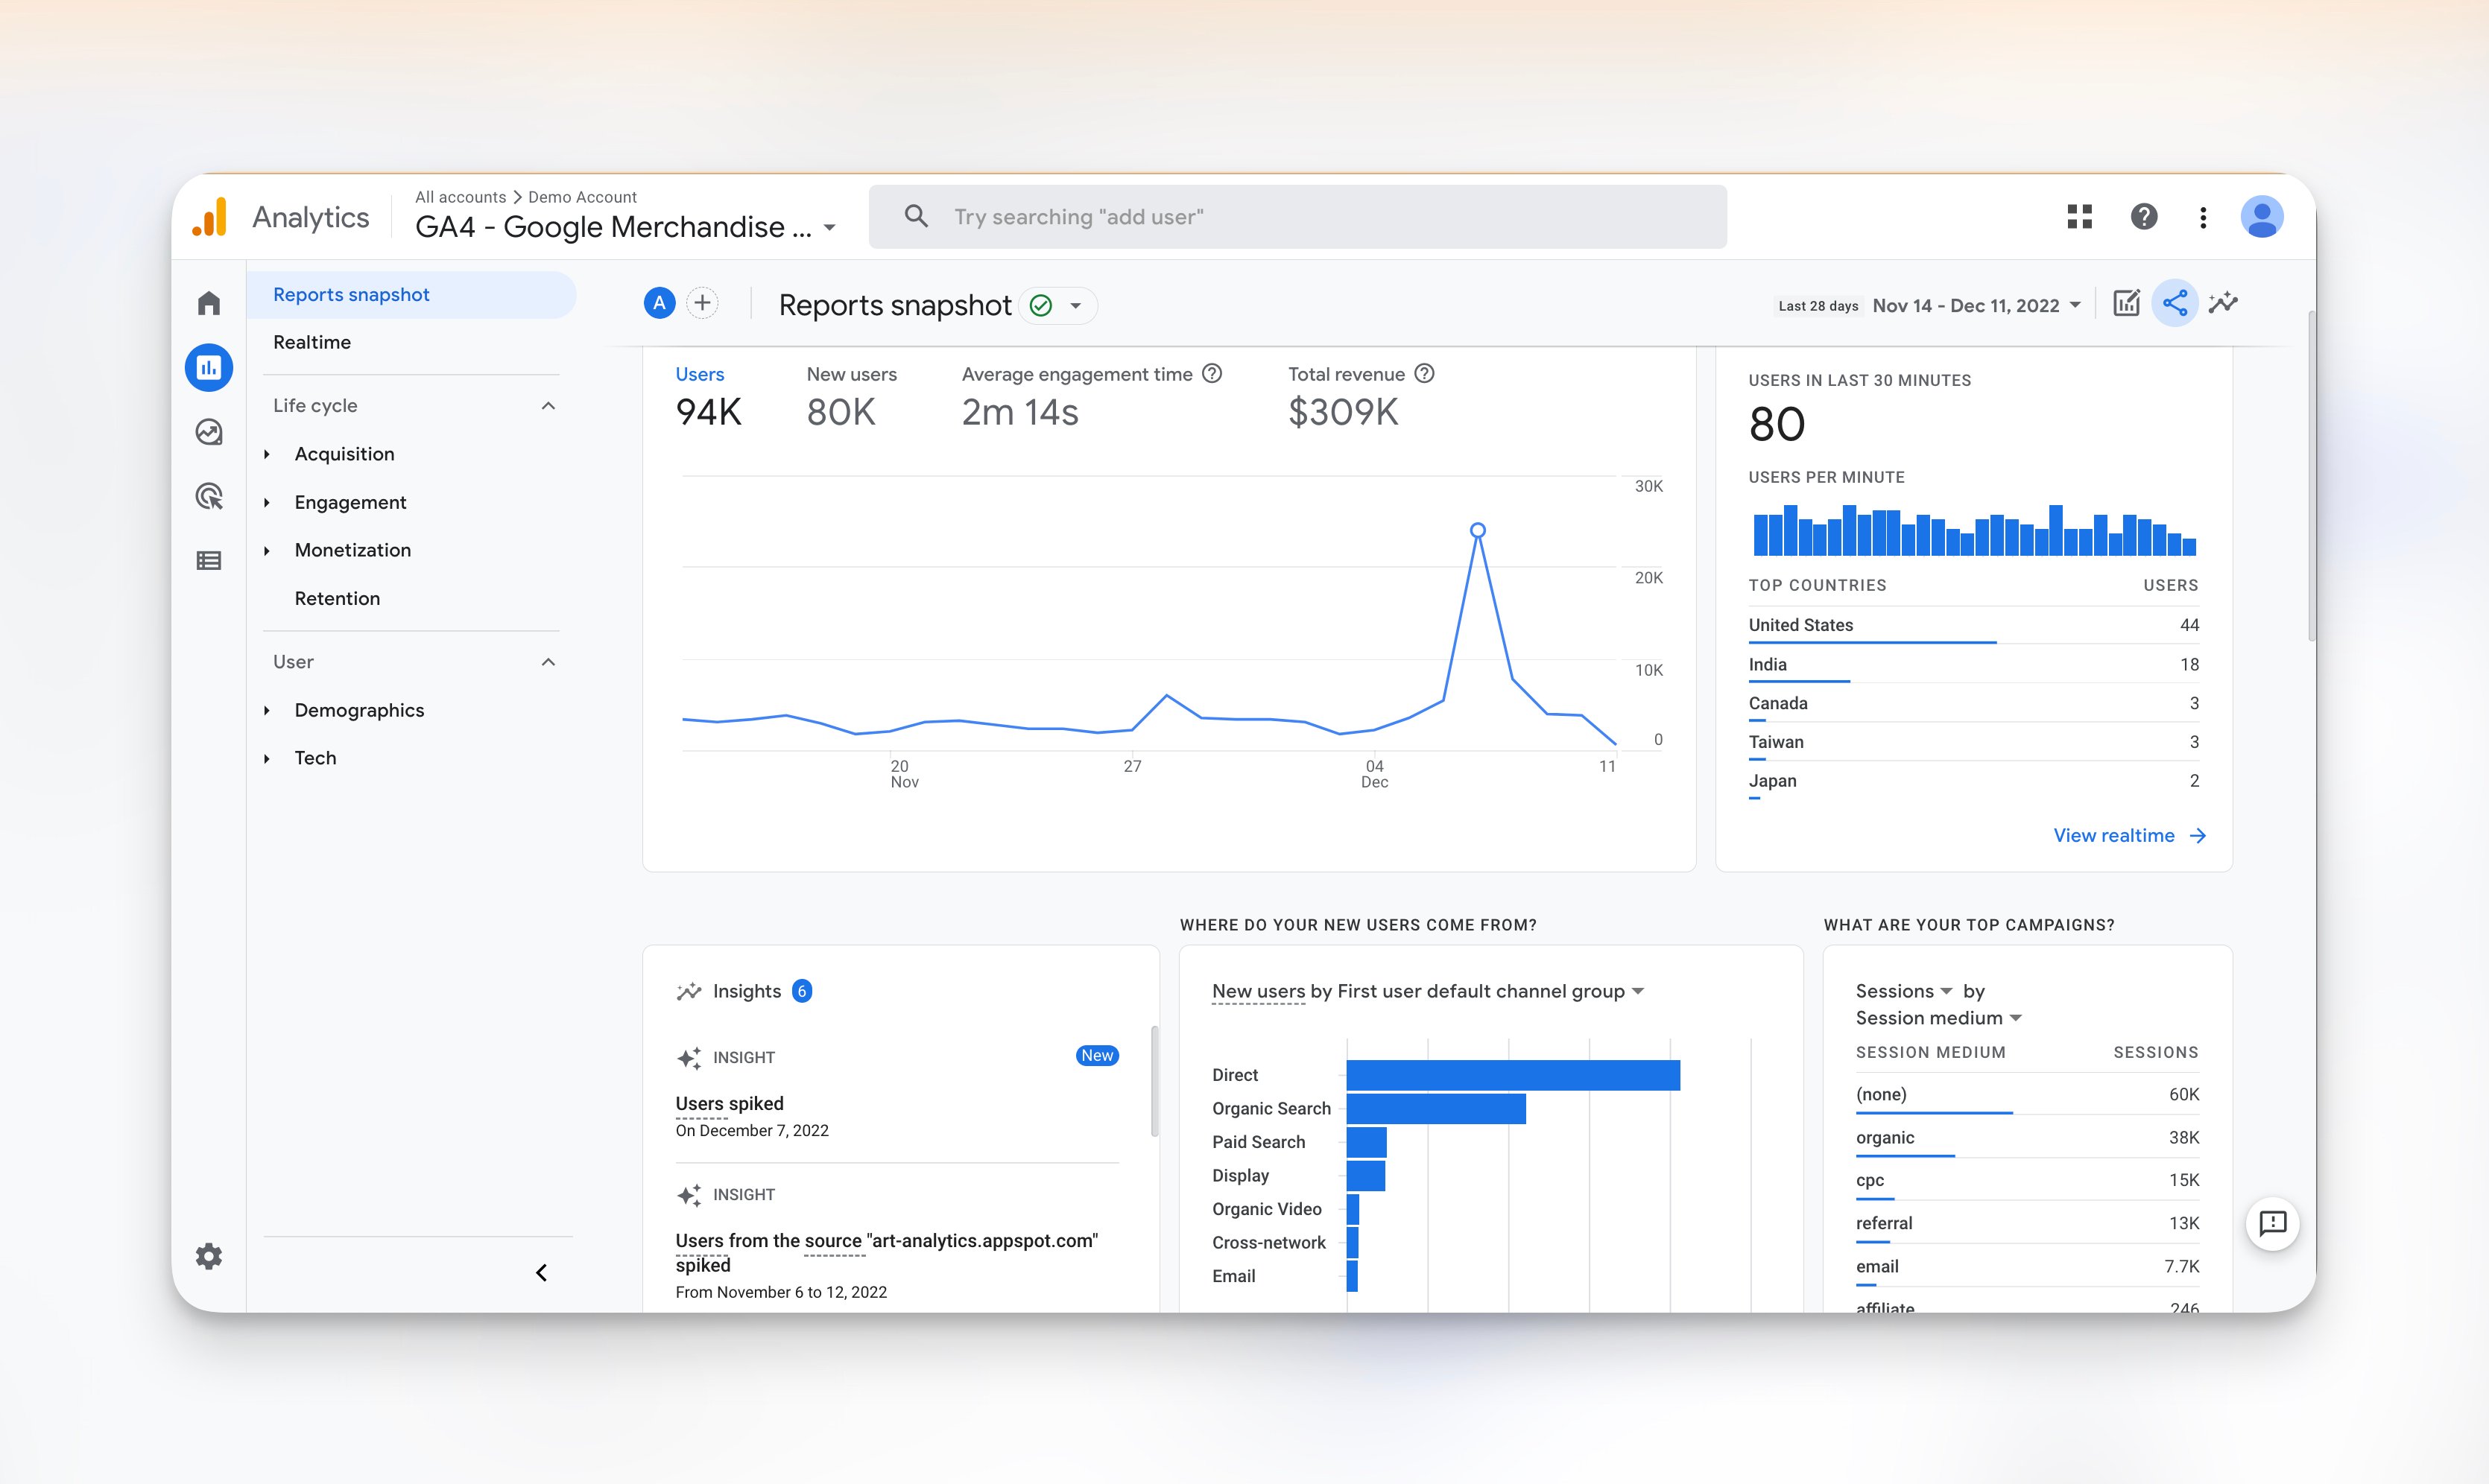
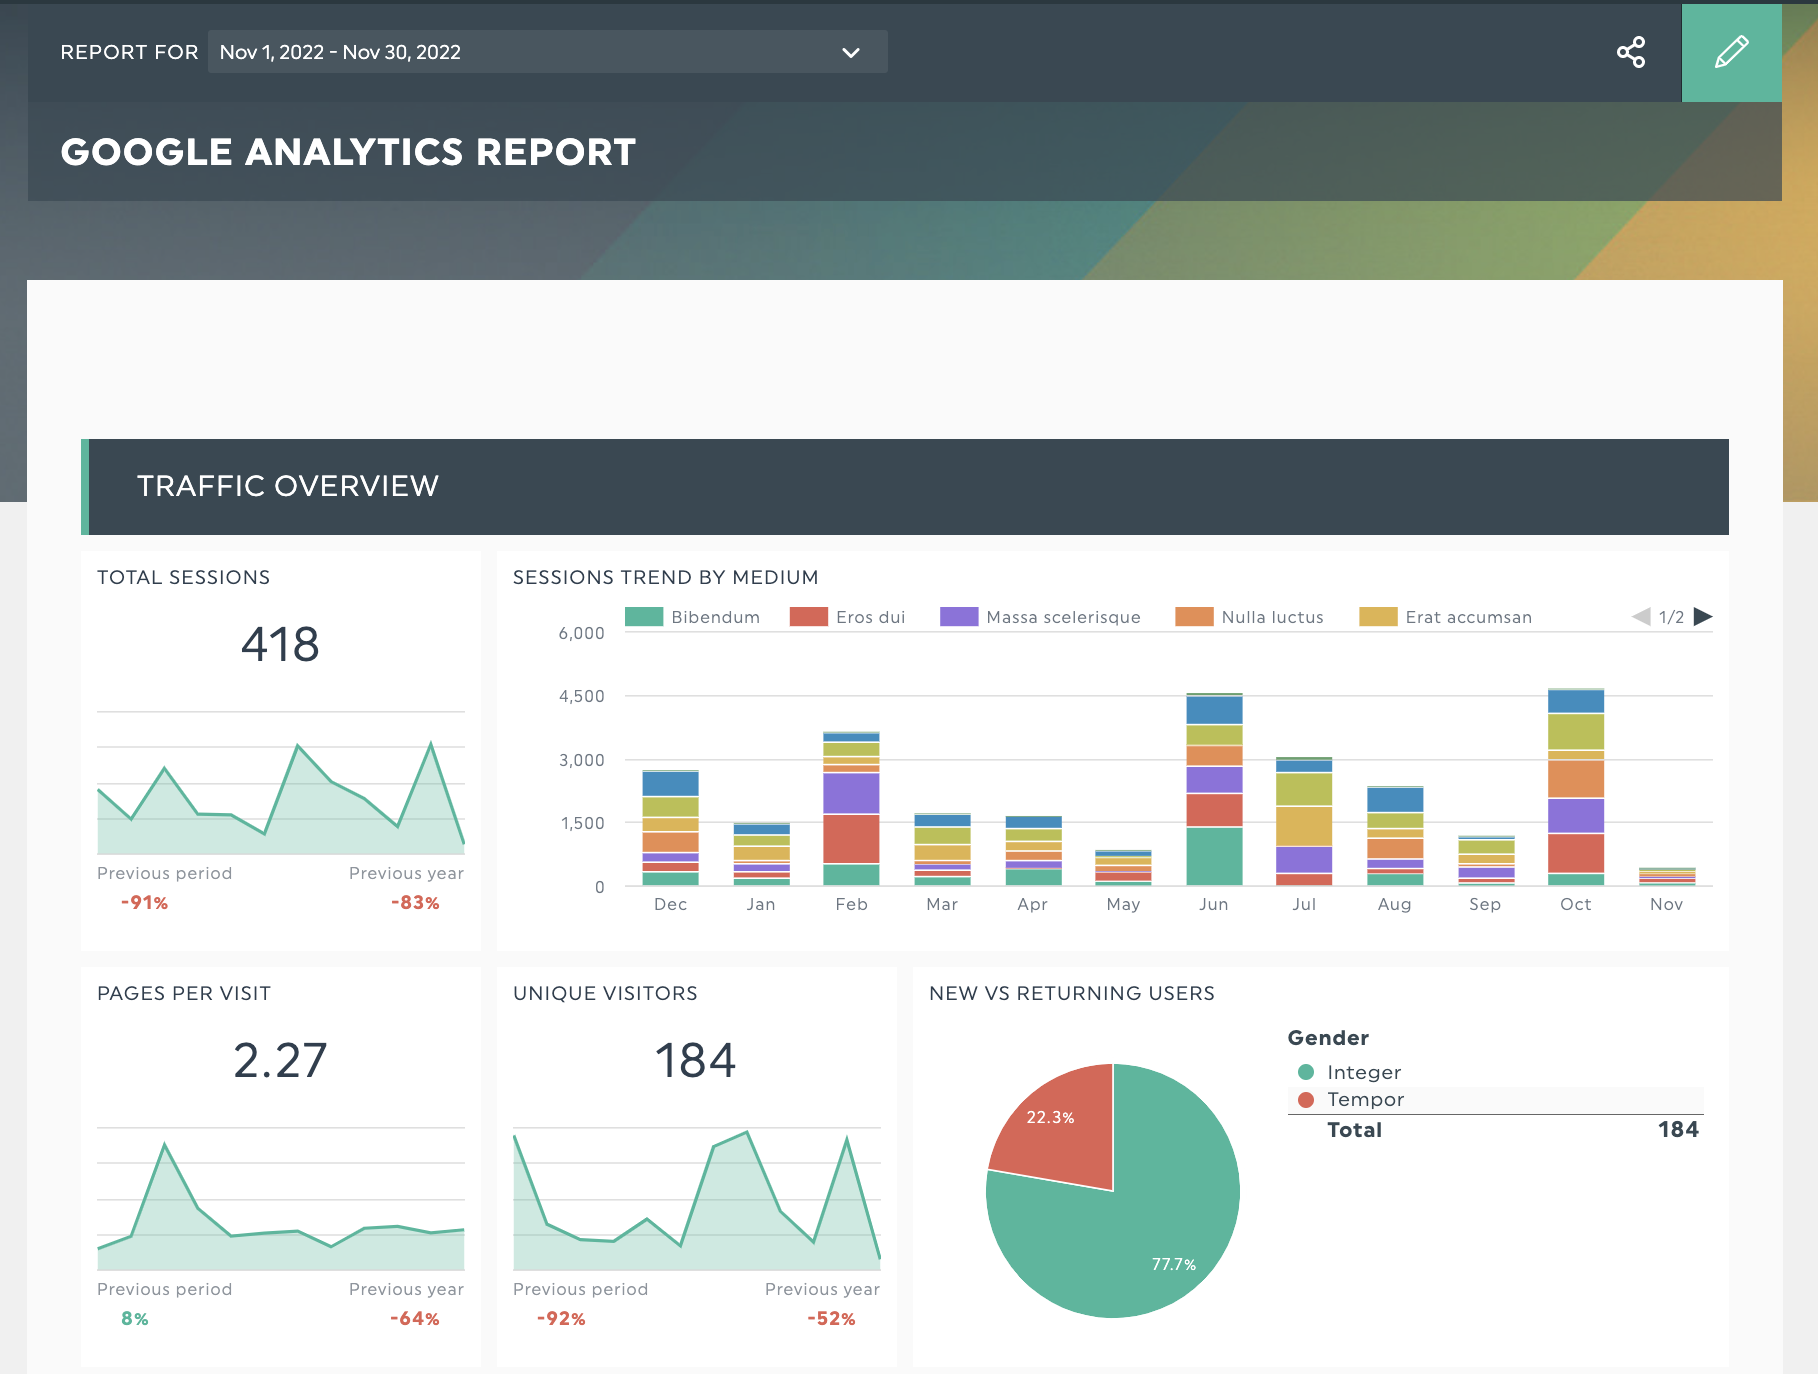
Screenshot from Google Analytics - a collection of widgets that helps you visualize how your website is performing
A Google Analytics dashboard takes all the data about your website performance and visualizes it in a neat dashboard.
You’ll be able to answer questions like:
- How many new visitors came from organic search in the last month?
- Which campaigns are performing better?
- When did my website see the highest traffic volumes over the last month?
You can even slice and dice your data points to do comparisons for deeper data analysis or to answer different questions. Let’s say you’re an e-commerce store in Vancouver and want to analyze your web performance.
Some things you can do here:
- How many visitors added a product to cart but didn’t purchase it?
- What percentage of our web visitors come from Toronto?
- What percentage of our total visitors abandoned a cart?
You can do much with Google Analytics if you know how to use it.
Once you’ve done your analysis, your next step is to share your dashboard with your client, team member, or stakeholder. Here’s how to do it with Google Analytics and the pros and cons of each method.
How to share a Google Analytics dashboard in Google Analytics 4 - a step-by-step tutorial
Method 1: Export Google Analytics report to PDF or CSV formats
From your Reports snapshot, click on the Share button > Download File
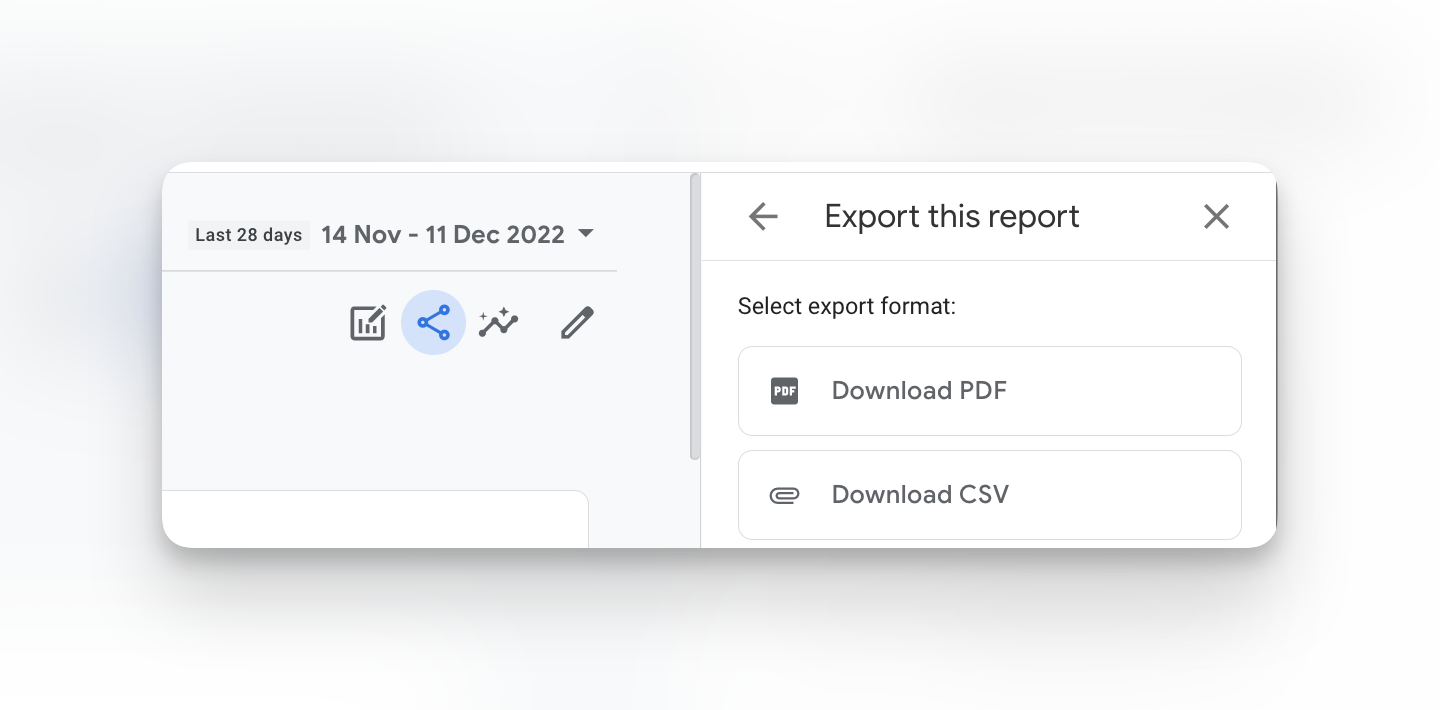
The export method is the simplest but is also the most demanding on you as an analyst. If you’re preparing for a client presentation, you still need to check the raw data, add formatting and provide context to make data useful for your client - a time-consuming process.
Pros:
- Straightforward export of information that can be sent via email or a messaging platform
Cons:
- PDF and CSV files are static - meaning data won’t be updated in real-time
- Raw data exports aren’t client-presentation ready and need work in Excel or Google Sheets to make the data presentable and relevant to your client or stakeholder.
Method 2: Sharing a custom dashboard link in Google Analytics
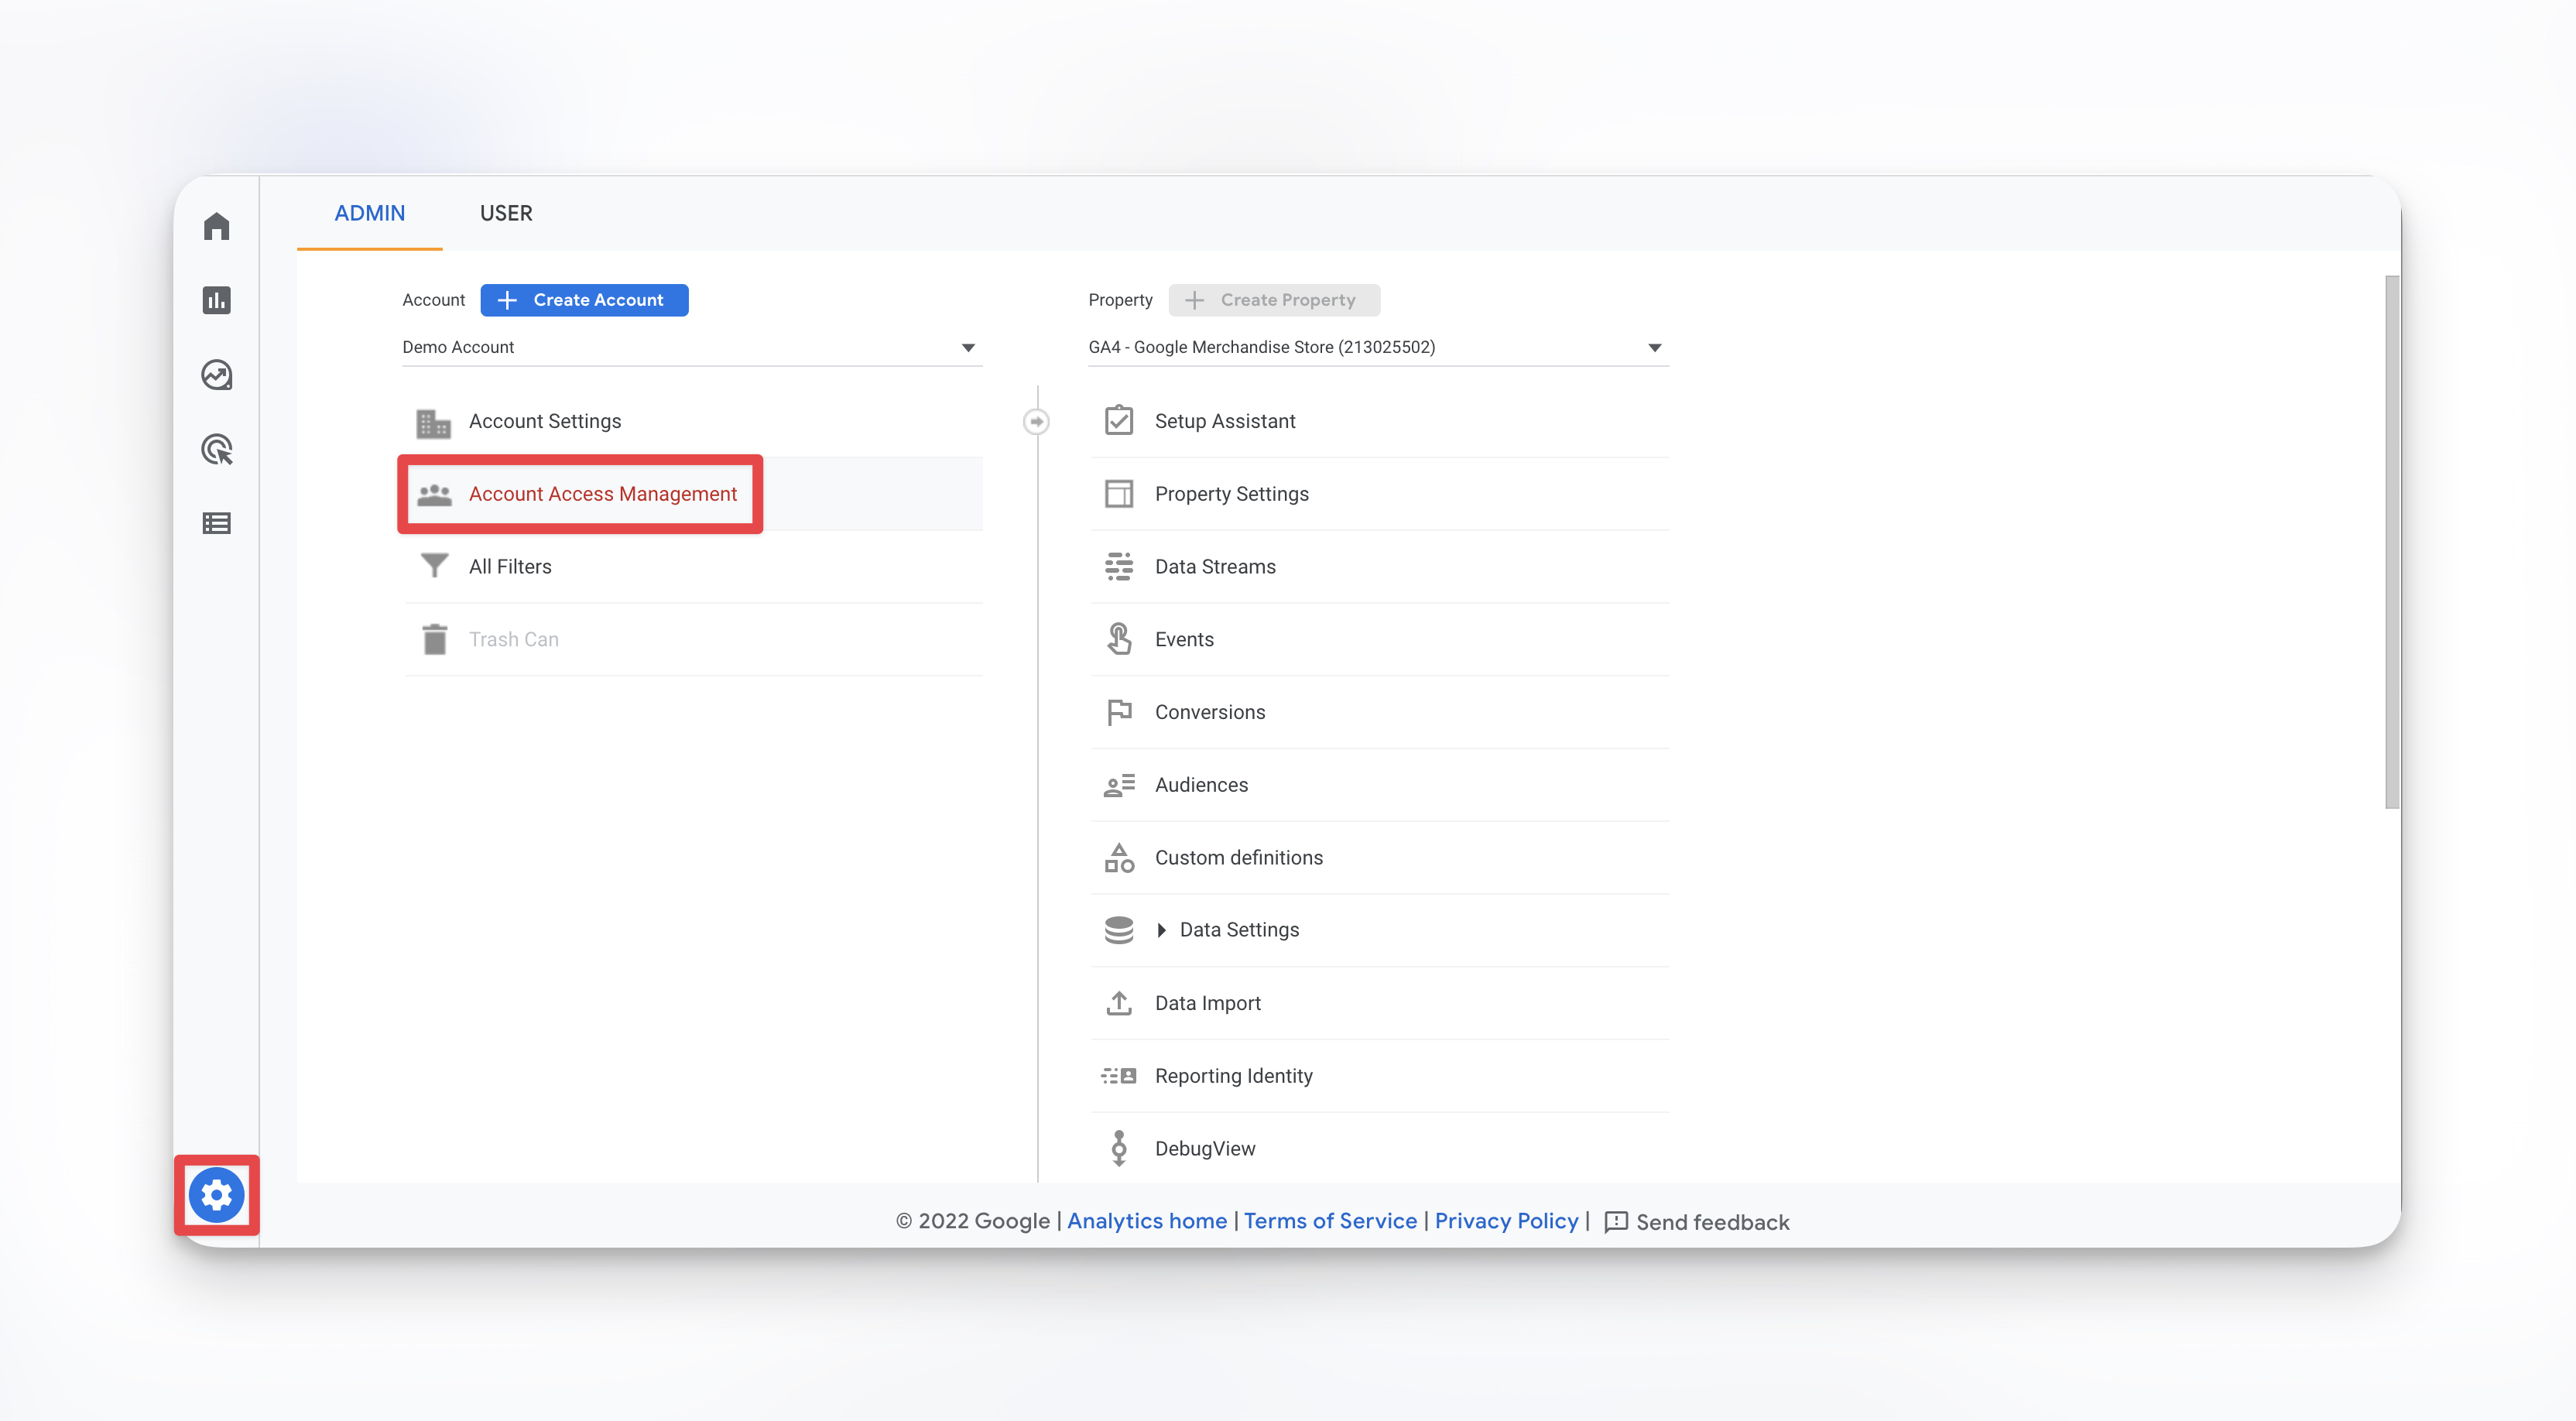
Step 1: Ensure the person you want to share the private dashboard with has user permissions to see it at the right account, property, or view level.
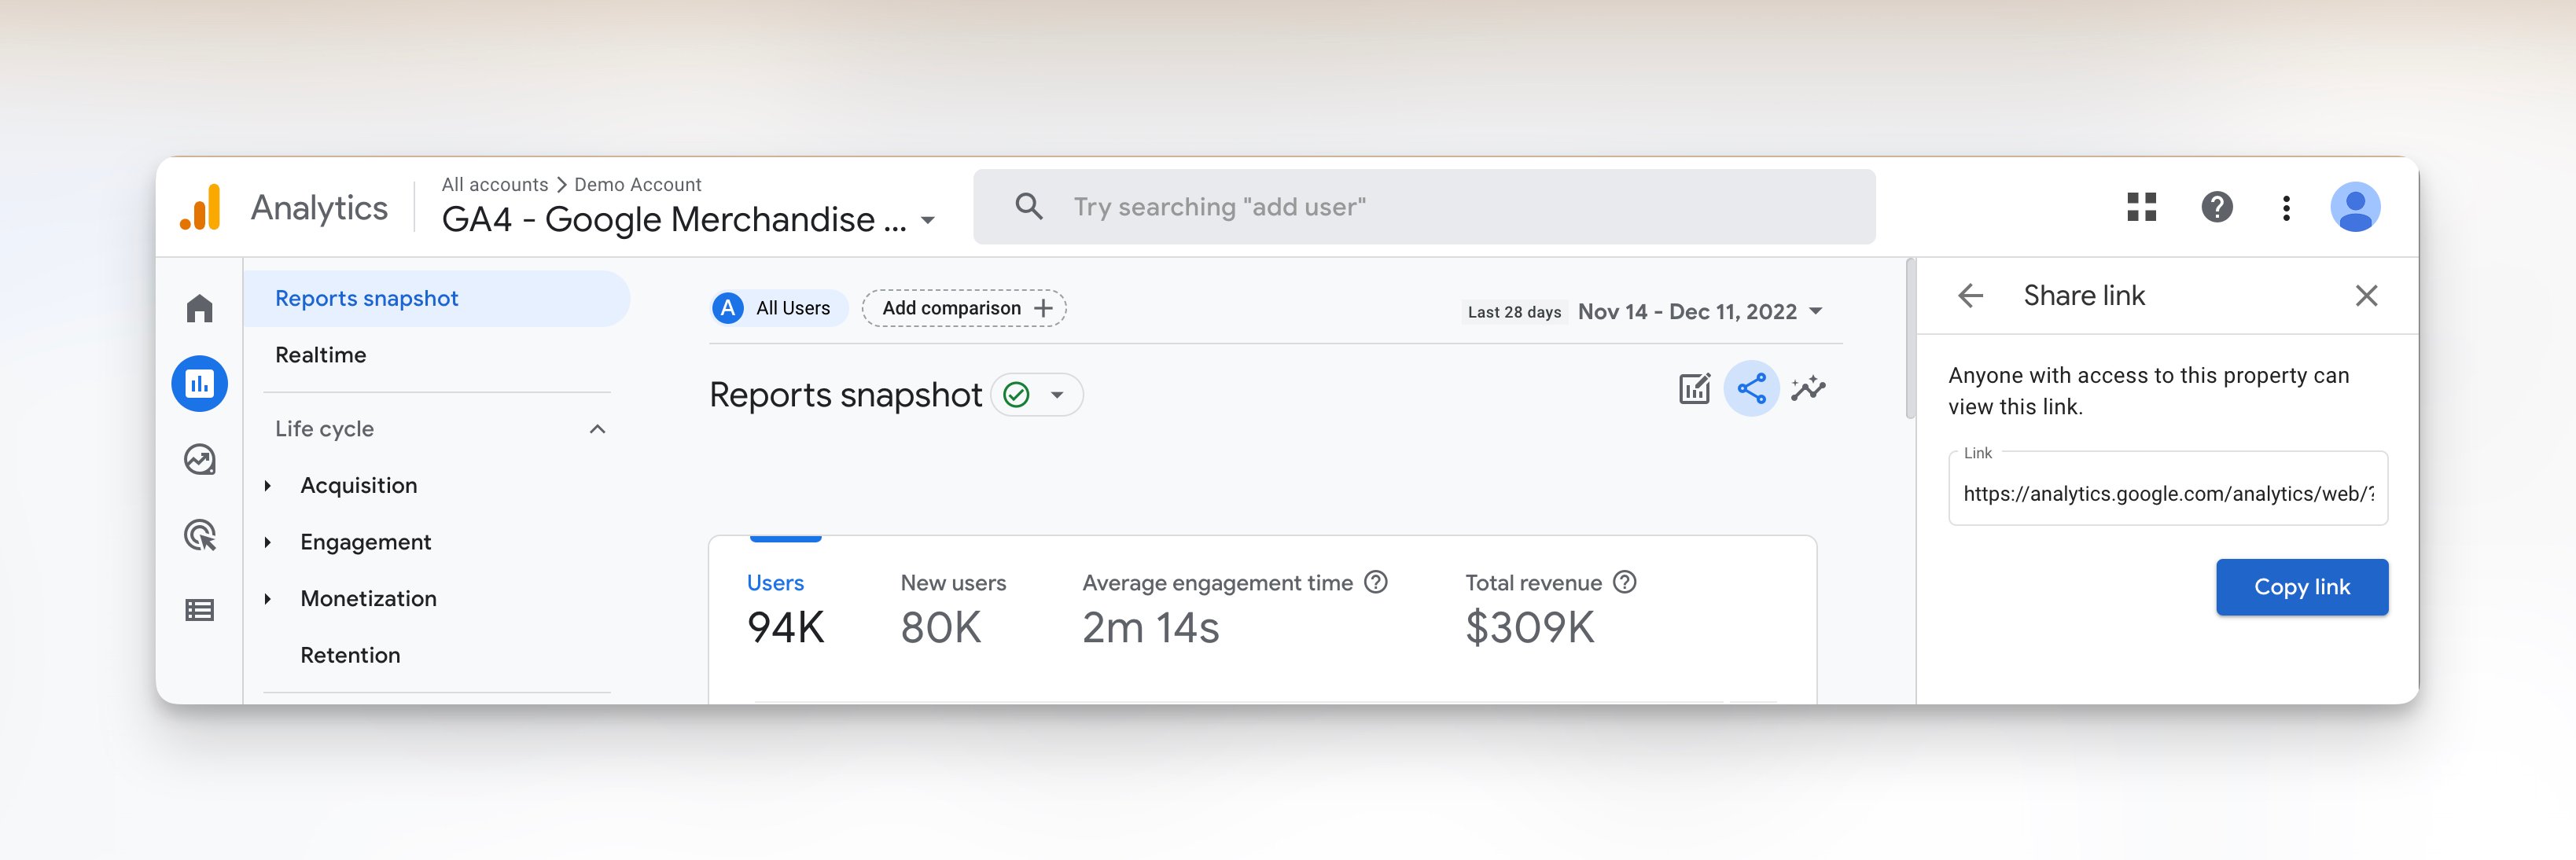
Step 2: To share template link: Click on the share button on the top right-hand side of your report.
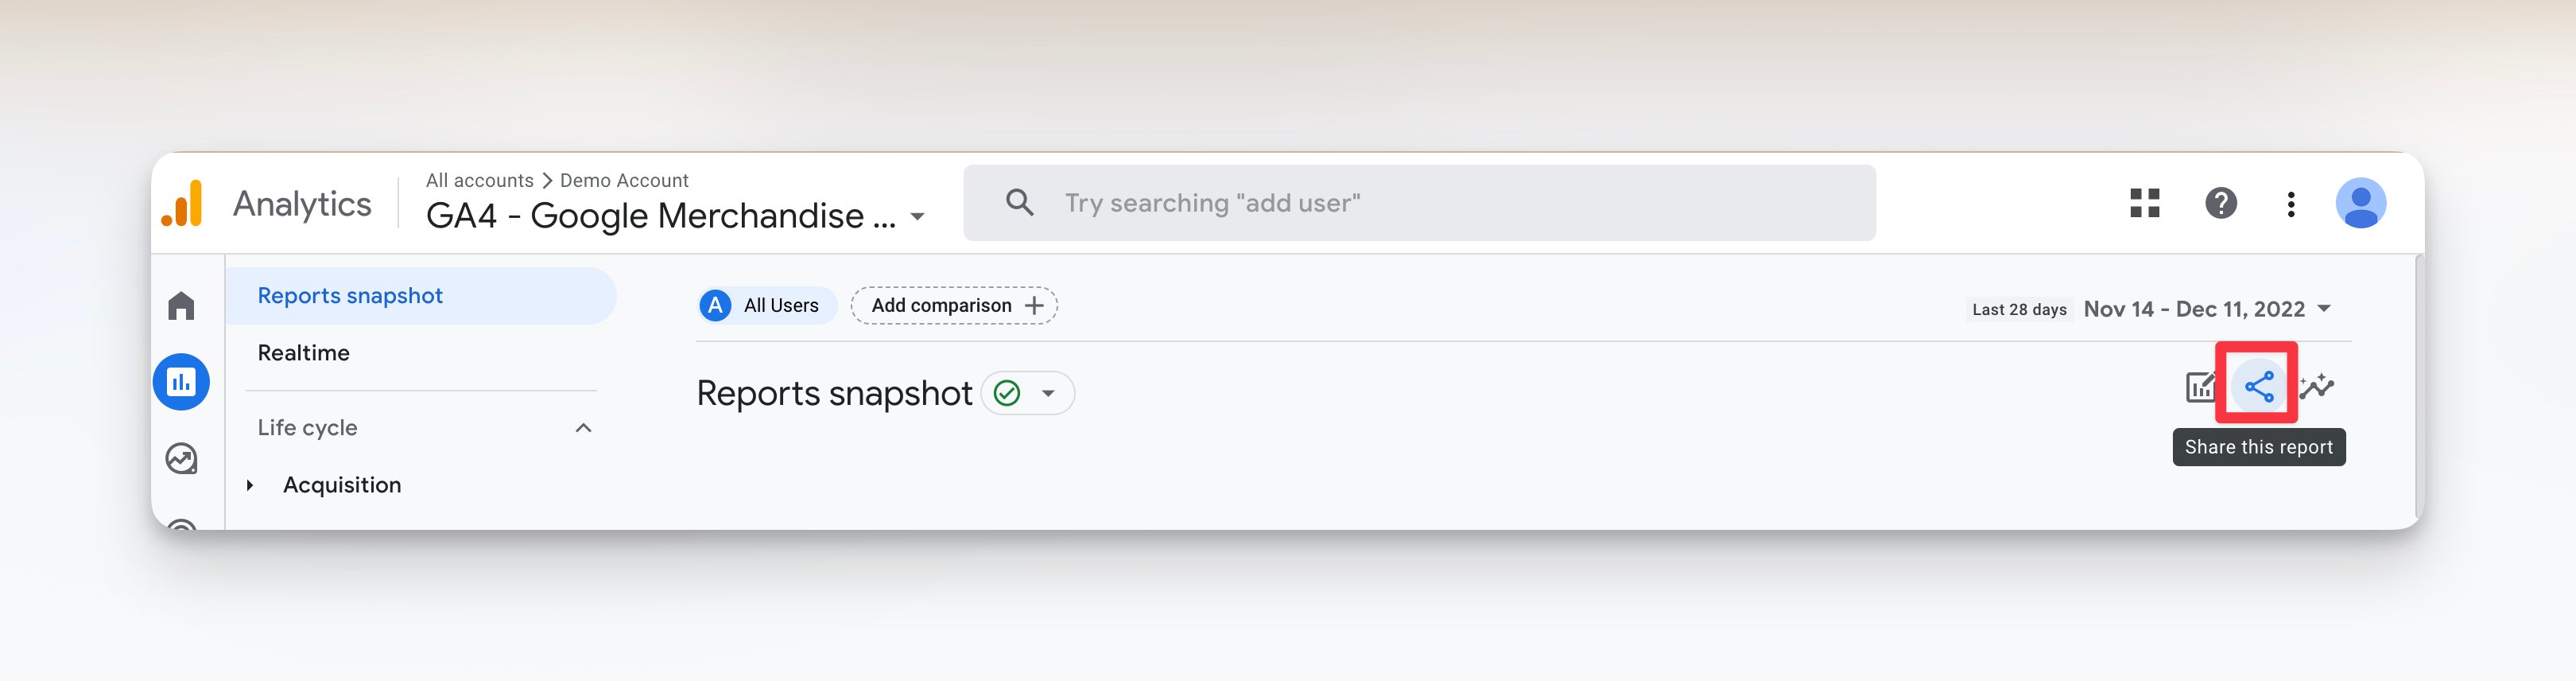
Step 3: Click on Share Link to generate a link to view this shared dashboard.
Google Analytics is also transitioning to Google Analytics 4, which means Universal Analytics (UA) properties will stop processing new hits from 1st July 2023.
Not sure what this all means? Check out our guide comparing GA4 with Universal Analytics.
Pros:
- Easy to share your report - generate a link, and you’re done
- Dashboard is automatically updated in real-time
Cons:
- Cannot write annotations or contextualize the data
- Only covers Google Analytics data, so if you want to review other marketing tools, you’ll need to export your data from different tools or somehow combine these dashboards into one place
- Lacks visual customization options.
Method 3: Give access to your Google Analytics account
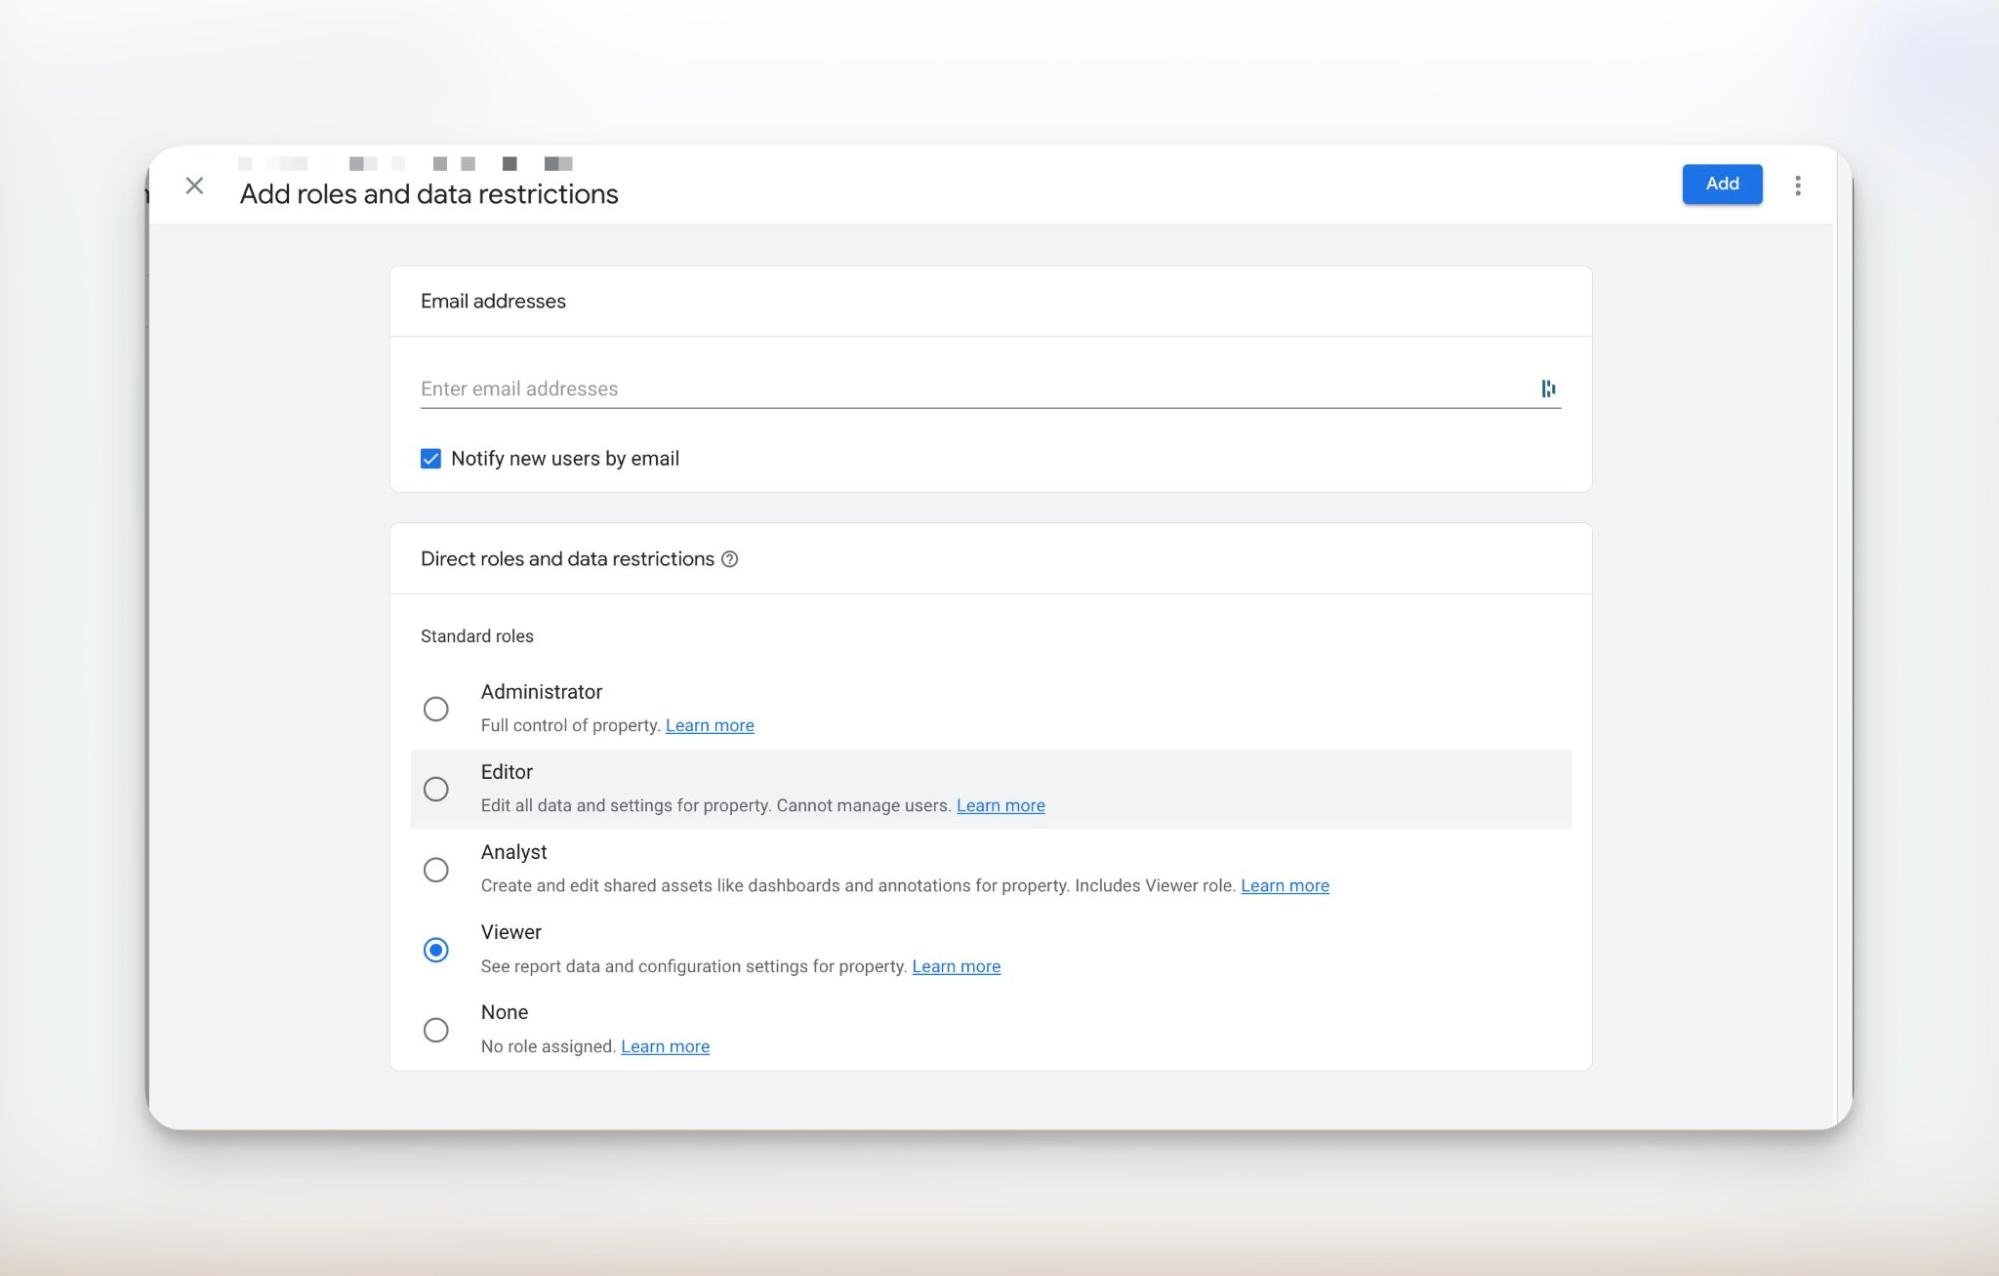
Giving access to your account is a quick way to allow people to review your account data and stay on the same page during client presentations. But you also want to ensure each person you add has the right permissions to minimize security risks.
Pros
- Dashboards update in real-time, ensuring data is always up to date
- People can review and adjust the dashboard without your input
Cons
- User management and granting permissions can be tedious
- Someone you're giving access to must be familiar with Google Analytics.
- You’ll need admin permissions for your Google Analytics account to share access
A better way: How to build (and share) a Google Analytics dashboard with DashThis
The sharing options in Google Analytics work well if you want a direct export of GA data to analyze further or to discuss during client presentations.
There are a few limitations to this approach, though:
- What if you want to add commentary or context about specific metrics?
- What if Google Analytics data only forms one part of your reporting process? Besides website data, how do you combine social media data and paid advertising campaign data into the same dashboard, for instance?
- What if you want to add a bit of design flair to your Google Analytics dashboards, like adding your agency’s brand colors to your client dashboard?
All these 3 issues can be solved using an automated reporting tool like DashThis! Here’s how.
- Notes and comments allow you to add valuable context to your widgets or dashboards.
This functionality is great for summarizing key points, giving an executive summary of your report, explaining anomalies, and giving helpful context to a metric or graph.
All these little touches help connect your data with a critical recommendation, making your Google Analytics dashboard data clearer and more actionable. You can add images or screenshots from other tools (like a widget from your Google Analytics dashboard) as supporting information or propose next steps or recommendations to improve a KPI.
To embed a comment box in your DashThis report, go to Static Widget > Comments
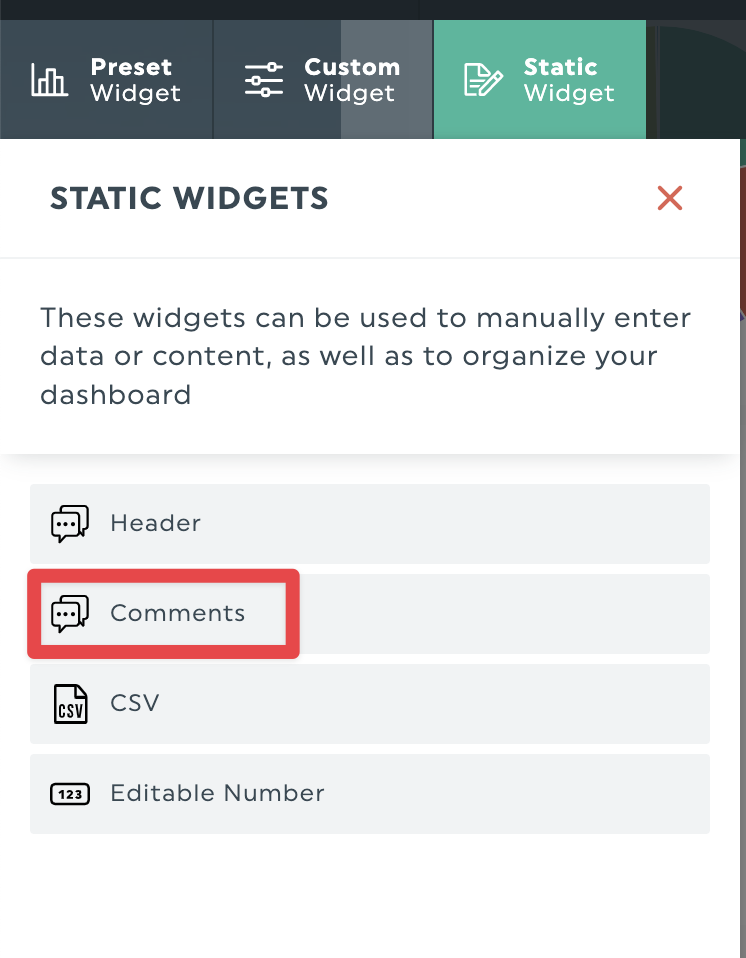
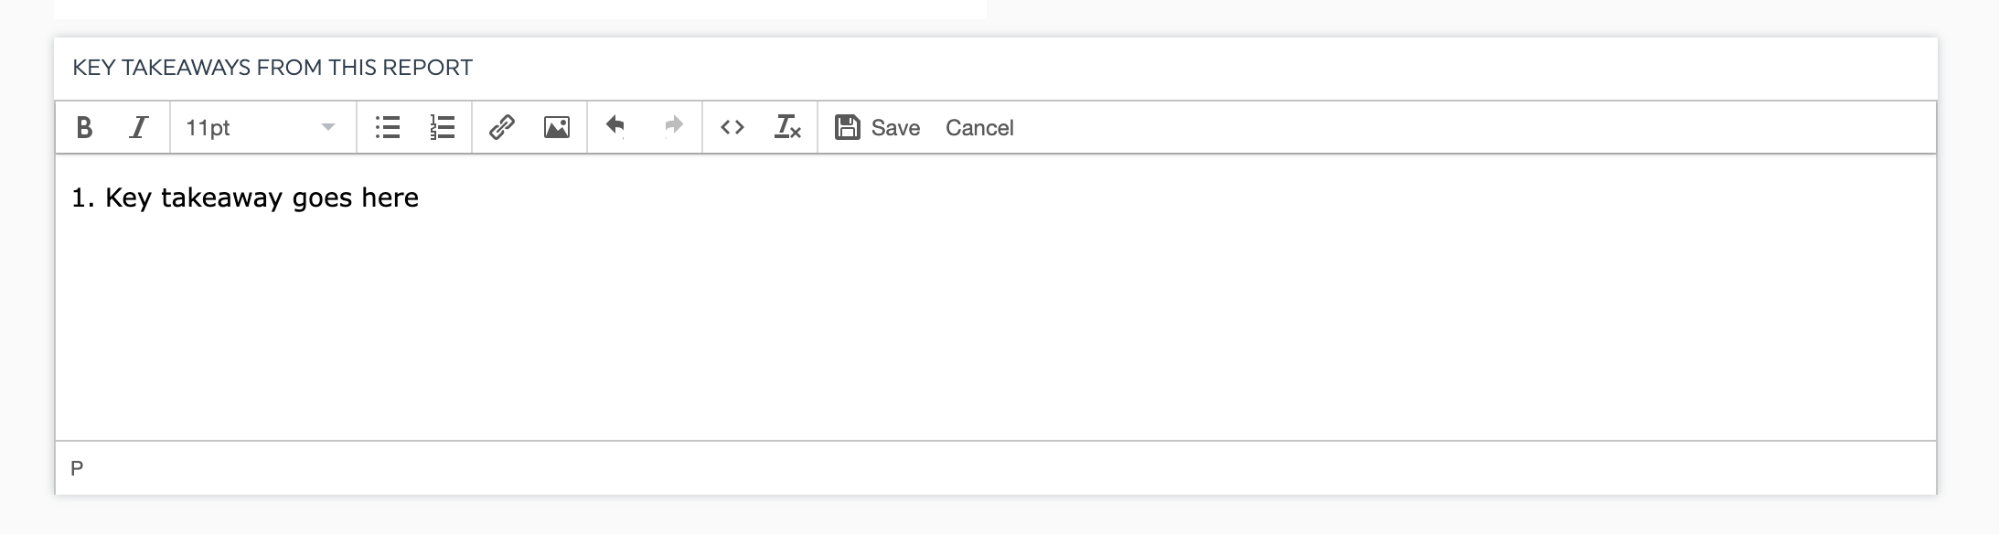
You’ll get an editable box here where you can add high-level insights to your dashboard, like an executive summary.
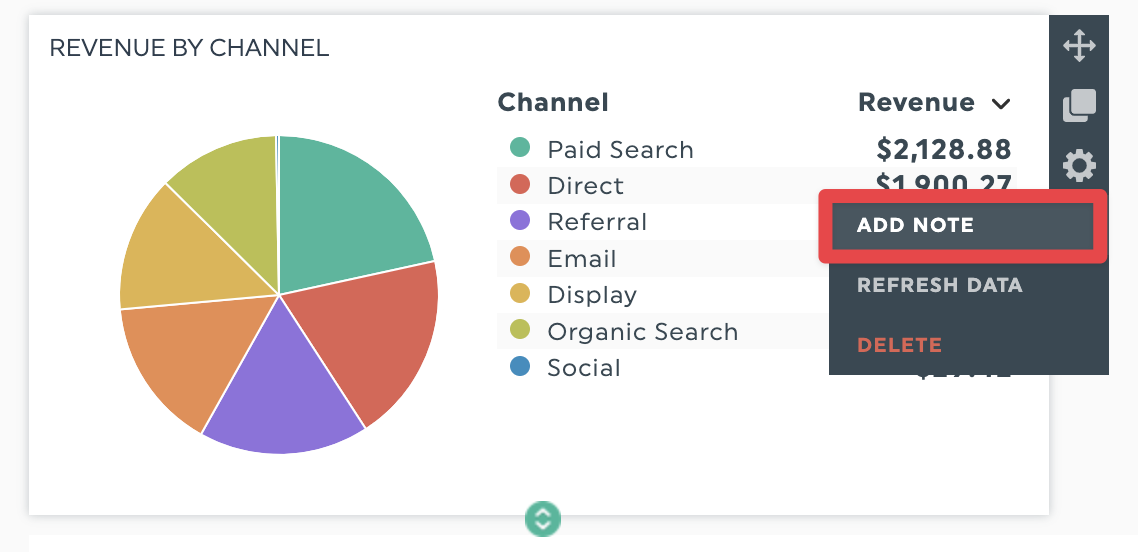
Besides comment boxes, you can also add a note to a specific widget to explain each chart or add valuable context. Click on Add Note on the widget to bring up an editable box.
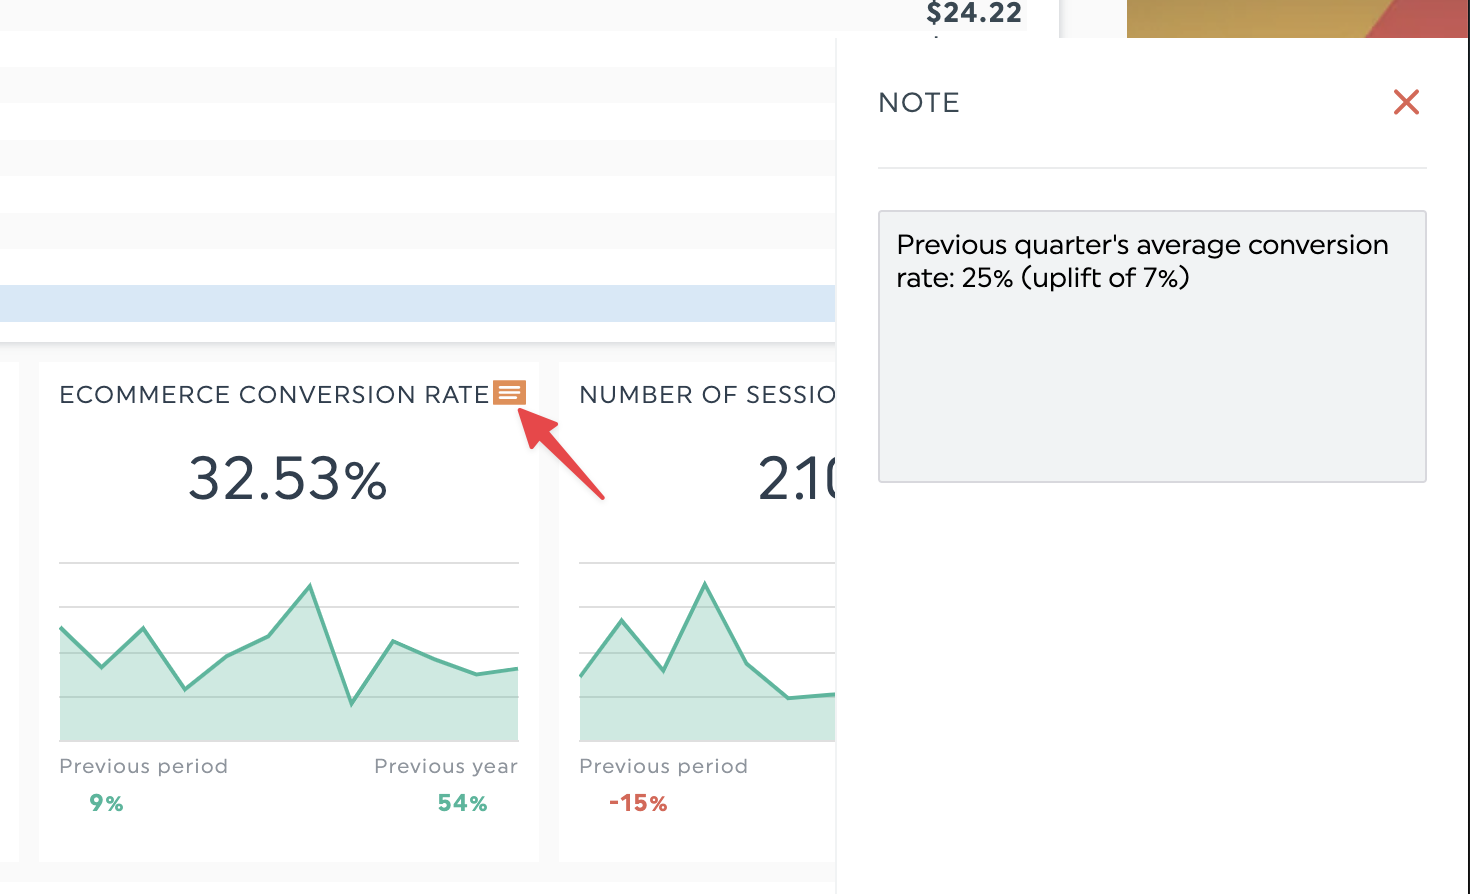
Once done, the note will appear on the right side of your screen in a separate panel, accessible in view mode.
- Bring your data from your other tools in one dashboard beyond Google Analytics data.
Campaigns use multiple channels, from email, social media, SEO, and paid advertising platforms like Google Ads. If you focus on Google Analytics data alone, you won’t see how your content marketing or overall marketing efforts affect your website or app.
Reporting tools like DashThis allow you to combine your marketing data in one place, making client presentations and reviewing data simpler. Plus, we integrate with 34+ of the most popular marketing tools, freeing up more time for data analysis and developing next steps.
- Give your reports the personal touch with DashThis’s white-labeled reports.
Google Analytics dashboards look great, but everyone who uses GA has data in the same look and feel.
What if you want to showcase your Google Analytics dashboard in your own brand and colors? DashThis offers many white-label options to change your report’s logo or make the data pop in your brand’s colors.
You can even use your domain name to host your report, ensuring the branded experience your client has with you extends to your reports and dashboards.
Bonus: Sharing your DashThis report is easy!
DashThis reports allow various options to share your report
- Share by email automatically: Your report will be sent on the day you want, with the frequency you choose, to whomever you want.
- Export as PDF: Useful if you want to share a report through a chat app or save a report on your device.
- Copy as a shareable link: Get your clients on the same page during presentations by sending them the dashboard URL ahead of time.
Watch this 2-minute video to learn more about how easy it is to share a report with your clients in DashThis.
How to create a Google Analytics dashboard with DashThis
Get started creating dashboards with these 20+ dashboard templates in DashThis! Try our Google Analytics dashboard with your own data here.
You can get started in minutes. All you need to do is.
- Start your free 15-day trial with DashThis
- Connect your Google Analytics account and import your GA data to DashThis
- Select the metrics to include from our Preset Widgets and drag and drop the metrics you want to include.
Or, if you need an easy way to get started, try our ready-to-go Google Analytics report template and keep track of all your website’s key metrics in a new dashboard.
Sign up for your free 15-day trial of DashThis today.
Share and automate better Google Analytics dashboards with DashThis
To include data from other digital marketing tools besides Google Analytics, the in-built sharing options in Google Analytics may not be enough. Plus, if you’re spending hours building a custom report for each client, it may be time to review an easier way to share it with your clients.
Build and share better Google Analytics dashboards with others. Create your own report template or start with any of our pre-filled templates with your free 15-day trial of DashThis today.

Ready to create a perfect Google Analytics dashboard?
Read More

Don’t miss out!
Follow us on social media to stay tuned!
Automate your reports!
Bring all your marketing data into one automated report.
Try dashthis for free