How to Create an Automated KPI Dashboard in Google Sheets

Data is only useful after you make sense of it.
In this tutorial, discover how to turn your data into charts in a Google Sheets KPI dashboard and why you should consider DashThis as an alternative to client reporting.
- What is a KPI Dashboard in Google Sheets?
- How to Create a KPI Dashboard in Google Sheets?
- Even Better: Create Your Google Sheets KPI Dashboard with DashThis
- Automate Your Reporting with DashThis
What is a KPI Dashboard in Google Sheets?
A Google Sheets KPI dashboard is a data visualization-centric spreadsheet that shows a company, department, or individual’s key metrics in graphs and charts.
Its primary purpose is to convey information as quickly as possible so that higher-ups can speed up decision-making and strategize the next move.
Monitor your key performance indicators with an automated marketing reporting tool. DashThis boasts over 40 dashboard templates and integrations with your favorite tools like HubSpot and Ahrefs. Start your free 15-day trial to gather data across these channels into one beautiful report today.
How to Create a KPI Dashboard in Google Sheets?
Don’t let the complicated charts and numbers fool you. It’s actually really easy to create a KPI dashboard in a Google spreadsheet. Let’s take a look.
(i) Create data set based on KPIs
Bring your data source into Google Sheets.
For example, if you’re an eCommerce marketing manager retargeting new customers to complete checkout, you’ll want to create a sales dashboard and upload a CSV file with the following metrics: impressions, clicks, click-through-rate, conversions, total spend, and cost per acquisition.
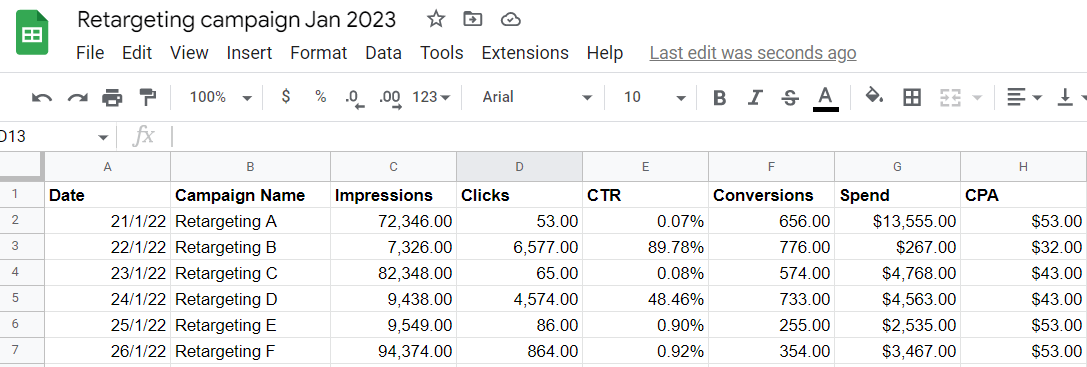
Double and triple-check the formatting before proceeding to the next step.
(ii) Create charts
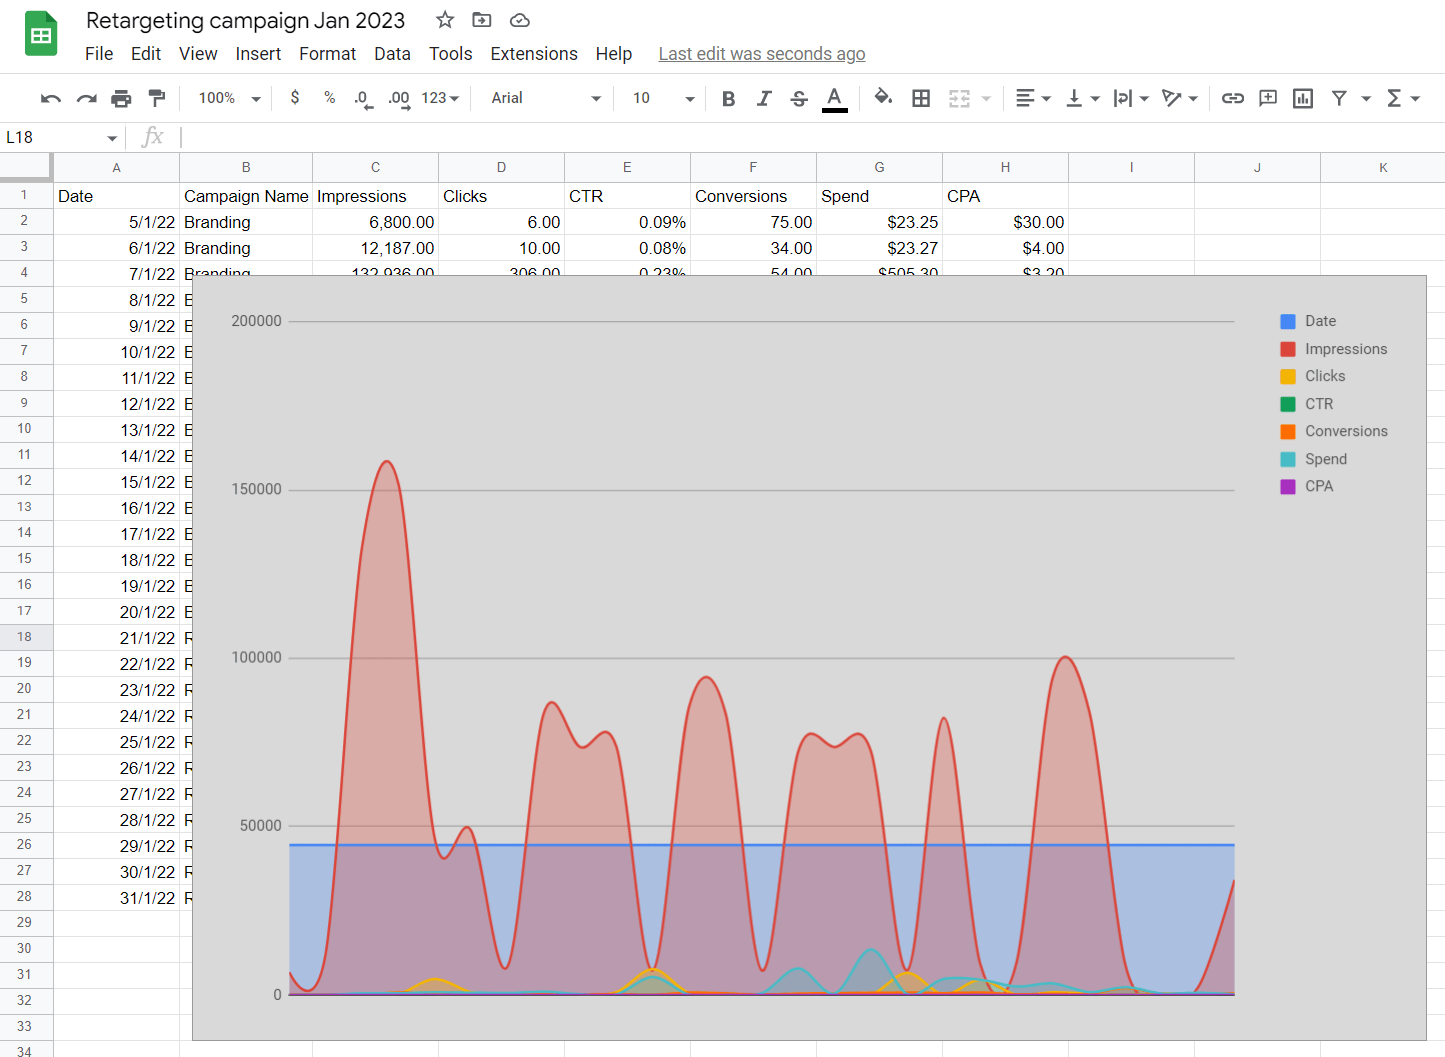
Highlight the entire dataset and click Insert > Chart.
Google Sheets will auto-generate a simple chart that looks something like this.
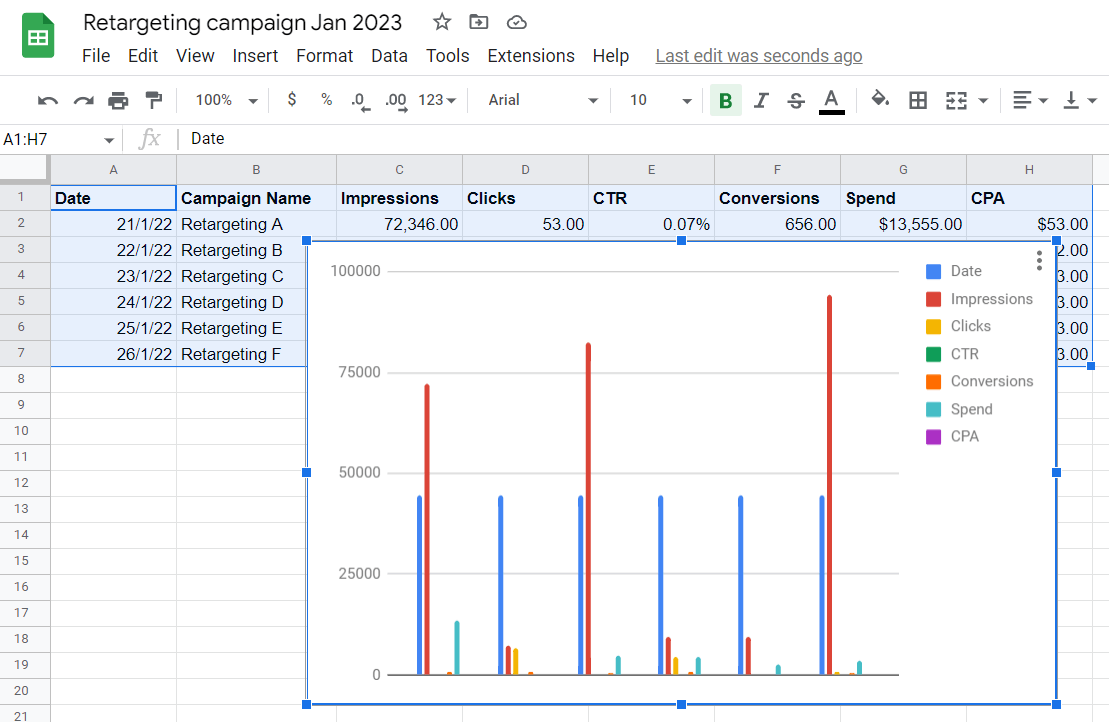
Drag and drop the chart to your desired position.
(iii) Decide on the visualization
On the chart editor, click Setup > Chart type.
As shown below, you can create different graphics on Google Sheets. There’s a pie chart, bar chart, pivot table, and scatter chart, among others.
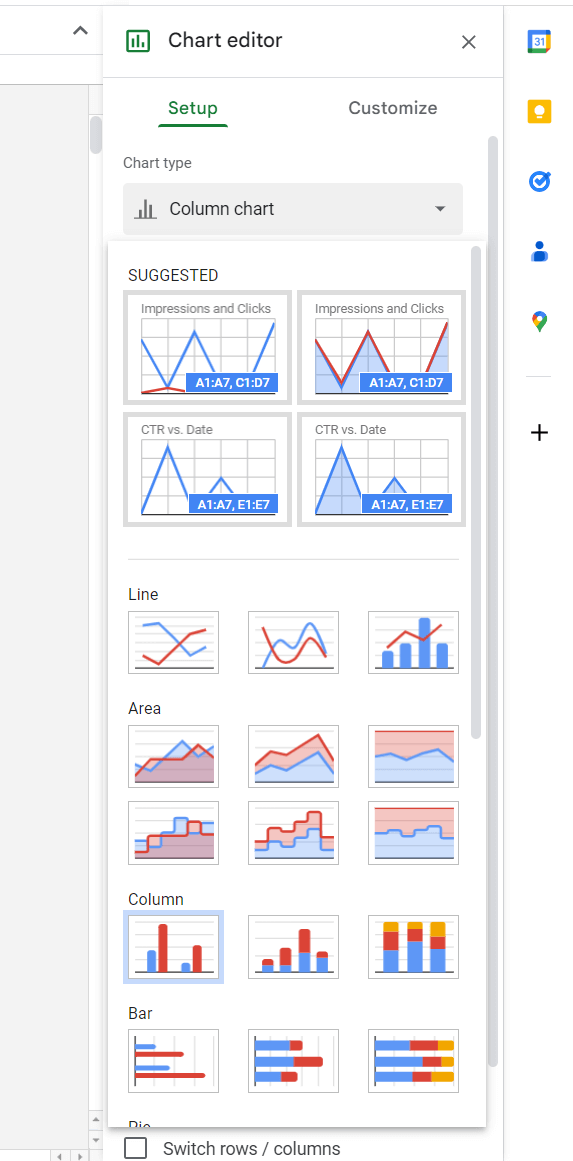
Right-click the chart to customize the area, style, axis titles, gridlines, and more.
Even Better: Create Your Google Sheets KPI Dashboard with DashThis
Google Sheets may be a popular tool among professionals, but that doesn’t mean it’s immune to limitations.
One big downside? It’s stubbornly part of the Google ecosystem.
Unless you run a small-knit company that uses only Google, it’s almost impossible to use Google Sheets with other third-party tools—at least not efficiently.
Imagine growing an agency from 10 to 100 people. There comes a time when you need to automate manual and repetitive tasks, like updating your team’s progress.
Using just Google Sheets to monitor what needs to be done by who and when across dozens of clients is a recipe for chaotic disaster.
You need a robust project management platform that lets team members collaborate in a central workspace. Bonus if it boasts add-ons for an extra layer of functionality.
The same applies to client reporting. Taking screenshots of every marketing performance for every client and updating each spreadsheet manually are incredibly time-consuming.
A better way: import your data from Google Sheets into DashThis. With just a few clicks, you can automatically bring all raw data from multiple marketing channels at once into one powerful Google Sheets dashboard within minutes.
Here’s how it works:
- Sign up for our free 15-day trial
- Click Integrations on the left sidebar (note: ensure that your spreadsheet is on Google Sheets, as DashThis does not support Excel currently)
- Select Add beside Google Sheets
- Choose the spreadsheet
- Pick the data sources you want to connect
- Click New Dashboard at the top menu
After inputting the relevant details in the KPI dashboard, click Custom Widget > Multi-Column List.
Enter the metrics accordingly.
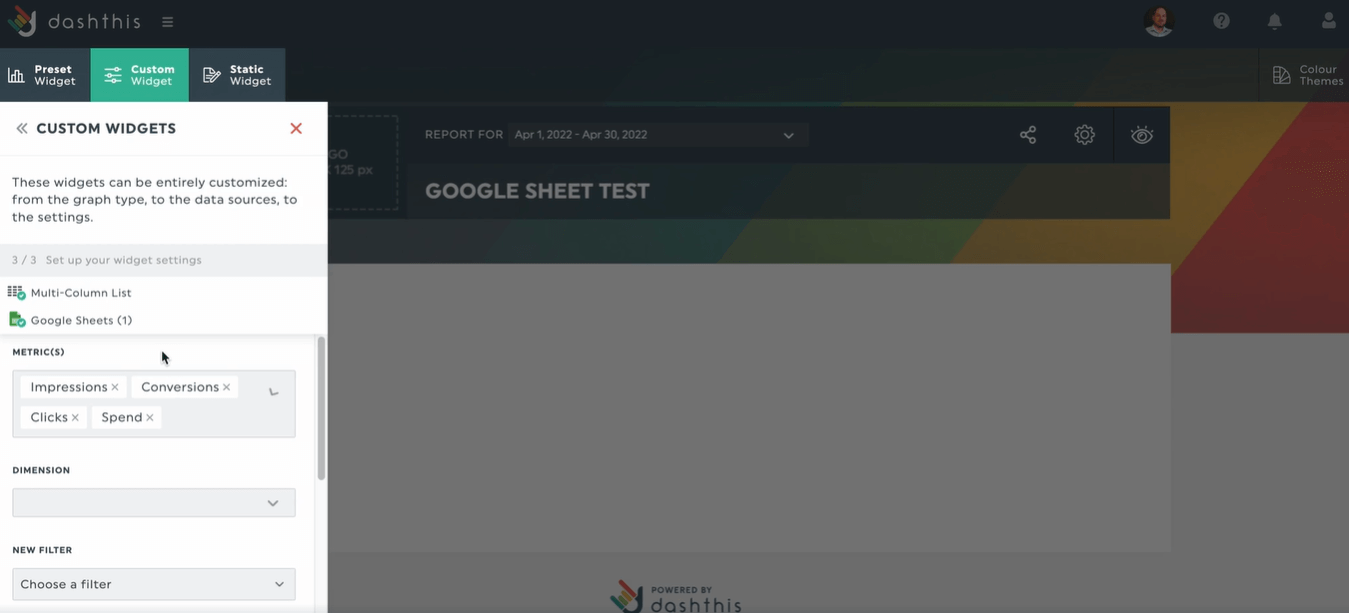
DashThis will automatically insert your chosen metrics into the dashboard.
From then on, you can customize the graphs or charts as you see fit. Hover over the metric and click Edit Widget > Data Display. Edit the style, layout, and display preferences.
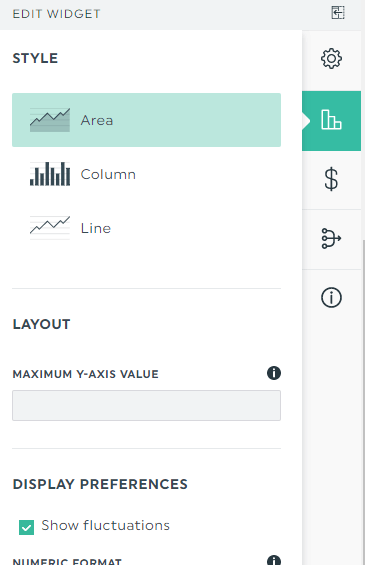
Click Save once you complete designing the dashboard (tip: visit our support doc for a complete step-by-step guide).
Finally, share the report with stakeholders. Select Sharing Options > Share by Email. Choose your dashboard time period, email recipient, frequency, and additional notes.
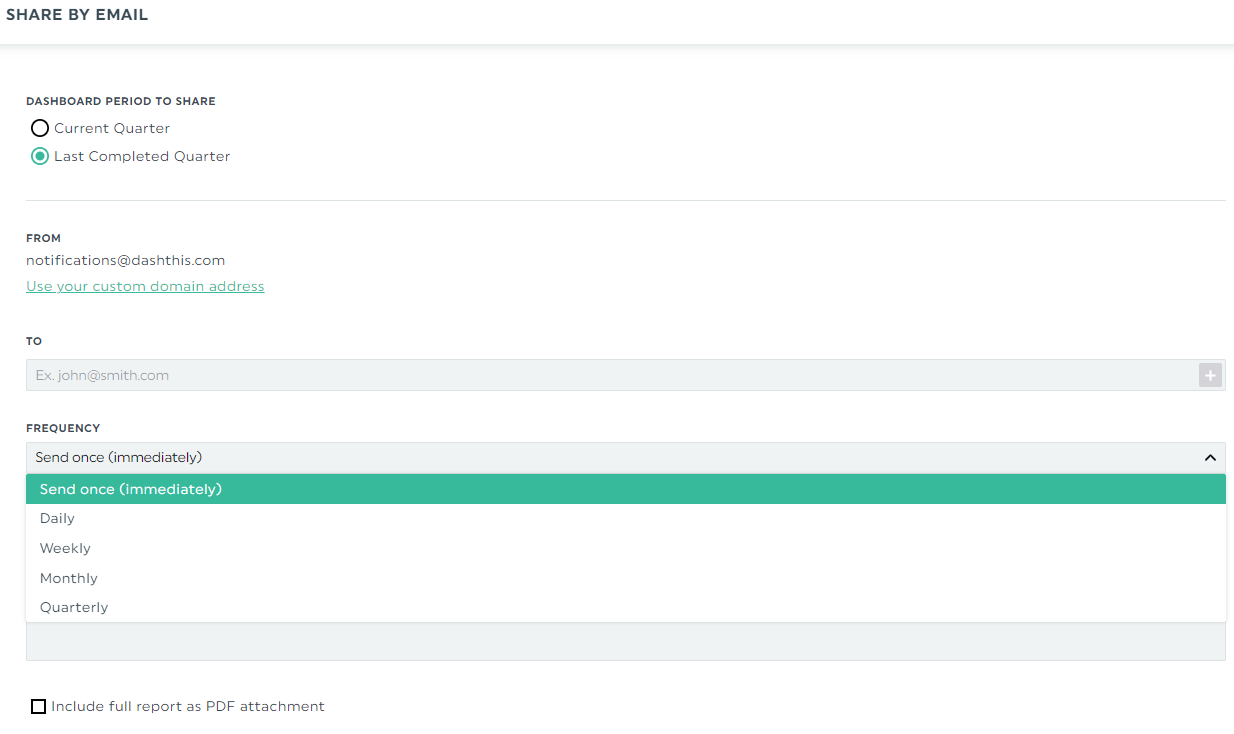
You can also share the report via a URL link to add an interactive touch. That way, clients can analyze their marketing performance in their chosen period in real-time.
You can go even further by customizing the report with your client’s brand in our white-label option.
Digital marketing report template
Google Analytics is a powerful tool with a great deal of data.
Here’s how your digital marketing automated report might look after you import data from Google Analytics and Google Ads into DashThis.
Note how the analytics dashboard group the relevant metrics together to form a cohesive and clean look. It places the conversion rate near the number of sessions and revenue to provide more context.
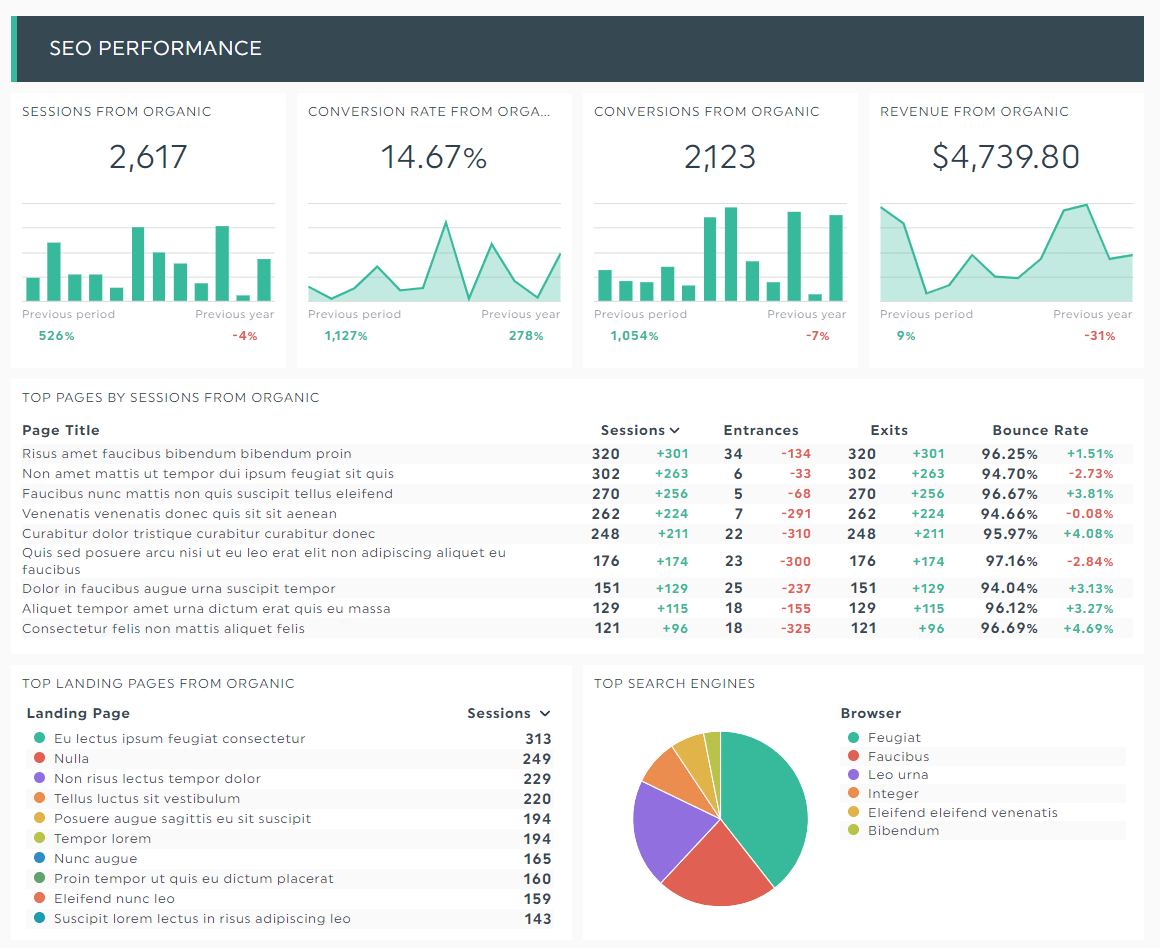
Grab this free digital marketing dashboard with your own data!
With a dashboard like this, it takes minutes to perform data analysis. You no longer need to spend hours drawing conclusions and insights from multiple spreadsheet tabs.
DashThis displays all vital metrics in one interface.
Automate Your Reporting with DashThis Today
Google Sheets might be the most popular tool, but it’s far from perfect for automation, data analysis, and advanced customization.
You need a better solution if you want to save time from reporting.
DashThis is an automated reporting tool that gathers your raw data and transforms them into digestible charts in one beautiful report. Connect it with your favorite marketing tools, share your results, and customize your report with our white-label option.
Start your free 15-day trial to automate your entire reporting today.

Ready to create an automated KPI dashboard?
Read More

Don’t miss out!
Follow us on social media to stay tuned!
Automate your reports!
Bring all your marketing data into one automated report.
Try dashthis for free