
Create your Facebook Insights dashboards today!

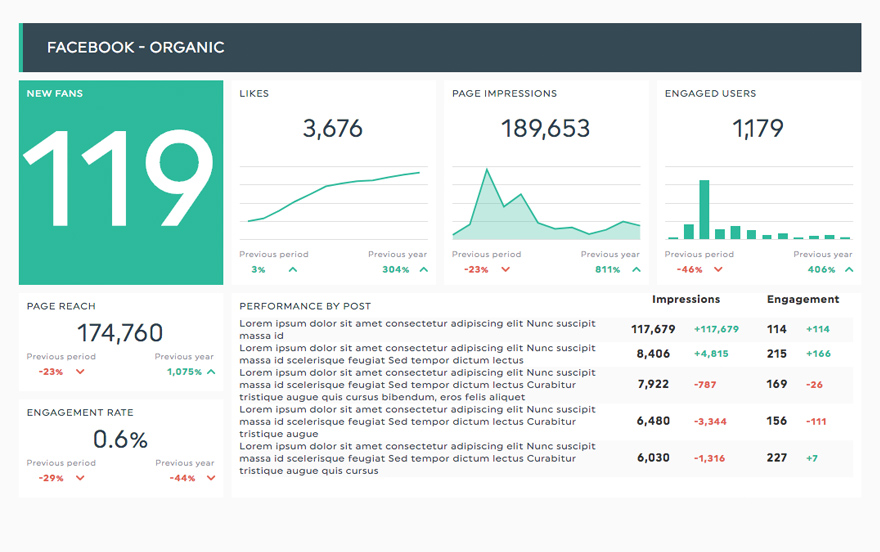
No doubt you already know how important Facebook is as part of your overall web presence. With almost 2 billion users, an enormous number of consumers visit the site daily. Having a specific page for your business is therefore crucial. And how do we track the success and engagement of your page? Facebook Insights of course! With a Facebook Insights dashboard, you can see how your Facebook page is working and what to do to optimize it.
-
19 +
Preset Widgets
-
34 +
Metrics & Dimensions
-
2 +
Dashboard Templates


 Your logo
Whether your own or your client’s logo, make your report reflect your brand!
 All-in-one
Drag-and-drop your widgets onto your dashboard to create a clean report layout that includes all the information you need.
 Your data
Customize your widgets to show the data you want, the way you want to.
Available Preset Widgets
Featuring the most common KPIs, these widgets are ready to use! Drag, drop, done!

-
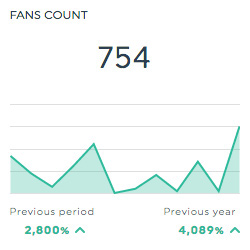
Fans Count
This historic widget shows the total number of fans your Facebook page has.
-
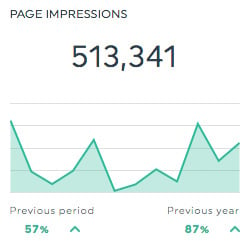
Page Impressions
This historic widget shows the total number of times your Facebook page is displayed.
-
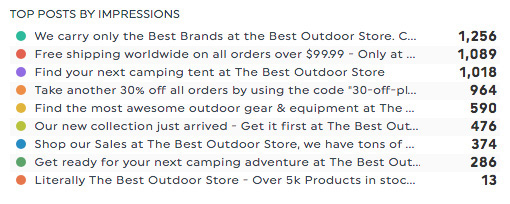
Top Posts by Impressions
This list widget shows the top posts on your Facebook page by number of impressions.
-
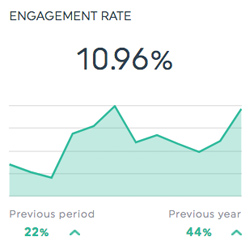
Engagement Rate
This historic widget shows the rate at which people engaged with your Facebook page. This is calculated by dividing the total engagement (likes, comments, shares, and clicks) by the total reach, and multiplying the result by 100.
Available Metrics, Segments, & Dimensions
These are the top 10 metrics users usually include in their Facebook Insights dashboards:
- Fans (Page Likes)
- This is the total number of people who have liked your Page.
- Average Comments Per Post
- This is the average number of comments for your page posts.
- Page Engaged Users
- This is the total number of people who engaged with your Page. Engagement includes any click.
- Post Likes
- This is the total number of people who liked your post.
- Page Engagement Rate
- This is the number of people who engaged with your Page divided by the number of people who saw any of your content.
- Page Organic Impressions
- This is the number of times your posts were seen in News Feed or Ticker or on visits to your Page. These impressions can be Fans or non-Fans.
- Page Interactions
- This is the total number of interactions your Facebook page received.
- Page Unlikes
- This is the total number of people who unliked your Page.
- Page Views
- This is the number of times your Page's profile has been viewed by logged in and logged out people.
- Page Video Views
- This is the total number of times page’s videos have been viewed for more than 3 seconds.
Other Useful Integrations
Get a more inclusive view of your data by including these integrations in your dashboard too:


FAQs about DashThis and Facebook Insights Integration
Have questions about using Facebook Insights with DashThis? Here are a few quick answers.
What is the Facebook Insights integration in DashThis?
The Facebook Insights integration allows you to automatically pull performance data from your Facebook Pages into a live reporting dashboard. It helps you track audience growth, engagement, reach, and content performance without manually exporting data from Meta Business Suite.
Is Facebook Insights data updated automatically in DashThis?
Yes. Once your Facebook Page is connected, DashThis automatically pulls your Facebook Insights data into your dashboard. Your reports update automatically, so you always have access to the most recent metrics without manual work.
What Facebook metrics can I track with the integration?
You can track key Facebook Page metrics such as page likes, followers, reach, impressions, engagement, reactions, comments, shares, post clicks, and video performance. You can also analyze performance by post to identify your top-performing content.
Can I track multiple Facebook Pages in one dashboard?
Yes. You can connect multiple Facebook Pages and either create separate dashboards for each page or combine them into a single report, depending on how you want to present your results.
Can I customize my Facebook Insights dashboard?
Absolutely. You can choose the metrics, widgets, and visualizations you want to display. You can filter by date range, compare performance over time, and organize your dashboard layout to match your reporting needs.
Can I combine Facebook Insights data with other platforms?
Yes. You can combine Facebook Insights data with Facebook Ads, Instagram, Google Analytics, LinkedIn, SEO tools, and other marketing platforms in one dashboard. This gives you a complete overview of your organic and paid marketing performance.
Can I share my Facebook Insights dashboard with clients?
Yes. You can share your dashboard through a live link, schedule automatic email reports, or export it as a PDF. You can also add your logo and brand colors to create professional, client-ready reports.
Learn to use Facebook Insights in our Help Center
Read about Facebook & Facebook Insights on our blog
