
Create your Twitter dashboards today!

Note: Twitter has recently shut down our access to their API, along with many other companies in our industry. Unfortunately, this means that DashThis cannot natively pull data from Twitter and display it in your widgets for the time being. Although this situation is outside our control, we want to ensure that we do everything possible to help. This is why we have designed a detailed guide explaining how to import Twitter data into your dashboard using our CSV or Google Sheets integration. This guide will provide a viable alternative to continue reporting on your most important KPIs.
What better way to include consumers in a regular conversation with you than through Twitter? With 280 character Tweets, it’s easy to hear what your consumers have to say, include them in a conversation, and create a positive brand image. Create Twitter dashboards to get an even better understanding of what your clients like, engage with, and react to.
-
8 +
Preset Widgets
-
9 +
Metrics & Dimensions
-
2 +
Dashboard Templates


 Your logo
Whether your own or your client’s logo, make your dashboard reflect your brand!
 All-in-one
Drag-and-drop your widgets onto your dashboard to create a clean report layout that includes all the information you need.
 Your data
Customize your widgets to show the data you want, the way you want to.
Available Preset Widgets
Featuring the most common KPIs, these widgets are ready to use! Drag, drop, done!

-
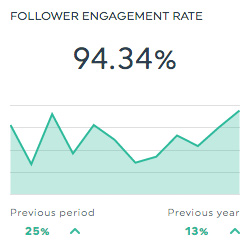
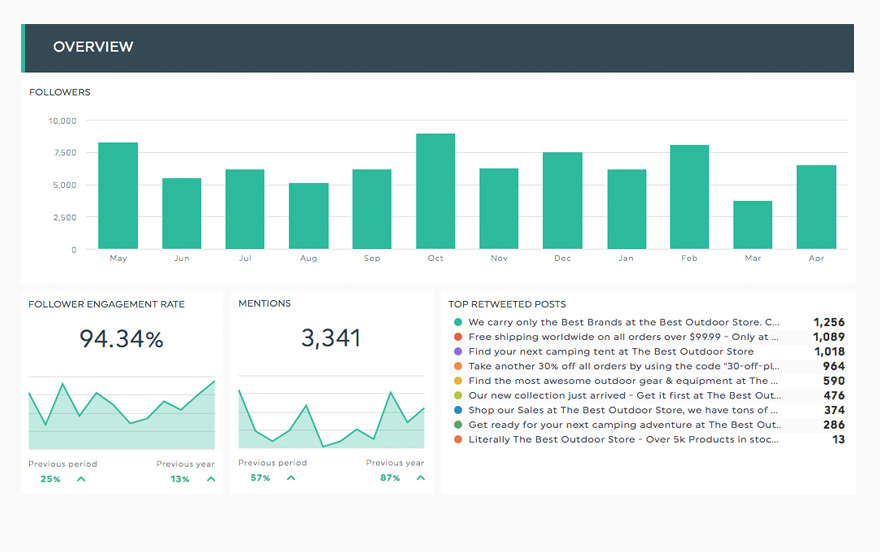
Follower Engagement Rate
This historic widget shows the rate at which your Twitter followers engage with your content. It is calculated by dividing the total number of engagements by the total number of your followers, then multiplying the result by 100.
-
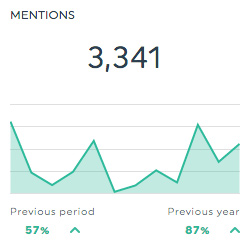
Mentions
This historic widget shows the total number of mentions your Twitter handle has.
-
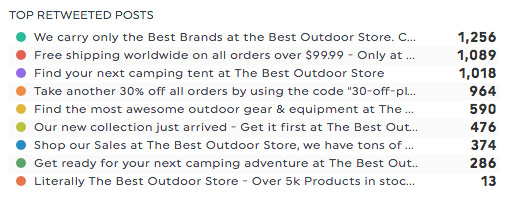
Top Retweeted Posts
This list widget shows your retweeted posts, in order of number of retweets.
-
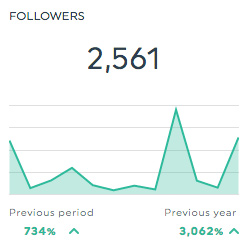
Followers
This historic widget shows the total number of followers your Twitter page has.
Available Metrics, Segments, & Dimensions
These are the top 5 metrics and dimensions users usually include in their Twitter dashboards:
- Follower Engagement Rate
- This shows the rate at which your followers engage with your content.
- Followers Count
- This shows the total number of followers your page has.
- Mentions Count
- This shows the total number of times your Twitter handle was mentioned.
- Retweet Count
- This shows the total number of times your content was retweeted.
- Post
- This dimension allows you to isolate your data based on post.
Other Useful Integrations
Get a more inclusive view of your data by including these integrations in your dashboard too:


Learn to use Twitter in our Help Center
Read about Twitter on our blog
