KPI

Average Session Duration

As a marketer, you probably measure powerful engagement metrics to check the quality and depth of user visits and user engagement. These web analytics can provide valuable insights about the user experience, user sessions, page metrics, and SEO, all from just assessing the average time period that users spend on a single page. Here’s everything you need to know about the average session duration!

TRACK YOUR AVERAGE SESSION DURATION!

  • 5 +

    Templates using this KPI

  • 2 +

    Integrations using this KPI

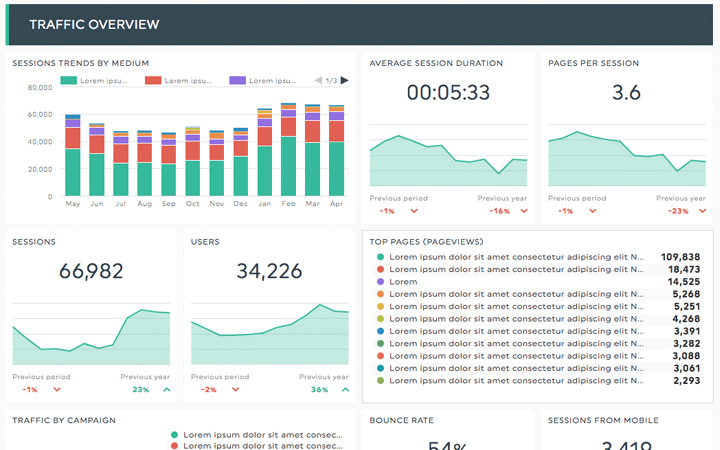
What is average session duration?

Average session duration is a crucial digital marketing metric that measures the average amount of time that a typical website visitor will spend on any web page in a single session. Tracking this metric is even more insightful than page views, it actually provides an understanding of how and where users are engaging with the landing page, home page, or eCommerce platform.

Track your average session duration today

How to calculate avg session duration

Each session is calculated beginning at the moment when an individual opens the webpage, to the time when they click an exit page. The longer a website’s average session duration, the better the user engagement value. It is simply a ratio of total time spent on the site, to the number of website visitors.

Average session duration formula


(Total duration of all sessions) / (Total number of sessions)


What is a good average session duration?

According to Google Analytics, a strong average session duration metric is between 2-4 minutes. Other search engines have outlined that time frames vary depending on the device they are using. The total time users spend on a single page is typically longer on a mobile device than on a computer.

Track yours with an automated report

What is a bad average session duration?

If the average session duration is one of the benchmarks coming in at below 2 minutes, it is possible that users are not spending much time on the web page because the content is not engaging or informative. A short average session duration usually indicates that a site isn’t offering value to the reader.

Track yours with an automated report

Average session duration KPI examples & templates

Your average session duration can be added to multiple different types of reports. Here are some of them:

See this KPI in action here!

Google analytics report template Google analytics report template

A report with all the most important Google analytics metrics. Track all your web analytics, from single-page metrics, page load time, organic searches, total number of sessions, and more. 

See this template live

Digital marketing report template Digital marketing report template

From SEO to social media and PPC, this report gives you a good view of all online performance metrics. Get insights on user experience and figure out your digital marketing next steps.

See this template live

Ecommerce report template Ecommerce report template

A report with all the most important metrics for your eCommerce website, like bounce rate, shopping cart abandonment, and total revenue. Optimize your product pages to get better results in your report!

See this template live

Get 10 free dashboards for 15 days

TRY DASHTHIS TODAY

Average session duration best practices

If your KPIs aren’t performing well, and you aren’t seeing a lot of organic searches or organic traffic, a low average session duration may be the reason. Here are some ways to improve.

Average time on page best practices

step 1 icon Use a call to action

By incorporating buttons and links that direct the user around the site, you will be able to increase your average session duration. Leading the user around the site will increase user engagement and make it possible for them to spend a longer time period on your web page with low effort.

step 2 icon Visualization is key

Incorporate quality videos, pictures, diagrams, and graphics throughout to make the content compelling and interesting to viewers, remember that it needs to be attention-grabbing to hold their attention for a long amount of time.

step 3 icon Have a user-friendly interface

Make sure everything is functioning properly and seamlessly, if you have a high bounce rate, make sure all links are working. Remove pop-ups and other annoying features that turn people away from websites. Finally, make sure your content is informative by incorporating useful features like an faq, contact us page, and more so that navigation is intuitive on your website.

Want to track all your KPIs in one easy-to-use dashboard?

Try dashthis free

KPIs you may also like

Digital Marketing reporting dashboard

Get Started Today!

Try DashThis

Made in Canada

DashThis is a brand owned by Moment Zero inc

Copyright © 2011-2024