Google Ads metrics: 9 of the most important KPIs

When working with Google Ads (formerly known as Google AdWords), you'll face a lot of numbers and Google Ads metrics.
This can be frustrating and overwhelming for a beginner, but in this article, I will introduce you to 9 of the most essential Google Ads performance metrics.
- What are Google Ads metrics
- The Google Ads metrics you should track
- 1. Return on Ad Spend
- 2. Cost per Acquisition
- 3. Number of Conversions
- 4. Number of Clicks
- 5. Conversion Rate
- 6. Number of Impressions
- 7. Click-Through Rate
- 8. Total Conversion Value
- 9. Quality Score
- Start tracking these metrics today
What are Google Ads metrics?
Google Ads metrics are the indicators you need to track to know whether your campaigns worked out or not; they give you insight into your ad performance and what to do next!
How to choose your Google Ads metrics?
You should always start by defining the overall goal of your advertising. For the vast majority, this goal is about your bottom line; getting more sales and overall revenue can also increase brand awareness. You must define this goal first to determine which KPIs and metrics to look at when evaluating your Google Ads campaigns.
To me, the core of Google Ads is data. To keep your performance at a high level, you need to analyze and interpret the data you get. You must customize your Google Ads account, including Google search queries, ad copy, and negative keywords, to fit the trends from your Google Ads data analysis. And just to be clear: you will need to update and customize your setup an infinite number of times to get the searchers’ attention.
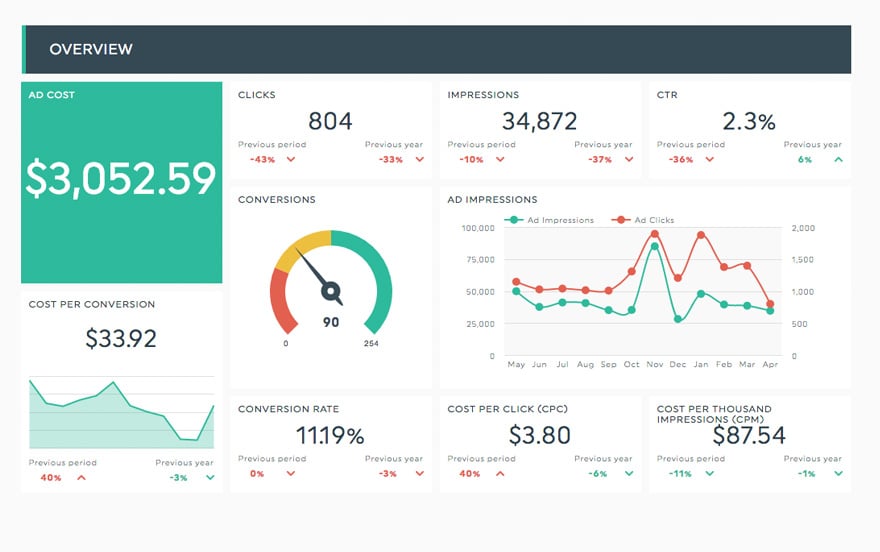
Having an easy-to-understand Google Ads report filled with just the proper KPIs for your business is also crucial. Ideally, with your colors and overall vibe, like this white-labeled report from DashThis:

The Google Ads metrics you should track
If you're at a beginner level, start by learning the key metrics below, then make it yours with some optimization through time.
You can also start with a preset Google Ads report template filled with all these KPIs and more.
1. Return on Ad Spend (ROAS)
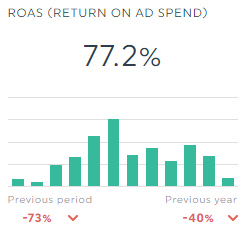
Return on Ad spend (ROAS) is one of the very first metrics I would look at to get an overview of recent PPC performance. ROAS is the ratio of our costs in Google Ads to the revenue generated.
Let's look at an example:
Total cost: $ 500
Conversion value (revenue): $ 3000
ROAS = 6
(3000 / 500 = 6)
ROAS is our return every time we spend $ 1 on Google Ads. With a ROAS of 6, we generate $ 6 in revenue each time we spend $ 1 on Google Ads. Return on Ad Spend is, without a doubt, one of my favourite Google Ads metrics.
2. Cost per Acquisition / Cost per Conversion (CPA)
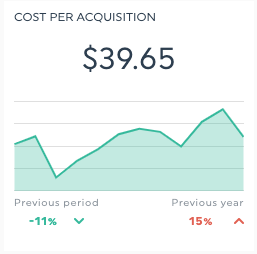
If you're not an e-commerce shop, you should track relevant leads. Let's assume that you work as a photographer, and your business goal is Phone Calls from your ad campaigns in Google Ads. In this case, we should look at price per acquisition/conversion, as we cannot calculate ROAS (no revenue figures).
The cost of each conversion varies from industry to industry as competition, the average cost per click and the conversion rate on the landing page are paid search engine metrics that will influence the results.
However, you should pay attention to how many relevant leads end up being customers and how much a typical job generates in revenue. Based on this, you can figure out the level of your CPA.
3. Number of Conversions
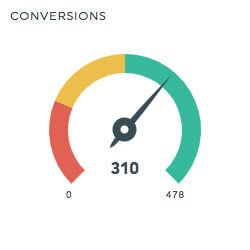
Return on Ad Spend and Cost per Conversion are undoubtedly two very important Ad performance metrics to look at, but it does not tell the whole truth. As ROAS simply tells you about the cost-to-revenue ratio, it's essential to look at the total number of conversions.
But remember:
A conversion can be defined as many different things, but it should be the desired action that creates value for our business. You'll need conversion tracking, which can easily be set up via Google Analytics to count the number of conversions.
4. Number of Clicks
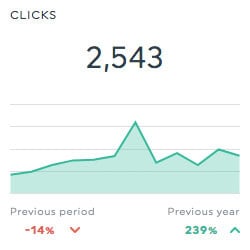
The number of clicks (ad clicks) is also essential to understand the volume in a given time period. Clicks are the essence of Google Ads; therefore, looking at how many clicks have been purchased during the period is essential.
It's also essential to take a look at your CPC or cost-per-click.
5. Conversion Rate
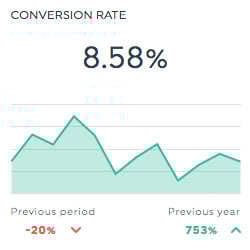
Conversion Rate is the ratio of clicks and conversions. It's essential to keep an eye on this metric as it's one of the most important metrics for your business. As you pay per click, a low conversion rate can be a big challenge.
How low?
If you have a very low conversion rate (0,1-0,5%), generating a reasonable Return on Ad Spend might be challenging as we'll have too high costs for every sale.
You should compare the conversion rate from Google Ads with other channels in Google Analytics. The traffic from Google Ads should be potential customers ready for purchase (this depends on your campaign goal); therefore, the conversion rate should be at a fair level.
6. Number of Impressions
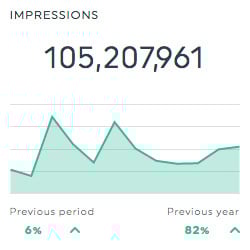
By looking at the number of impressions, you get an overview of overall campaign performance, like the one getting the most exposure on search results pages and display ads. We will often experience a lot of impressions with advertising at the display network, which is especially interesting if your campaign goal is brand awareness.
In addition, I would like to mention the PPC metric Search Impression Share. This metric is a percentage of your impression share for a campaign, ad group, or keyword.
It's also essential to check out your bid strategy's search terms and ad rank.
7. Click Through Rate (CTR)
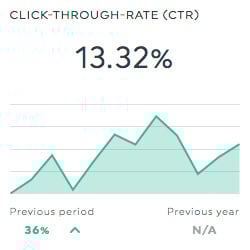
Click Through Rate is the ratio of views to clicks. You should always keep an eye on this KPI as it shows your ad's appeal to your target audience. Ask yourself whether your ad text is engaging for your target group or whether your banners are trustworthy. Maybe a few small changes can improve your performance.
You should always test different ads to find the constellation where you have the highest CTR. You want to figure out what your potential customers respond best to. A high CTR is really what you are aiming for.
What about an Ad Position?
Your Ad Position significantly impacts your click-through rate, so you should always look at both metrics when evaluating. A high ad position can cause a low CTR.
8. Total Conversion Value
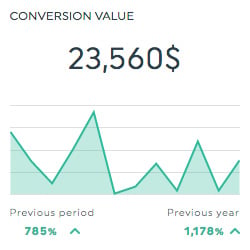
The total conversion value is relevant to keep an eye on as it can quickly increase and decrease even though the number of conversions is unchanged.
How is that?
All e-commerce shops should work with their average order value (basket size) so the total conversion value over time can grow without the number of sales increasing.
Likewise, it's essential to know the total conversion value (and ROAS/CPA) to plan how much money you should spend next month.
9. Quality Score
Some advertisers might overlook this metric slightly, which is a shame. When you work with your Quality Score, you can significantly reduce your costs, which is essential to a profitable business.
At Obsidian Digital, we have a structured framework we use every time to build new campaigns to secure a high-Quality Score for each keyword.
You can examine your Quality Score for each keyword and should take a closer look at the three core elements:
1) Landing page experience (your web page)
2) Ad relevance
3) Expected CTR
You should look at these elements to identify your focus areas. Not sure where to start? AI insights can help you quickly identify which element needs attention first.
Get these 9 Google Ads metrics under your skin. They are essential for you to understand and evaluate your PPC performance. You can always look at metrics like bounce rate or industry benchmarks to dive deeper into your performance and understand your audience better.
How to track all these metrics today
It's very easy, simply create a PPC report with all your Google Ads data automatically updated every day, like this one:
You can also create reports in DashThis for all your marketing channels, like your social media, SEO, or E-commerce website.
Use DashThis' PPC report template to start tracking all these metrics in no time!

Get an automated Google Ads report, already filled with all the best KPIs and metrics.
Read More

Don’t miss out!
Follow us on social media to stay tuned!
Automate your reports!
Bring all your marketing data into one automated report.
Try dashthis for free