A Step-by-Step Guide to Building Your Own AI Analytics Dashboard with DashThis

In the 1990s, the first business intelligence (BI) dashboard aimed to visualize and connect all your data in one place, but users still faced several challenges. First, you need your IT department to extract data for you. Next, you need expertise in Structured Query Language (SQL) and expensive infrastructure to perform any analysis.
The 2000s brought some relief with interactive dashboards and tools like Salesforce's Tableau and Microsoft's Power BI, which made data more accessible through self-service dashboards. However, these tools still required technical skills, which made them hard for non-technical users to adopt.
With AI-generated insights in the mix, business dashboards can show what happened last month and include an assistant that helps you explore your data. They make it easier to track KPIs within weekly client update reports, aiding in data-driven decision-making.
What if you could add artificial intelligence (AI) models to your marketing dashboards without setting up complex machine learning workflows or paying expensive LLM fees? This guide shows a simple way to use AI models in DashThis to track performance metrics and optimize your client’s campaigns in real-time make clearer reports on your clients’ campaigns.
Table of contents
Table of contents
- What is an AI analytics dashboard?
- Benefits and use cases of using an AI analytics dashboard
- Step-by-step guide on how to build an AI analytics dashboard with DashThis
- Start using automated AI analytics dashboards with DashThis
What is an AI analytics dashboard?
An AI reporting dashboard detects patterns and anomalies in your existing dashboards, which cuts analysis time by hours.
Think of the embedded AI as an extra analyst who can review your reports directly in your workspace. Tools with built-in AI dashboards like DashThis save the most time. You can run your data through chatbots such as ChatGPT, Perplexity, or Claude, but you’ll need to prepare the files and move the data between systems first to extract valuable insights.
With embedded AI in your dashboard, your reports go beyond showing last month’s metrics. They kick off your analysis by surfacing opportunities in the data and calling out urgent issues that should take priority in your strategy. Used well, you’ll save hours you’d otherwise spend scanning charts and running pivot tables in Google Sheets or Excel, and avoid the headache of stitching together datasets from multiple sources for more informed decisions.
What’s the difference between traditional and AI analytics dashboards?
Traditional dashboards give you a clear view of your marketing data. They organize charts and metrics into data visualizations that work across your channels. Add automated data pulls plus report sharing and scheduling functionality, and you’ll spend less time copying numbers or building graphs and more time getting reports to clients.
AI dashboards add a personal assistant that can read and interact with your data, surfacing patterns and outliers using natural language. Traditional dashboards show what happened this month. AI dashboards go beyond that with built-in actionable insights that can start your own work and offer simple trend predictions based on the data in front of you.
Adding AI analytics to your dashboard doesn’t replace the reporting workflow you already use. It gives you a helper that can review the numbers and point out anything relevant for your client’s campaign reports.
We’ve put together a table to understand the differences between the two dashboard types.
| Feature | Traditional dashboards | AI-powered analytics |
|---|---|---|
| Role | Show marketing data in a way people can easily understand. | Automatically uncover patterns in your data. |
| Data visualization | Visualize metrics and charts. | Automatically identify trends, outliers, and top/bottom-performing metrics. |
| Automation features | Automate data pulls and report scheduling. | Add text insights and data summaries to support human expertise. |
| Analysis process | Rely on manual review to interpret results. | Describe how performance has changed and highlight areas for improvement. |
| Decision guidance | Show what happened, with the opportunity to include notes and comments for context. | Describe what happened, explain why it occurred, and recommend next steps. |
Benefits and use cases of using an AI analytics dashboard
What advantages would using an AI analytics dashboard have over a standard one? Think of it as having an always-on assistant on call to help you interact with and analyze your data.
Reduce data analysis errors with automated insights
Let’s say you’re in charge of launching personalization initiatives for your email campaign. But there’s a snag, and it’s related to messy data. Your first-party customer records and email lists might live on one platform, while your GA4 metrics sit on another. To connect the dots between what customers do on your website and how to personalize their emails, you're stuck manually pulling data from multiple sources and wrestling it into a usable format.
If this sounds familiar, you’re dealing with data silos. It’s a common issue across businesses: 82% of companies say data silos disrupt key processes, leaving 68% of their data unanalyzed, according to IBM.
Without complete data, you can't deliver the personalized experiences today's buyers expect. With 66% of B2B buyers expecting personalized interactions, according to Adobe, you’ll need a full view of customer behavior across all touchpoints to make personalization work. But that’s more difficult to achieve when social, web, and email data sit in separate systems.
AI analytics dashboards solve this by centralizing your data and making it easy to use for data-driven decision-making. After you’ve got all your data in one dashboard from your digital marketing tools, AI insights then help connect related data points. The system acts like an always-on analyst, spotting anomalies you might miss and backing up your data analysis with continuous monitoring.
Here's how this works in practice. When you're tracking website performance, it's easy to miss significant changes happening in your data. This happened to Aziz Bekishov, CEO of DC Mobile Notary & DuoNotary, until he started using AI to help monitor his analytics.
I use AI tools alongside my website analytics mainly to catch traffic or conversion drops that I might have missed otherwise," explains Aziz. He shares an example: "The AI once spotted an unexpected drop in conversions after a browser update, something I probably would have missed during my regular checks."
This shows one of the biggest advantages of AI-powered dashboards: they catch problems before they get worse. Aziz notes that AI doesn't do all the work, but it does make data analysis easier.
“AI is good at telling me what happened, and then I figure out the why — like new campaigns, market changes, or other business factors," he says, which allows him to spot important trends faster and ensures he doesn’t miss anything important. To him, "AI helps me spot important trends faster and makes sure I don't miss anything important in all that data."
Spot relationships between different platforms and metrics
Today's customers jump between social media, email, search, and messaging platforms throughout their buying journey. This multi-channel approach makes your data analysis process more complicated. And, you're not alone in facing this challenge. In fact, integrating multiple data sources (internal and external) was ranked the #1 marketing data challenge for B2B companies in 2024, according to Forbes.
In fact, integrating multiple data sources (internal and external) was ranked the #1 marketing data challenge for B2B companies in 2024, according to Forbes.
With DashThis's AI insights, you get all your data in one place and can use it to guide your analysis and client reports. Here's how this works in practice. You run paid social campaigns on Facebook and Instagram for a handcrafted soap company and need to analyze which platform to prioritize.
Get this social media report template with your own data!
Your social media dashboard shows TikTok gaining followers three times faster than Pinterest. If you only looked at this data point, you might invest more in Instagram.
Yet once your paid social and email platforms are connected, the data shows that TikTok drives more engagement, but Pinterest visitors subscribe to email at 3x the rate. DashThis AI flags this pattern as a growth opportunity and suggests prioritizing Pinterest ads for lead generation, while using TikTok for brand awareness.
Step-by-step guide on how to build an AI analytics dashboard with DashThis
DashThis uses AI to spot trends in your data so you can trust the analysis and skip the busywork. Here’s how to get started with your own no-code AI analytics dashboard.
First, sign up for your 14-day DashThis trial, then follow these steps.
Step 1: Choose a reporting template preset, or create your own
Choose from our 50+ report templates to use as a starting point, or create your own.
Reporting templates include preset KPIs that populate your dashboard, so you don't miss key metrics. This gives you a strong starting point for your reports.
For example, if you want to create a dashboard that brings together your email marketing, Google Ads, and SEO data, our digital marketing report template is a good fit. What about a focused report on your TikTok holiday campaigns? You can use our TikTok Ads template to track and report on those metrics.
Step 2: Connect your data sources
DashThis integrates with over 34+ digital marketing tools from popular platforms like GA4, TikTok, Mailchimp and Instagram Ads. Connect these to DashThis with the necessary permissions, and we’ll automatically import the data from your marketing platform into your DashThis dashboard, making it easier to manage your data.
Step 3: Build your analytics dashboard
DashThis offers several widget types to build your dashboard. Here’s how to best use them as you’re designing your own dashboard.
Preset widgets
These widgets are automatically recommended based on your chosen report template and connected data sources. They pull relevant KPIs from each integrated platform. For example, linking Google Ads will populate your dashboard with that platform's key metrics, such as impressions, clicks, and conversion rates.

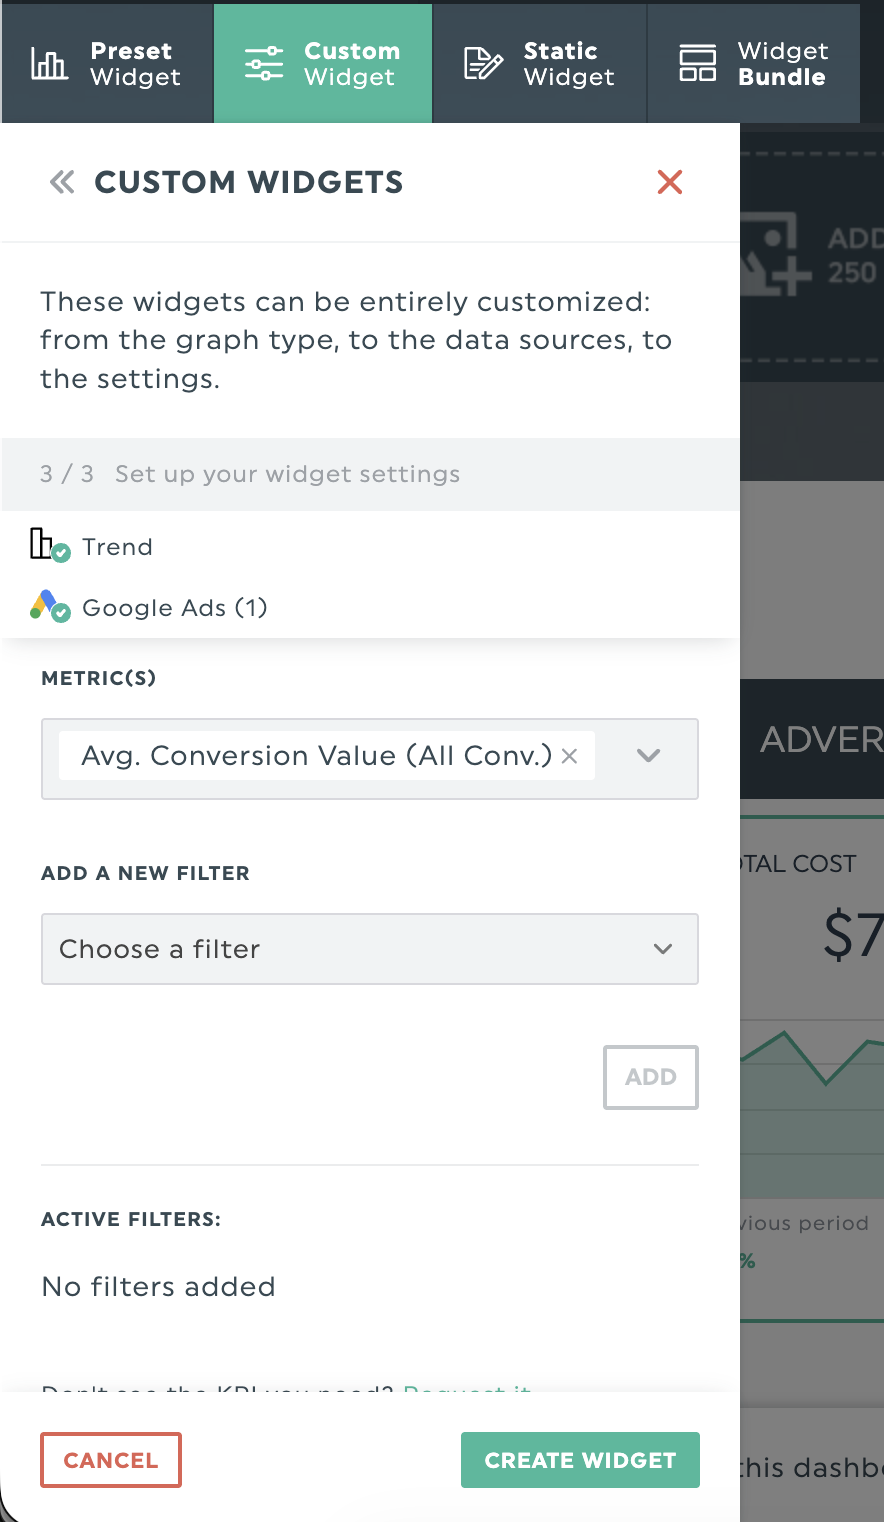
Custom widgets
Make your own widgets based on the data you want to visualize! Use them to turn platform data into tailored views of key metrics, such as a trend widget that tracks changes in your average conversion value from Google Ads for deeper analysis.
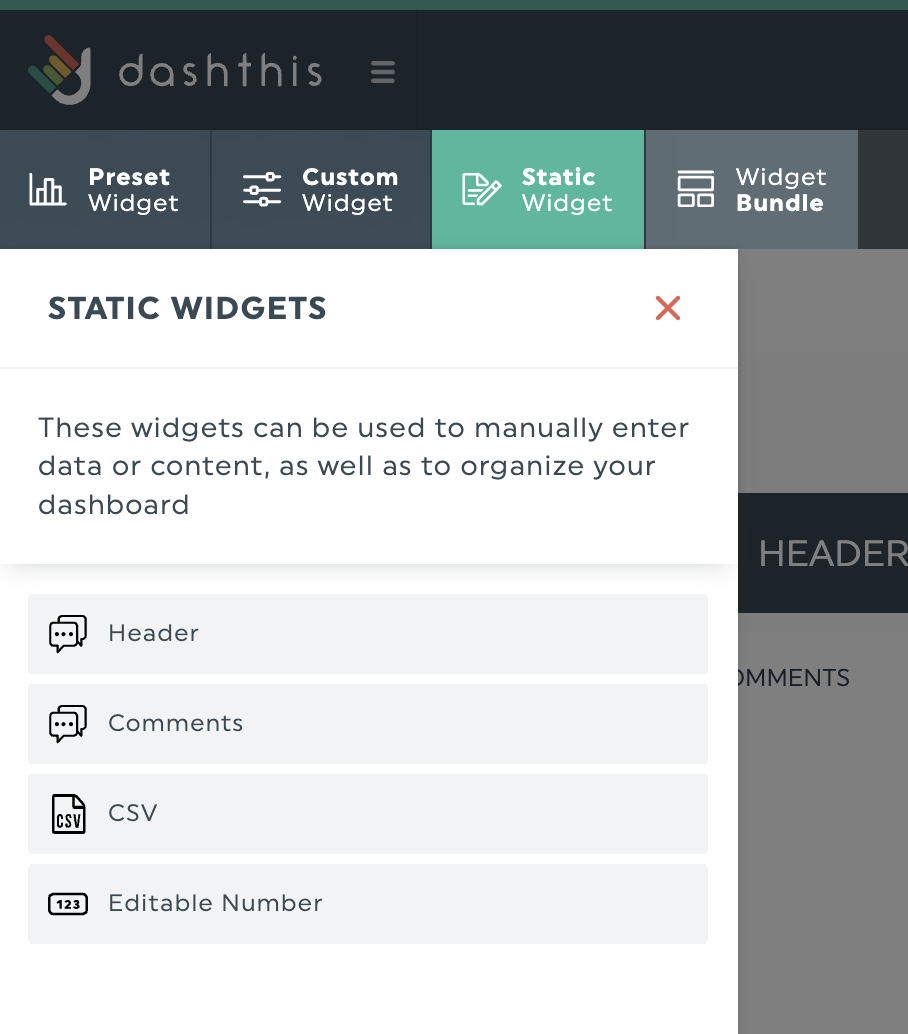
Static widgets
Static widgets add valuable context to your data. Use them to:
- Add executive summaries that outline key points and link metrics to goals.
- Organize metrics widgets by funnel stage or campaign type with dashboard headers
- Write notes and comments directly in your dashboard that explain changes in performance and shifts in strategy
- Document insights from your AI analysis to give the people reviewing your reports more context
Widget bundles for GA4 reporting
Working with GA4 data? Use this feature to add a set of related widgets in a single step, instead of clicking each one. To analyze advertising performance, add the advertising widgets bundle to populate your dashboard with the relevant widgets and reduce the chance of overlooking key metrics.
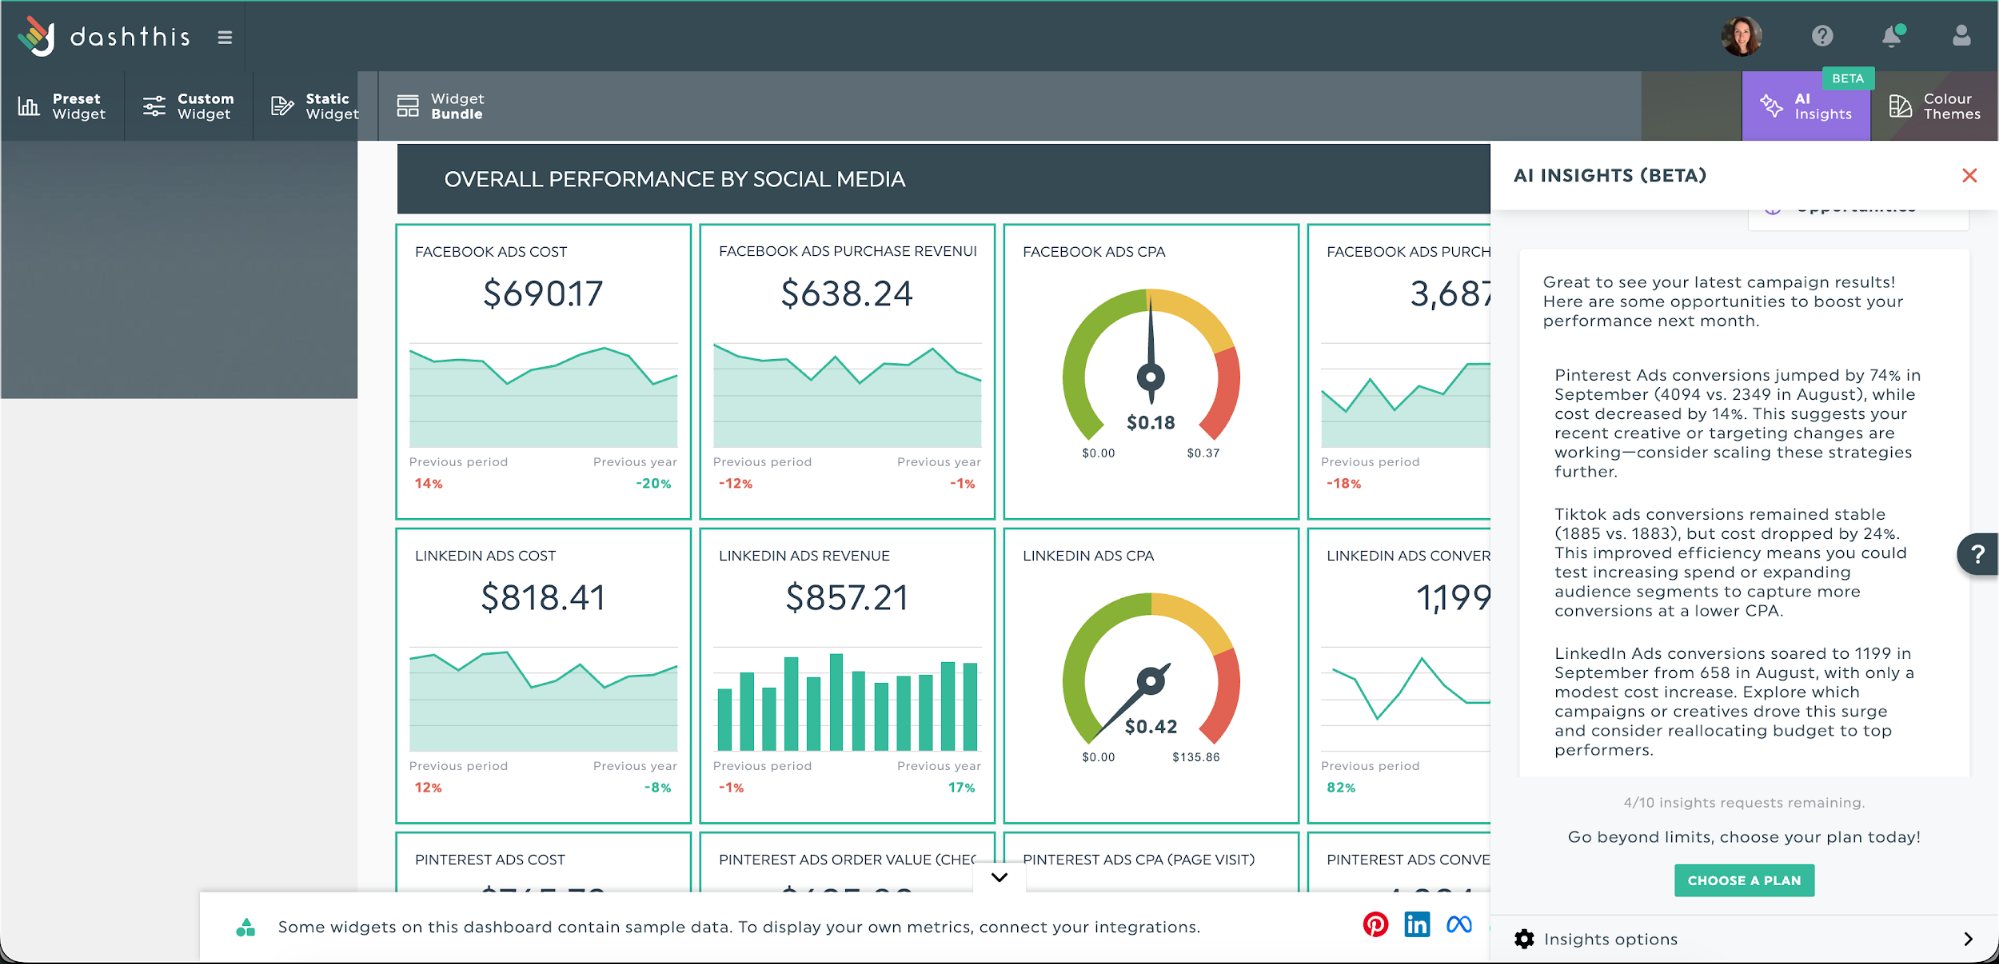
Step 4: Activate and start using DashThis’s AI insights
After building your dashboard, use DashThis’s AI insights to find patterns and start your analysis. You can get a quick summary of your data or surface wins and issues to investigate further. Let’s see how this works with Google Analytics 4 data.
When you're staring at countless possible digital marketing insights, knowing where to start your analysis can feel daunting. That's where DashThis's AI summary feature shines. Instead of manually combing through every metric, the AI instantly compares this month's performance against the previous month. It gives you that crucial first read on your data —a starting point for deeper data analysis.
After you create your dashboard, share it with your client or team members. Use DashThis report scheduling and sharing options to automate this part of your reporting workflow and keep everyone updated without extra manual work.
Start using automated AI analytics dashboards with DashThis
AI-powered dashboards pull your data into one place and enable faster analysis so that you can make decisions faster. You'll spend less time on manual work and deliver more precise results to clients.
You don’t need complex machine learning models or tedious multi-step workflows to get value from AI analytics. DashThis builds it right into your dashboard. Try DashThis free for 14 days and see for yourself how AI analytics dashboards can help you streamline your marketing reporting.

Discover AI-driven Insight with DashThis
Read More

Don’t miss out!
Follow us on social media to stay tuned!
Automate your reports!
Bring all your marketing data into one automated report.
Try dashthis for free