Google Analytics 4 metrics guide for tracking client KPIs

"Can you explain why our bounce rate changed?"
“What do engaged sessions mean, and why are they relevant?
Sound familiar? With the switch to Google Analytics 4 (GA4), many marketers are adapting to new metrics and terminology. Your clients might wonder why their familiar Universal Analytics (UA) metrics look different, or have disappeared entirely.
Use this guide to quickly determine which quantitative measurements apply to your clients and how they’ll be helpful as you create your reports.
Table of contents
- GA4 Metrics vs Universal Analytics (UA): what’s changed?
- Key GA4 metrics you need to track
- Engagement metrics in GA4
- Traffic acquisition metrics in GA4
- Event metrics in GA4
- Monetization and conversion metrics in GA4
- What if I need to measure something else?
- GA4 report template
- Automate your GA4 metrics reporting with DashThis
GA4 Metrics vs Universal Analytics (UA): what’s changed?
Before we dive into the recommended key metrics to track, let's review some key differences from Universal Analytics.
Different measurement approach
GA4's event-based model differs from Universal Analytics' session-based approach.
Think of it this way: GA4’s web analytics capture each user interaction as a separate event rather than grouping them by session. It also tracks user behavior across all their devices and platforms, while UA used to track separate sessions for each device. Adapting to GA4’s event-based model means you’ll need to adjust your conversion tracking and tag configuration.
You might notice some differences in your conversion numbers between UA and GA4. Here's what we recommend to keep your tracking accurate and avoid any reporting surprises.
- Review how your conversion events are set up
- Consider adding backup tracking methods (like Google Ads pixels)
- Cross-check your data across different analytics tools, like comparing your GA4 metrics with Google Search Console, to ensure your organic traffic numbers line up properly.
Changes to metrics
Some UA metrics no longer exist. Other metrics, like total users and new users, have different meanings in GA4. Instead, you’ve got new metrics like:
- Conversions: In UA, conversions were called 'Goals,' while GA4 refers to them as key events.
- Page views: GA4 tracks page views simply as views, measuring total screens/pages viewed, while views per user shows the average number of pages each user viewed. This replaces UA's previous metrics of page views and unique page views.
- Bounce rate: This metric is replaced with engagement rate, which measures the number of sessions longer than 10 seconds, containing more than 2 page views, or having a key event trigger.
To help you compare the differences between the two systems, we've compiled a list of UA metrics and their comparative GA4 metrics for easy reference. But beyond understanding these metric changes, what matters most is how you use this data. As you review which GA4 metrics to track, think about these two questions.
- What questions do you need to answer with GA4 data?
- Which metrics will help you answer these questions?
Key GA4 metrics you need to track
At first glance, GA4’s metric list is frankly overwhelming. Multiple categories, combined with over 200 metrics (not including dimensions) available? What’s relevant for your report?
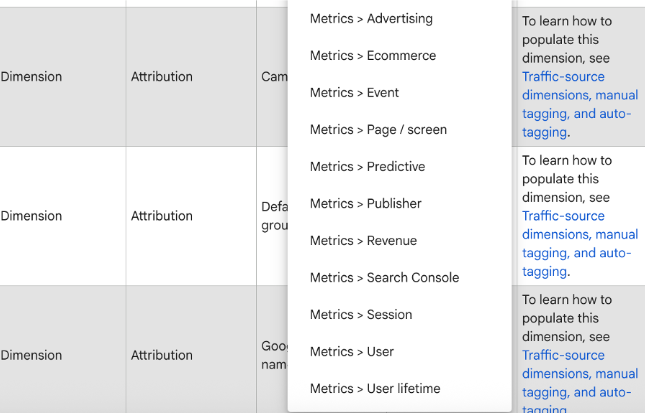
We feel the same!
So to help you, we’ve broken this list into different categories, including how each metric relates to client reporting, so you can decide if these apply to your campaign and business goals.
Engagement metrics in GA4
The true measurement of engagement isn’t how many page views you see or how long you spend on the page—it’s how active your website visitors are.
GA4 emphasizes prioritizing and measuring user engagement and introduces several metrics to help you measure how visitors interact with your website or mobile app.
"Kyle Sobko, CEO of SonderCare, shares how his team uses GA4's engagement metrics to drive optimization:
“GA4's user journey module helps us identify where users drop off on landing pages and calls-to-action,' explains Sobko. 'This shows us exactly where we need to enhance the user experience.”
His team uses this data to inform their A/B testing strategy: “We analyze bounce rates alongside other engagement metrics to determine which page elements need testing. This helps us create meaningful variations in both content and design.”
Engaged sessions
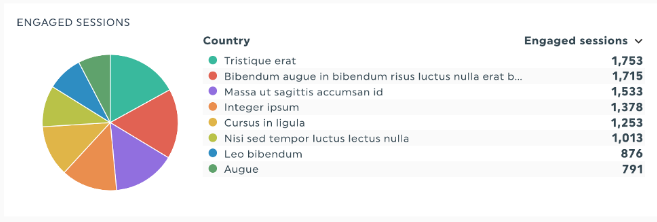
GA4 introduces engaged sessions, which are defined as sessions where a user:
- Has two or more page views or app screen views
- Has an average session duration of 10 seconds or longer
- Had a conversion event, like filling out a lead conversion form
Think of engaged sessions like this: They tell you whether your site or app was interesting enough to keep someone's attention. A PC World study shows that the average person regularly jumps between 5 and 10 tabs. Engaged sessions show you kept visitors focused on your tab instead of getting distracted by their Instagram feed or another tab.
Maybe they liked your content so much they signed up for your newsletter or used your site's search bar to look for something specific. This is super helpful if you're a content marketer trying to figure out if your content strategy is engaging people or if you're running an online store and want to see if visitors are browsing products, adding stuff to their cart, and making it to checkout.
Client reporting examples:
- Compare engaged sessions by marketing channel to justify budget decisions: "While LinkedIn drives 1,000 monthly sessions compared to Instagram's 800, Instagram users are 40% more likely to have engaged sessions that lead to demo requests. Shifting 30% of the LinkedIn budget to Instagram could increase qualified leads by about 25%."
- Link engaged sessions to revenue impact: "The blog posts optimized based on engaged session data generated 45% more marketing qualified leads this quarter, contributing an additional $50,000 to the sales pipeline."
- Guide content strategy with engagement insights: "Product comparison pages have three times higher engaged sessions than feature pages, with 60% of these sessions leading to demo requests. Prioritizing product comparison content could increase demo requests by an estimated 40% next quarter."
Engagement rate
Engagement rate is the number of engaged sessions expressed as a percentage. It’s calculated using the formula (engaged sessions / total sessions) x 100.
So, if you have 400 engaged sessions out of 1000 total sessions, your engagement rate is 40%.
Notice that engagement rate is the inverse of the old UA metric bounce rate? With GA4’s definition of engagement, it’s a more accurate measure of engagement than bounce rate. Bounce rate in UA measures the number of people who left without navigating to another page.
But if someone spent five minutes reading your blog post thoroughly without clicking on another link, UA would count that as a bounce, even though they engaged with your content. This new definition fixes that loophole by tracking additional engagement signals like session duration and conversion behavior.
Client reporting examples:
- Track engagement rate trends before and after site updates to show clients clear evidence of website performance improvements. For example, "After implementing our recommended site speed optimizations, engagement rate increased by 15%, showing visitors are now staying longer and interacting more with your content."
- Identify top-performing content formats by comparing engagement rates across different blog topics and formats. Say something like: “The recent thought leadership content from your executives consistently achieves 70% engagement rates compared to 45% for how-to content. This suggests it’s worth investing resources on thought leadership and adjusting our search engine optimization (SEO) strategy to distribute these pieces.”
Average engagement time
Average engagement time tells you how long users spend actively engaging with your site or app, not just having it open in a background tab while online shopping or attending to Slack messages.
What’s a good average engagement time in GA4?
Data from digital marketing agency Noble Intent Studio's clients puts the average engagement time in GA4 at 52 seconds. However, this number varies depending on the type of content you’re analyzing and the intent they fulfill.
To make this metric more relevant, create your baseline for different content types by comparing average engagement time across similar pages and looking for unusual patterns. Notice a sharp drop in engagement time and leads from one of your landing pages that usually delivers quality leads? These are trends worth investigating.
Client reporting examples:
- Highlight how engagement increased during specific marketing initiatives to build confidence in campaign performance. For example, you could tell clients, “Our recent email campaign drove 45% more engaged sessions than previous campaigns to your website, which translates into more demo requests and puts us on track for our lead generation goal.”
- Justify marketing budget allocation by showing which channels bring in highly engaged users.
- Guide strategic decisions by showing clients which content types or landing pages keep visitors engaged.
Client reporting tip: Connect engagement data to business outcomes when presenting to clients. For example: "The 40% increase in engaged sessions translated to a 25% lift in qualified leads, showing that visitors from this channel are not just casually browsing, they're taking meaningful actions like filling in a free trial form relevant to your revenue goals.
Traffic acquisition metrics in GA4
While we don’t recommend you focus exclusively on web traffic metrics (quality of traffic also matters!), increasing traffic also improves your content reach and the number of people aware of your brand and marketing campaigns. It’s also a good measure of whether your ad campaigns and landing pages function properly.
Session_start and Total sessions
A session represents a single visit to your website or app. It starts when someone lands on your site and includes all their activities until they either:
- Are inactive for 30 minutes
- Close their browser tab
- End the session at midnight
GA4 tracks sessions in two ways:
- Session_start: An automatic event that fires once at the beginning of each session
- Total sessions: The total number of sessions during your selected time period
These metrics should closely match, as any significant differences may indicate tracking issues you’ll need to investigate.
Client reporting examples:
- Identify peak engagement periods in a day by analyzing new session patterns in a specific time frame. You could say: "Analysis shows afternoon sessions between 2-4pm have 30% higher conversion rates."
- Show campaign impact. For example: Your website attracted 25,000 sessions this month, a 30% increase from last month.
- Compare channel effectiveness, like: "While organic search drives more first-time sessions, email campaigns generate three times more repeat sessions")
Client reporting tip: When justifying budget allocation across channels, combine session data with traffic quality metrics like conversion rates, ROI, and engagement. This will give you a more complete picture of each channel’s effectiveness.
New users, returning users, and active users
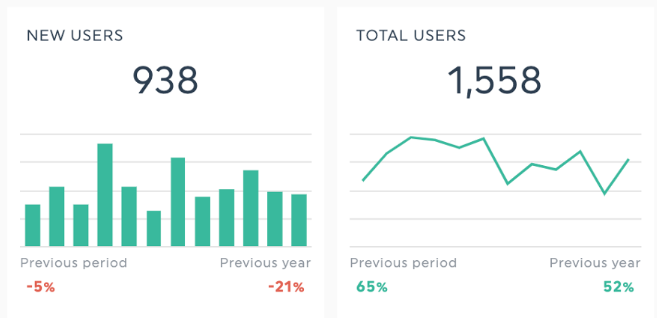
GA4 introduces a few metrics to describe user behavior.
- New users: The number of unique users who have never visited your site or app in a specified time duration.
- Returning users: People who have visited your site or app before in the specified date range.
- Active users: People who engaged with your site or app in the specified date range
Use these metrics to track the quantity and quality of the traffic you attract to your website or landing page. Here are some examples of using them in your client reporting.
- Understand audience growth patterns and show campaign impact to clients. For example, if your client wants to expand into a new market vertical, try saying something like: "Your user base grew by 25% this quarter, with 60% of growth coming from our LinkedIn campaign targeting enterprise decision-makers.
- Analyze user retention trends to show the effectiveness of your nurturing strategies. Word it like: "While we attracted 1,000 new users this month, our returning users made up 40% of total traffic, showing our email nurture campaign successfully maintains audience engagement with your brand. This is a 15% increase in returning users compared to last month, which means we can replicate this sequence for other email campaigns.
Client reporting tip: These new user metrics can confuse clients because they sound so similar. If you're including these metrics in your report, use DashThis’s notes and comments feature to note the difference between each metric and guide clients in understanding the definitions and their relevance to your report.
Event metrics in GA4
While users and sessions tell you how many people visit your site, events reveal what they do there. For agencies, refer to event metrics to prove campaign effectiveness beyond driving traffic to your site.
Event count per user
When a client asks, "Are visitors actually engaging with our site?" refer to the event count per user to answer the question. This metric shows the average number of meaningful interactions each visitor takes, from viewing product pages to downloading resources.
For example, if your average visitor triggers two events but your email campaign drives visitors who trigger five events, you have concrete proof that your email strategy drives higher-quality traffic.
Client reporting examples:
- Show clients how deeply visitors are engaging with their website beyond traffic metrics. For example: "While your referral site traffic only grew by 10% this month, each visitor triggered 4.2 events on average, from viewing multiple product pages to downloading a content offer.
- Detect UX issues early: "While overall traffic is up 20%, event count dropped from four to two events per user after the new site launch. This shows potential UX issues we should address in the navigation and CTAs."
Event value
Event value is the monetary value you assign to an interaction in Google Analytics 4 to understand the ROI of your marketing efforts. Let’s use a hypothetical example to illustrate.
Suppose your client wants to know how much a completed qualified lead form is worth to their business for sales pipeline analysis and revenue projections.
Based on an average deal size of $5,000 and a 20% close rate, each qualified lead form submission is potentially worth $1,000. In GA4, you can give this event an event name of qualified_lead_submission and assign the lead form completion event $1,000, giving your client visibility on potential revenue.
Tip: Besides event value, you can use GA4’s event parameters to add more context to your data. In a lead generation context, event parameters can capture details like company size, source campaign, or session source, and which service they’re interested in to guide your follow-up efforts.
Check out our GA4’s event parameters guide to find out how to use these in your data analysis and reporting.
Key events
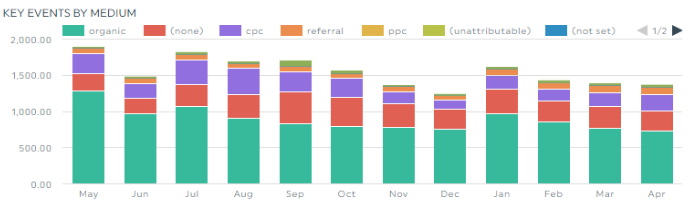
Think of key events as decisive moments when visitors take meaningful actions on your site or app. These could be revenue-generating actions like making a purchase. Alternatively, you could track important micro-conversions like a free trial sign-up or a demo request.
These micro-conversions don’t directly lead to revenue, but they signal people are on the verge of converting or serve as strong purchase indicators. In GA4, tracking these micro-conversions as key events can help you identify what interactions lead to purchases and optimize your customer journey.
Here’s how Paul DeMott, Chief Technology Officer of Helium SEO, uses micro-conversion data from GA4 to improve conversion rate for their clients.
“At Helium SEO, we rely on GA4’s event-based tracking to map micro-conversions, like button clicks, scroll depth, or time spent on pricing pages. One SaaS client had low demo sign-ups despite strong top-of-funnel traffic. Using custom events in GA4, we noticed users spent time on the features page but didn’t scroll to the CTA. We shortened the page, added a sticky CTA, and conversions increased by 22%.”
By tracking these micro-conversions in GA4, you can identify specific friction points in your conversion path and make data-backed UX improvements for your clients.
Session and user key event rate
Key event rates can be further divided into two types, each serving a different purpose for analysis.
Session key event rate shows the percentage of sessions with a key event. It’s perfect for analyzing immediate conversions, such as whether visitors convert right after clicking an ad or during their first landing page visit.
User key event rate shows the percentage of users who eventually trigger a key event across multiple sessions. Use this metric to understand customer journeys over time, plan remarketing campaigns, or identify drop-off points to optimize.
Monetization and conversion metrics in GA4
Do you want to show clients exactly how your marketing efforts drive their bottom line? These metrics help attribute marketing activities to revenue.
User lifetime value (LTV)
How much have you earned from a user during their lifetime? Which customer segment brings in the most revenue over time? Answer these two questions using the LTV metric.
It’s calculated using the formula: User lifetime value = customer value X average customer lifespan.
Calculate this using the user lifetime exploration in GA4
Pro tip: Always present LTV alongside customer acquisition costs (CAC) to give clients a complete picture of marketing ROI. The LTV: CAC ratio helps determine if your marketing strategy is financially sustainable in the long term.
Client reporting examples:
- Show the long-term value of your marketing efforts by comparing LTV across different acquisition channels. For example: "While organic Facebook leads have a lower initial conversion rate, their 12-month LTV is 40% higher than Google Ads leads, suggesting we should continue investing in our Facebook presence.
- Guide customer retention strategies by identifying high-value traffic sources. You might say: "Customers who first engage through your blog content have a 30% higher LTV than those who come directly through ads, indicating content marketing is effective at driving LTV.
- Justify marketing spend by connecting acquisition costs to lifetime revenue. For instance: "Though our cost per acquisition from LinkedIn campaigns is $200 compared to $150 from Google Ads, LinkedIn customers have an average LTV of $2,000 versus $1,200 from Google Ads - making LinkedIn a more profitable channel in the long run."
Total Revenue
Total revenue answers an important question for marketers: Are our marketing activities contributing to business revenue? It’s the sum of all revenue generated from purchases, subscriptions, and advertising, minus any refunds.
Tip: Present revenue metrics alongside relevant context metrics like conversion rate, return on ad spend (ROAS), or average order value. This helps tell your client how much you spend to earn the new revenue.
Client reporting examples:
- Compare revenue trends across different time periods to show campaign impact. For example: "Your Q4 revenue increased 32% compared to Q3, with the highest gains coming from our holiday email campaign which generated $125,000 in direct sales."
- Break down revenue by marketing channel to justify budget allocation. You might say: "While organic search drives 40% of total traffic, paid search accounts for 60% of total e-commerce revenue, suggesting we should increase our Google Ads budget for high-converting keywords."
- Show ROI by connecting UX changes to revenue growth. For instance: "The new product web pages we launched generated $50,000 in revenue this month, representing a 400% return on your investment in the redesign."
What if I need to measure something else?
Do you need to measure an interaction not covered in the list above or GA4’s standard metrics?
No problem; that’s what custom metrics are for.
Need to track metrics not covered above? GA4 allows you to create custom metrics tailored to your specific needs. Refer to Google's step-by-step guide here.
GA4 report template
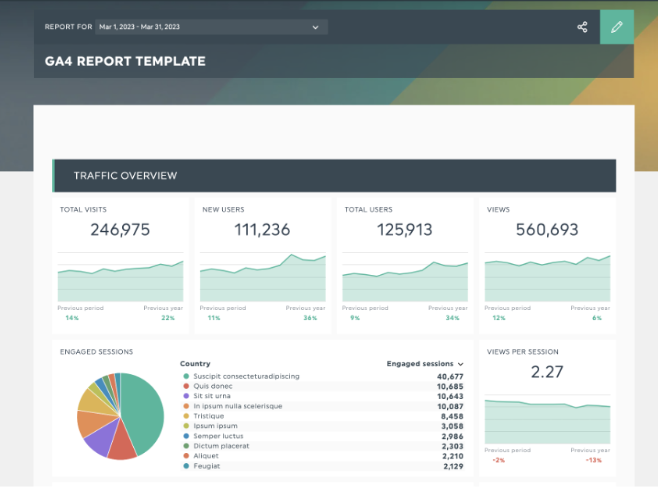
Get this Google Analytics 4 report with your own data!
GA4 collects a lot of data, and you’ll likely face these challenges:
- How do you weave multiple data metrics into an engaging story that proves your marketing campaign's effectiveness to clients and leadership?
- How do you combine data from different marketing tools and social platforms without spending your entire day reporting or fiddling with manual import/export data?
- How do you ensure your data remains accurate and comprehensive enough for meaningful reporting?
Here’s where an automated reporting platform like DashThis can help you address these day-to-day challenges. We’ve created a GA4 report template with the important metrics to save you time on client reports.
Otherwise, if you're focusing your analysis on a specific category of GA4 data, use DashThis’s GA4 widget bundles to add related metrics in a category quickly.
Combine your GA4 data with your Google Ads data, SEO campaign reporting, and social media metrics to get a complete picture of your web analytics and marketing campaign performance. DashThis integrates with 34+ digital marketing tools to make data management and updating your reports easy.
Here’s how to make quality GA4 reports with DashThis in minutes (maybe even seconds)
- Sign up for your 15-day free trial of DashThis
- Connect GA4 and your favorite marketing tools
- Select your metrics from DashThis’ preset widgets or get started with our GA4 report template
- Drag and drop your metrics to create your own GA4 dashboard! You can add or remove metrics, switch chart types, and customize your report as you please.
- Automate report delivery with DashThis's scheduling options: email delivery, shareable URLs, and PDF exports.
Automate your GA4 metrics reporting with DashThis
Choosing the right GA4 metrics is critical to track the right metrics for your client’s business goals.
Whether you're measuring how engaging your content is, how well your traffic converts, or proving marketing ROI, these metrics help give valuable insights on what’s working with your clients and what needs improvement.
Ready to simplify your GA4 reporting? Take DashThis for a spin with our 15-day free trial and see how simple client reporting can be.
Track all your ecommerce KPIs in one easy-to-use, good-looking dashboard!

Start reporting on your GA4 metrics today
Read More

Don’t miss out!
Follow us on social media to stay tuned!
Automate your reports!
Bring all your marketing data into one automated report.
Try dashthis for free