Web Traffic Metrics - How To Track And Measure Website Success

A website is the heart of any online business, and knowing what to measure makes your job easier.
Read on to see why web traffic metrics matter, the most important metrics to include in your client reports, and how analytics tools DashThis can simplify the process.
- What are web traffic metrics?
- 4 reasons to measure web traffic metrics
- Top web traffic metrics examples to track
- How to track web traffic metrics with DashThis
- Automate your web analytics reporting with DashThis
What are web traffic metrics?
Which pages do visitors visit on your website? How long do they stay on your blog? Which traffic source attracts the most engaged traffic?
Answering these questions is the bread and butter of website metrics.
Based on your business goals and reporting requirements, here's a quick overview of the key metrics to include.
Visitor Data:
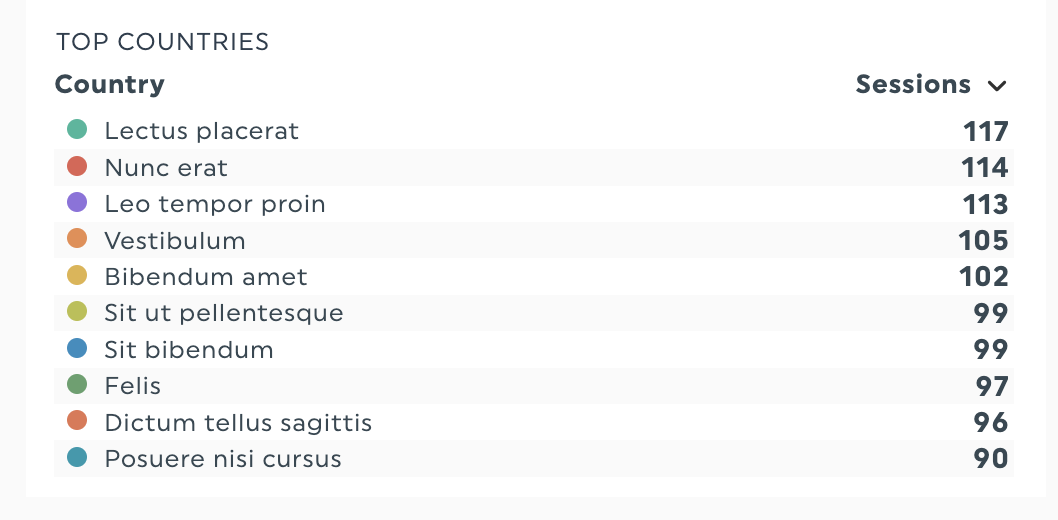
Purpose: Learn more about your audience, where they're from, and how they found your site to tailor your content and marketing campaigns
Example metrics: Top countries, visitor age and gender breakdown
Engagement metrics:
Purpose: Measure how visitors interact with your content
Example metrics: engagement rate, page views, pages per session
Conversion KPIs:
Purpose: Find out how well your website converts visitors into customers or leads
Example metrics: conversion rate, cost per acquisition, click-through rate from ad to landing page
Traffic sources:
Purpose: Identify which marketing channels drive the most site traffic to your website
Example metrics: direct traffic, referral traffic, organic search traffic, email traffic, paid search traffic.
4 reasons to measure web traffic metrics
It helps with data-driven decision-making
Making business decisions without website analytics is like flying a plane blindfolded.
Aside: While flying a plane blind is possible, like the inspiring story of Dr. Helen Keller, it’s not a path for everyone.
Here’s where tracking web traffic metrics is your navigator to make the right decisions.
Having all these data points will help you figure out what's working and what's not. Take an e-commercestore. Courtney Lindau from web analytics consultancy Nimble Gravity explains which touchpoints to track for an online T-shirt seller:
Make sure you have all your conversions tracked. See how many people buy T-shirts and how many people visit the product descriptions for the T-shirts so that you can see their journey from home page from whatever marketing campaign to completing the goal of buying a T-shirt to see where people might be dropping off from the funnel.
Get the right insights to optimize your website’s user experience
User behavior data from Contentsquare shows site visitors spend less time on pages and scroll less in 2023. This means you’ll need to optimize your website for a shorter attention span by keeping call-to-actions on top and paying attention to site performance.
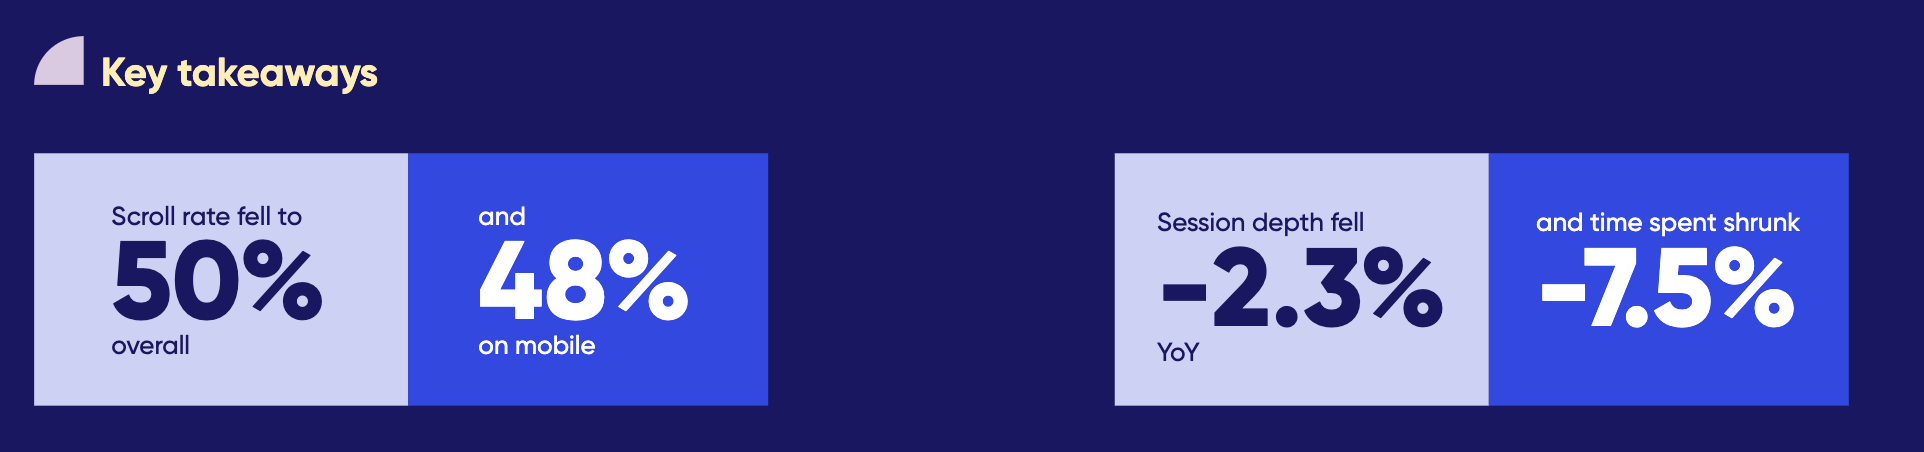
Source: Contentsquare’s 2023 Digital Experience Benchmarks
Track metrics like returning visitors, engagement rate, amount of time on page and engaged sessions to ensure your website elements and content keep people engaged to move them towards your content or offers.
Assess the return on investment (ROI) of your marketing
Half of marketing budgets go towards demand generation and conversion-boosting activities, according to a 2023 Gartner report on marketing budgets.
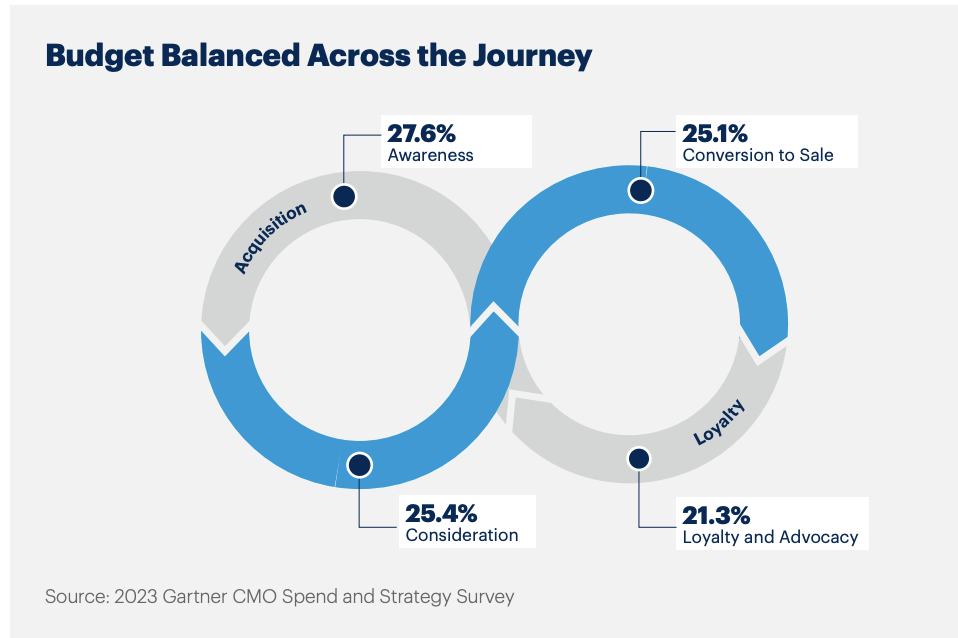
Keeping tabs on metrics like return on ad spend (ROAS) and cost per conversion helps you gauge the effectiveness of your marketing efforts and ensures you're getting the most from your budget.
Top web traffic metrics examples to track
1. Page views (Views in GA4)
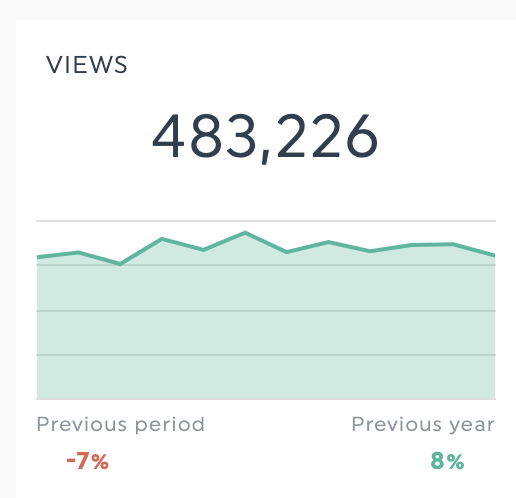
Page views measure how often people view a page on your website.
While vague on its own, this metric shines when used as a comparison metric. For example, you could compare page views to the number of conversions to identify top pages. Or measure daily page views per unique visitor over time to get an idea of how effectively your content engages your visitors.
2. Page views per session
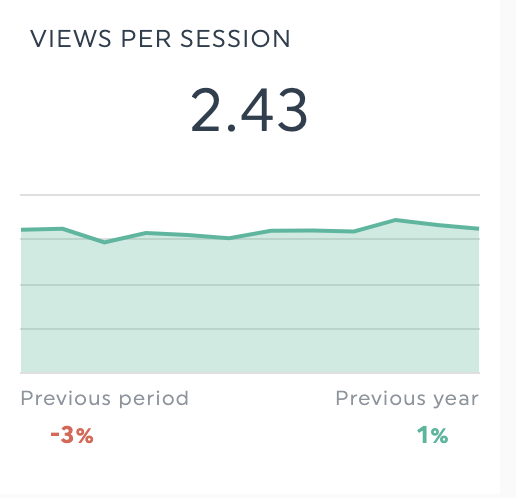
Page views per session measure the number of pages a visitor views per session and are a crucial engagement indicator.
This metric matters because engagement correlates with conversions. Data from Contentsquare’s benchmarks show converting visitor journeys see five times more page views than typical sessions. Monitor frequently visited pages and exit pages to identify points of friction. (GA4’s Explorations and User Purchase Journey Reports are helpful to track how your visitors browse your website)
3. Unique visitors
Unique visitors measure the effectiveness of your traffic acquisition strategies. Are your number of visitors growing from quarter to quarter? Monitor this metric if you’ve launched a new single-page website, rebranded your client website or reviewing your search engine optimization (SEO) rankings.
4. Engagement rate/bounce rate
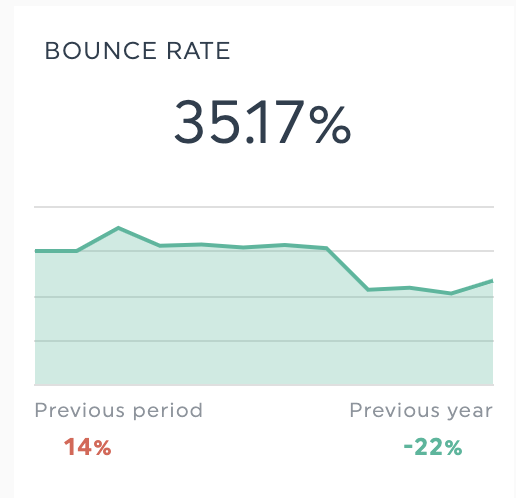
Engagement rate measures the percentage of engaged sessions on your website or mobile app. These sessions last longer than 10 seconds, have at least 2 page views, or trigger a conversion event. If any of these three conditions happen, your visitor’s visit is engaged.
Note in GA4, the bounce rate is the inverse of the engagement rate. A high bounce rate is a low engagement rate.
What’s a reasonable engagement rate? According to Orbit Media’s analysis of 65 client websites , it depends on where the visitor came from. Organic search engagement ranks the highest at 62.2%, and paid social the lowest at 24.1%. It’s worth segmenting the average engagement rate by traffic source to ensure you analyze your data correctly.
5. Average session duration
This average time metric gives you an impression of how valuable people find your website content. It’s also linked to website user experience, which growth advisor Kevin Indig defines as:
- Speed and website performance: How quickly does a website load?
- Look and feel: Does the website feel good to use?
- Ease of orientation: Can I quickly find the content I’m looking for on web pages?
- Webpage experience: Is the content legible or easy to read?
- Ease of navigation: Does the website follow a clear, logical structure?
If you’re seeing low session durations, review your website along with these factors.
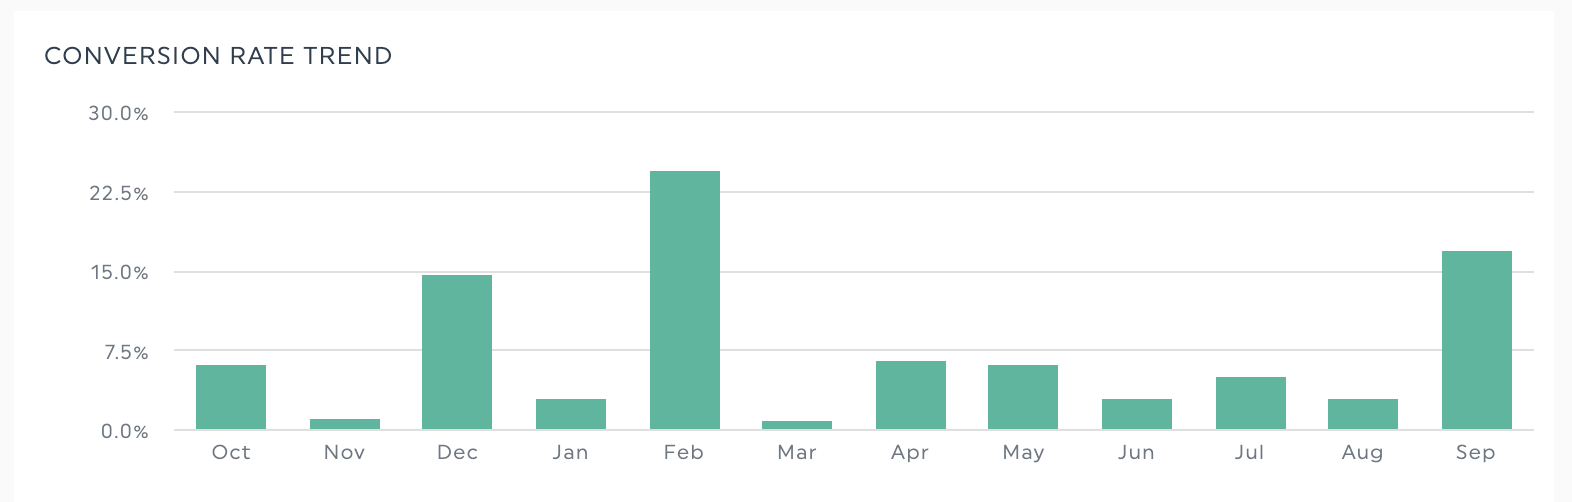
6. Conversion rate
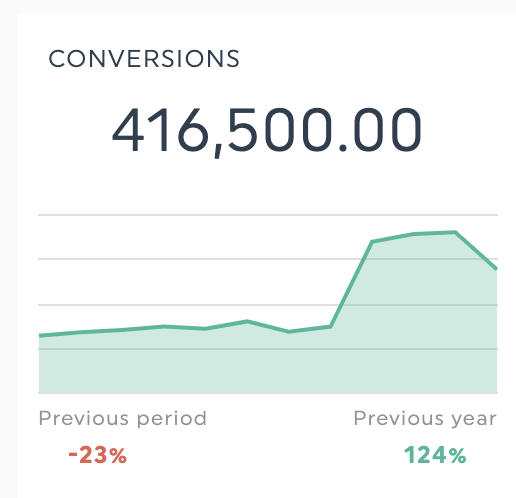
Conversion rate measures how many people took a desired action against its total website visitors. It could be anything that signals engagement (signing up for a newsletter) or an activity that moves them to another stage in the purchasing journey, like adding a product to cart or signing up for a free trial.
While higher conversion rates are usually a positive signal, track this metric against return on ad spend and customer lifetime value to ensure you’re optimizing for revenue.
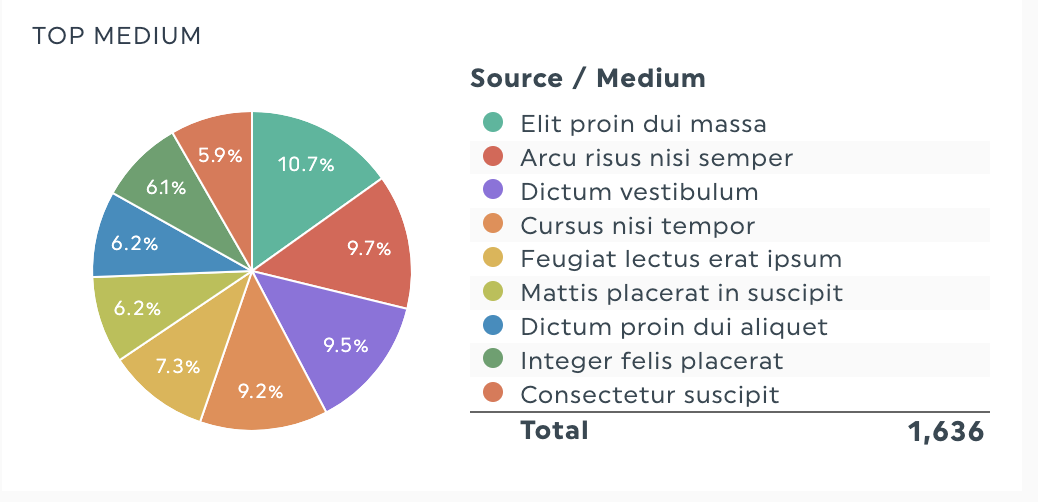
7. Traffic data
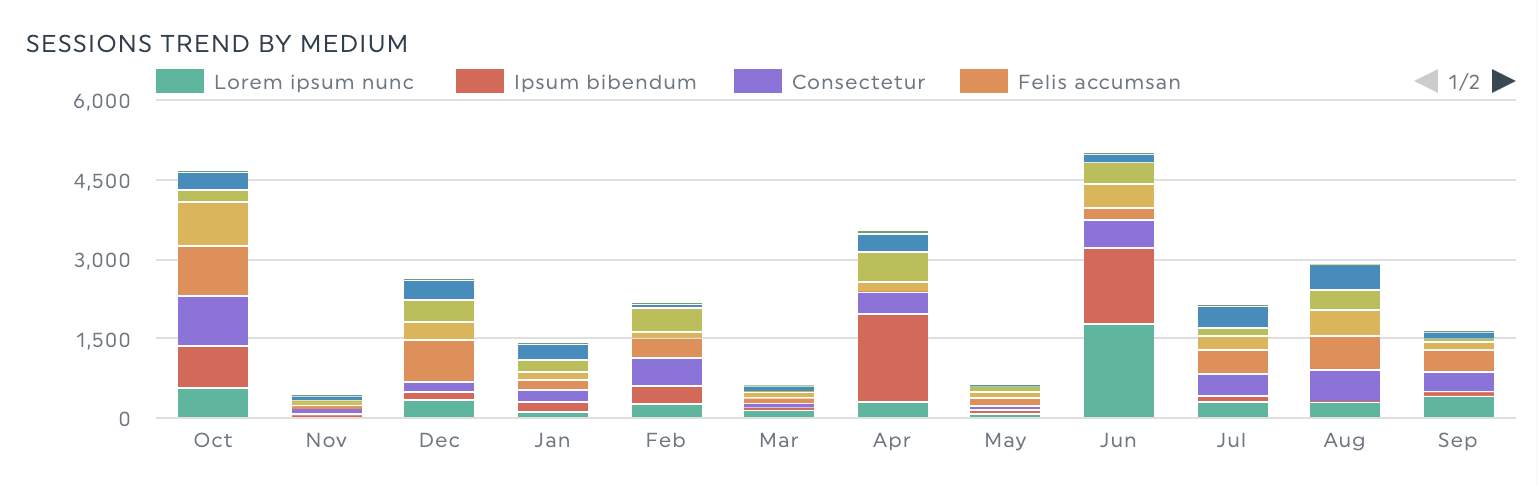
Use the traffic sources report to pinpoint which marketing channels are the most effective at bringing people to your website.
To pinpoint the most profitable or cost-effective marketing channels, combine the data from your traffic sources report with your overall page views, conversion rate by channel, and page views per session.
5 primary traffic sources:
- Direct traffic: People who typed in the site directly
- Referral traffic: Traffic referred to your site by other sources that aren’t a social media platform, like a media company or a content creator’s blog
- Organic search traffic: An indicator of SEO performance, this measures people who found your website via a search engine like Google, Bing or Brave
- Paid search traffic: Traffic from your paid ads campaign like Google Ads, TikTok Ads or Instagram Ads
- Social media traffic: Traffic from people who visit your website from a social media platform like TikTok, Instagram (including Instagram messages) or Facebook
8. Returning visitors
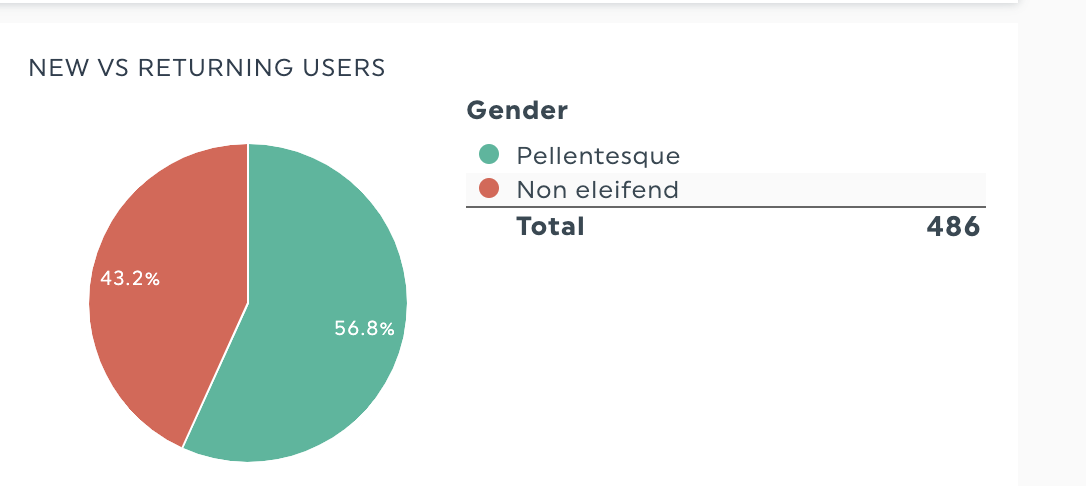
Set your marketing strategy according to your returning visitors metric to prioritize gaining new visitors or encouraging people to return to your website. The exact ratio of new users vs. returning visitors depends on your industry and website, but aiming for 30% return visitors is a good start.
How to track web traffic metrics with DashThis
Reporting tools like DashThis simplify your web traffic analysis in a professional dashboard. Want a breakdown by source or device type of where your visitors come from this month alongside your Facebook or TikTok metrics?
Or track your client’s SEO strategy metrics like backlinks and search engine results with overall website traffic trends? DashThis helps combine different reports together for easy analysis.
The DashThis difference: Investing in client reporting enables better relationships and client retention.
Read on to see how web marketing agency Rablab uses DashThis to impress their clients with better-looking, more functional web traffic reports while saving 4 hours of work per month per employee. It’s easier for them to educate their clients on their actions while showing results.
Here's how you can get started with DashThis in 3 steps:
- Sign up for your 15-day free trial here
- Add your data sources
Connect your web analytics tools like Google Analytics and Google Search Console. DashThis also integrates with 34+ popular digital marketing tools, so you can get all your data in one place.
Once done, click on Create Dashboard and you’ll get a pre-populated dashboard to customize
Don’t forget to save your dashboard to make a copy for future reports.
- Drag and drop as you desire to build your report.
Customise DashThis’s report templates by selecting metrics from DashThis’s preset widgets.
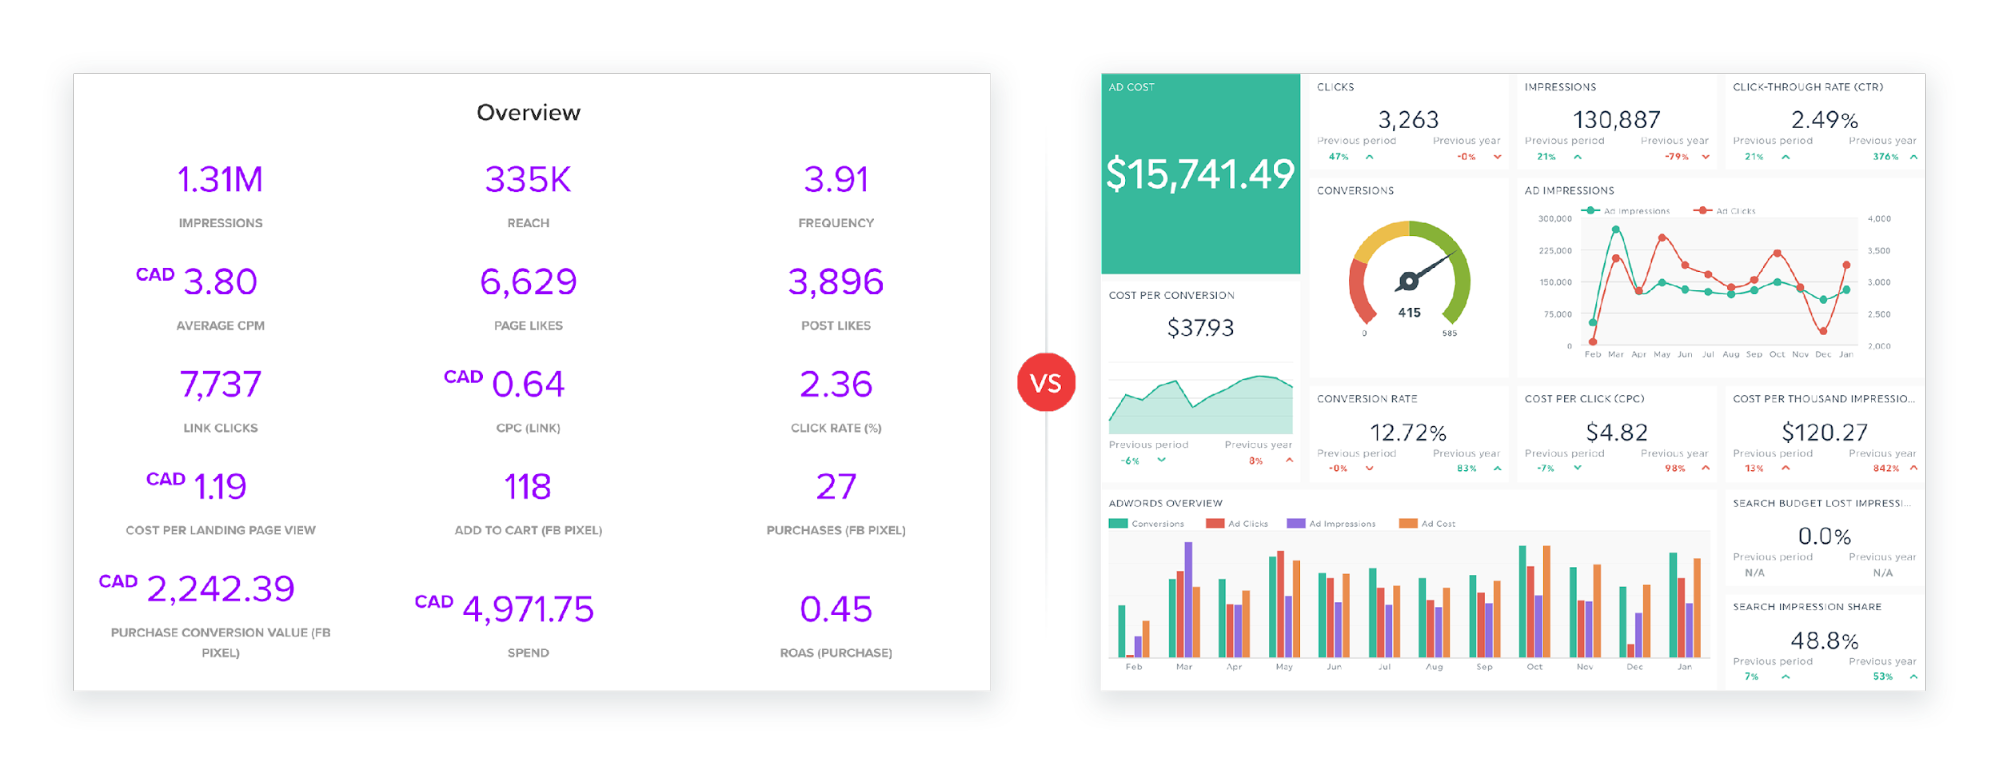
Report template spotlight: Digital marketing report template
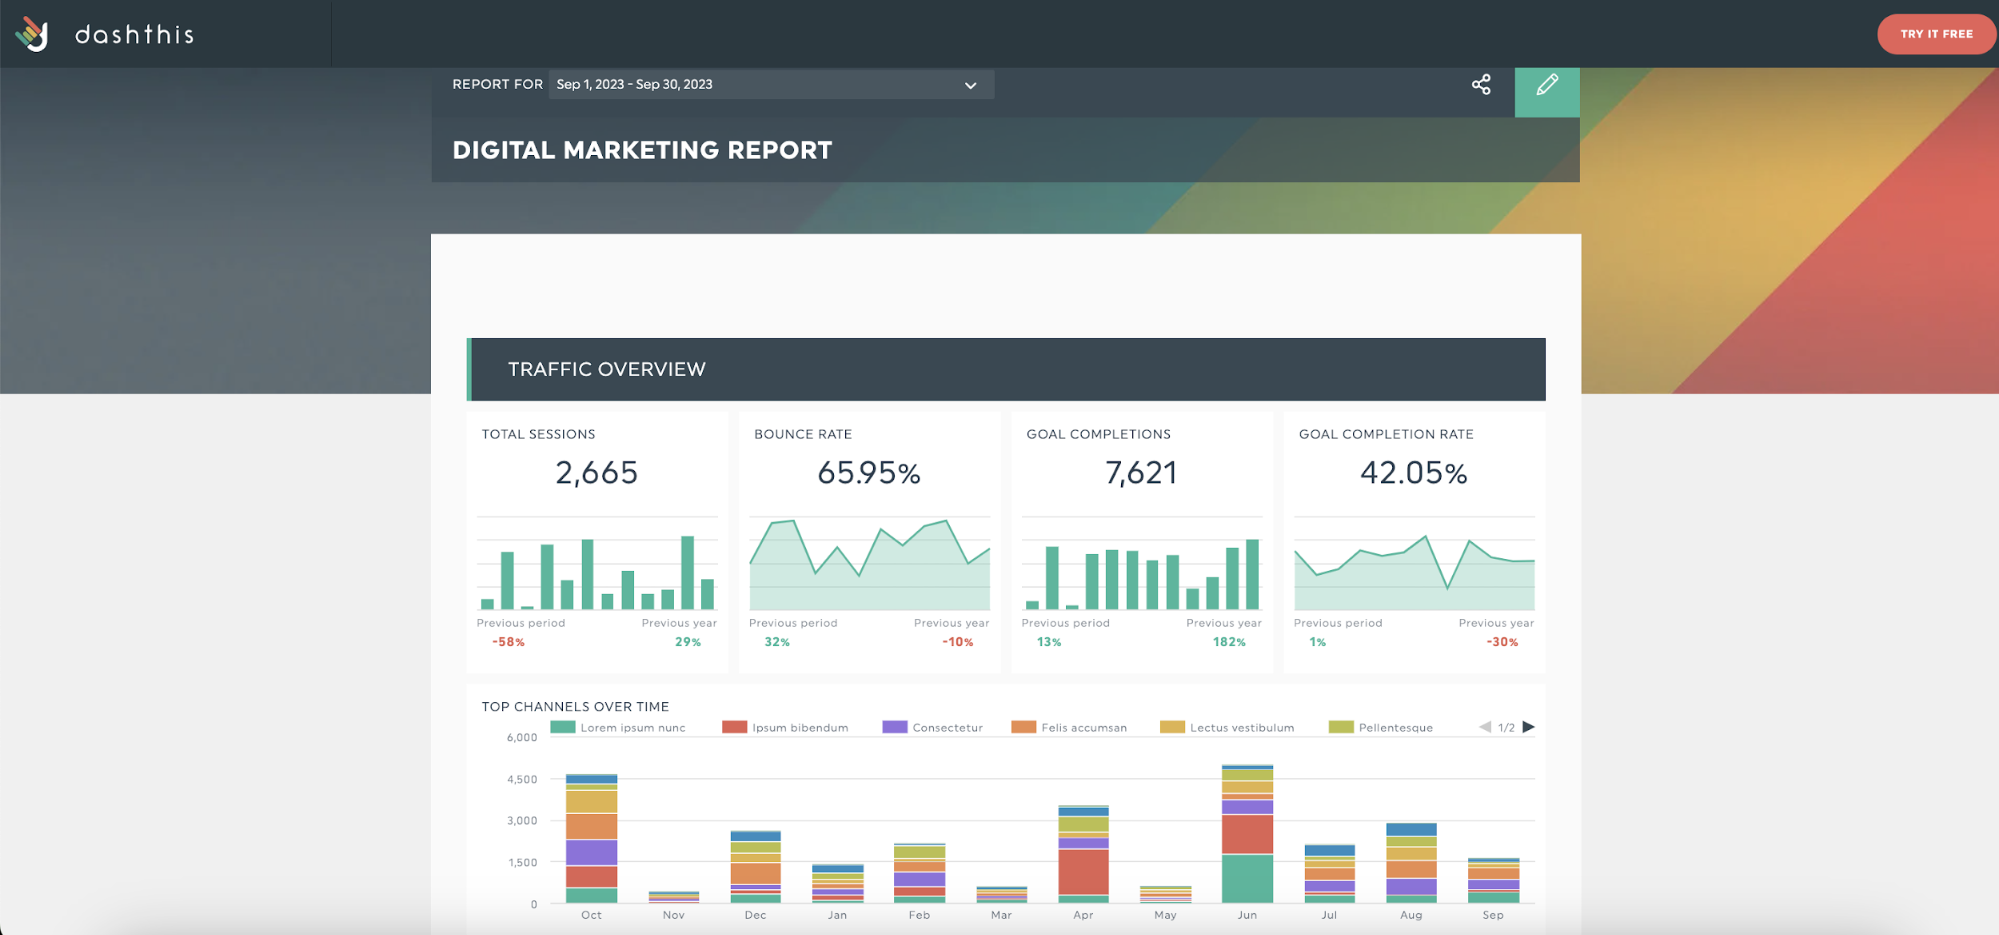
Get this digital marketing report template with your own data!
Marketing involves multiple channels simultaneously, and staying on top of metrics AND reporting on them can be mind-boggling. Use our digital marketing report template to track the effectiveness of your marketing campaigns in driving and engaging web traffic to your client’s website.
Use our digital marketing report template to:
- Analyze results from multiple marketing channels and web analytics tools like Facebook or Google Search Console
- Showcase your campaign results and impact on your client’s bottom line
- Invest in your client-agency relationship through fantastic client reporting
Save even more time by saving your templates for later use! When a client needs a new report from our customer Rablab, all Rablab has to do is customize the pre-filled template to the new client’s needs by removing any data or marketing platforms that aren’t relevant, keeping only the needed information.
Automate your web analytics reporting with DashThis
You need clean, accurate data to create reports and make informed decisions.
However, manual data entry makes it easier to make mistakes. You could copy the wrong row or misread the data you’re pasting, making your report ineffective.
With DashThis’s automatic data import and clean, intuitive dashboards, you no longer have to worry about making these mistakes. Plus, you’ll spend less time creating reports - an easy win-win for you and your client. Save yourself hours on reporting headaches with automation.

Ready to start tracking your web traffic metrics?
Read More

Don’t miss out!
Follow us on social media to stay tuned!
Automate your reports!
Bring all your marketing data into one automated report.
Try dashthis for free