Ten key website performance metrics you should track

Is your website bringing in business or costing you clients?
This is where looking at website metrics can help answer that question.
But which website metrics should you track?
Newcomers using web analytics tools like Google Analytics for the first time can be overwhelmed.
Not to worry, we’re here to help!
Our guide will show you the critical website metrics that matter.
- 10 most important website metrics to track
- How do you measure website performance metrics?
- Get insights on how your website is performing
What are website metrics?
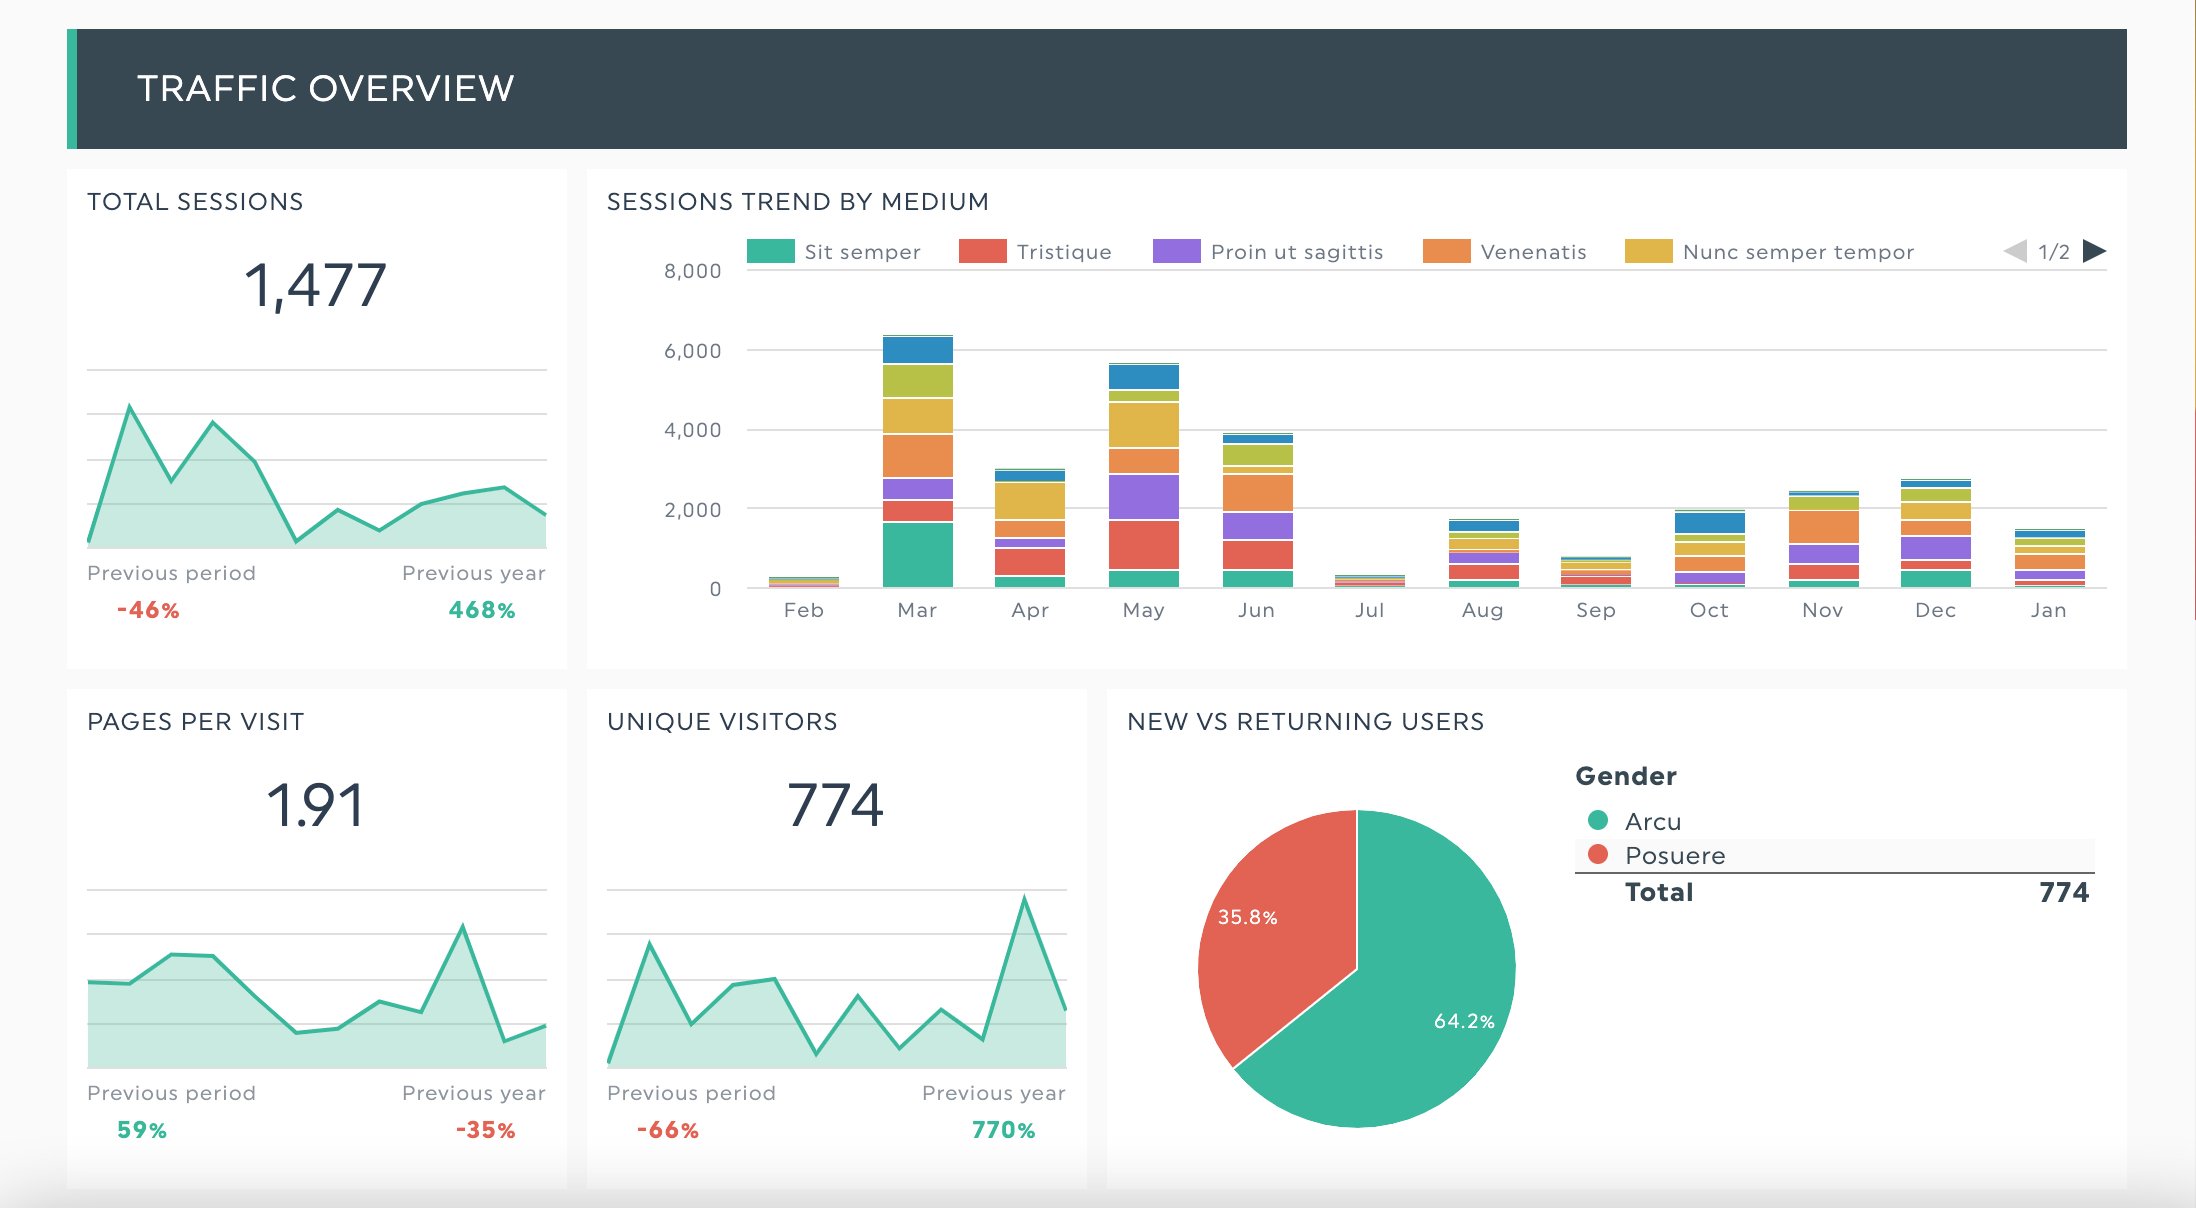
DashThis’s website metrics template. See this template with your data.
If your website is an employee, website metrics are their key performance indicator (KPI) metrics.
At a glance, website metrics help you answer three questions:
- Is my website traffic growing?
- Is my website bringing in new business?
- What are people doing on my website?
With the proper measurements, website metrics help you understand which aspects of your website are working and which you can improve.
Assessing overall website health? Look at your visitor metrics.
Should you run a mobile marketing campaign? Analyze your traffic report to see how many of your users come through mobile devices
Knowing website metrics also helps you track the progress and impact of any initiatives, allowing you to deliver business impact where it counts for your target audience, customers, or internal stakeholders.
Ten most important website metrics to track
If you’re new to website performance metrics or analytics tools, you may wonder; which metrics are essential?
We’ve narrowed it down to these ten. Any website owner can take and turn these website metrics into actionable recommendations to enhance your website performance.
- Click-through rate (CTR)
- Number of visitors
- New versus returning visitors
- Bounce rate
- Average session duration
- Pageviews per session
- Top viewed pages
- Exit pages (and top exit pages)
- Traffic source
- Device sources
1. Click-through-rate
Click-through rate measures the ratio of web visitors clicking on a link on your website versus the total number of visitors.
It tracks how engaging your web content is or the relevancy of your website to an organic search term.
Higher click-through rates mean more web visitors per impression and increased conversions - all positive trends to have in isolation.
However, look at other metrics like bounce rates to ensure people landing on your website aren’t leaving without engaging with your content.
2. Number of visitors
When assessing your overall site health or website effectively, your traffic numbers or unique visitors is the first number to look at when determining your overall site health or website. It answers a critical question: “are people visiting my site?”
This number tells you at a glance if your website is growing, on the decline, or stagnant.
It also shows opportunities to bring in more traffic, typically through search engine optimization to improve organic search traffic, social media or optimizing direct or referral channels.
While the number of visitors is handy as an overview metric, looking at this metric alone is usually too broad to make a decision. Combine this with other, more in-depth metrics like new versus returning visitors or traffic sources for more context.
3. New versus returning visitors
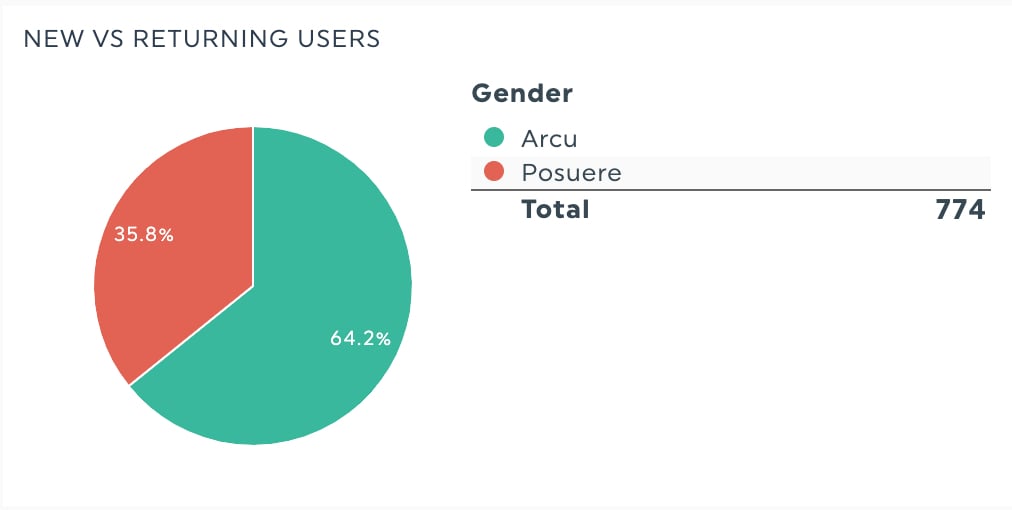
New versus returning visitors tracks the number of people visiting your site for the first time versus those ‘returning’ for another visit. This website metric tells you if you are attracting enough first-time visitors or getting enough visitors to come back to your site for a second look.
Take note of how Google defines each visit type according to its tracking code. There are scenarios where Google classifies a returning visitor as a new visitor.
Some examples:
- If someone browses your website in incognito mode
- If someone browses your website using one device (like a desktop) and goes on your website on their phone (counted as two new visitors)
- If someone visits your site, clears their cookies and browser caches, and revisits your site.
- If someone returns to your website after two years
4. Bounce rate
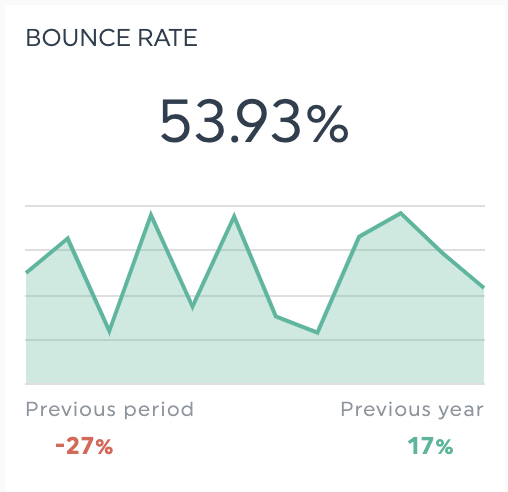
Bounce rate measures the percentage of people who leave a website without action.
Examples of actions could be:
- clicking on a link to go to another page,
- filling in a contact form and clicking on a CTA
Reducing your bounce rate can improve conversion rates, especially on crucial pages like a checkout form or contact page.
Bounce rates may also influence your website’s position in search engines - a 2020 Backlinko study of 11.8 million Google search results found a strong correlation between bounce rate and time on page with search engine rankings.
A low bounce rate varies across websites but averages 41-55%.
If you’re seeing incredibly high bounce rates, review to see if there are issues with the page’s user experience, how your content is displayed, or the relevance of the content to the page’s topic.
5. Average session duration
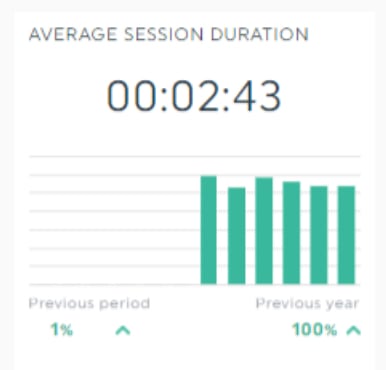
This engagement metric tells you how long users stay on your site for the duration of their entire visit. It differs from the time on page website metric, which measures the amount of time on an individual web page.
Like the page view or exit page metrics, a higher number isn’t always better here. Look at other metrics and think about your site's desired action or primary goal to better understand your next course of action.
6. Pageviews per Session
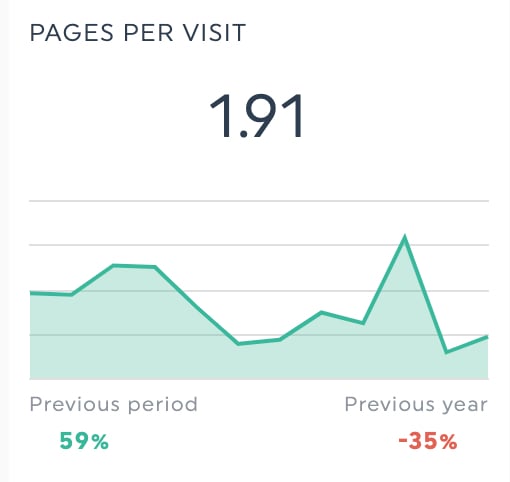
Pageviews per session define the number of pages a user loads on your site within their browsing section.
It’s a good indicator of how effective the content on your site keeps a viewer on the page.
Three factors affect this metric:
- The overall quality of content marketing and copywriting on your website
- How intuitive your internal linking and site structure is to navigate
- The user experience of your website
Context is critical here, as more page views aren’t always better.
For example, if you’re analyzing an e-commerce sales funnel, more page views could mean people take longer to check out. It’ll be in your interest to keep this number down for this purpose. However, if you’re looking at a blog, you’ll want visitors to read as many pieces of content as possible.
7. Top viewed pages
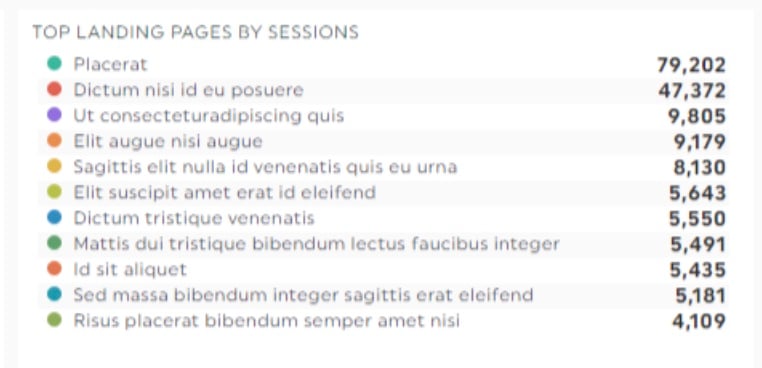
Top pages show you the pages driving the most traffic on your website.
Your top viewed pages are your homepage, about page, or contact us page for most websites. If you have a blog, this might show up here too.
Conversely, this report also tells you which individual pages you need to optimize.
If one of your key pages aren’t showing up here, consider reviewing its content usability factors like page speed or design to ensure it provides sufficient value to someone landing on that page.
8. Exit pages (and top exit pages)
Exit pages are the last page viewers see before dropping off.
You can design an exit page intentionally. For example, you’ll want your thank you page after completing a form submission to have a high exit rate.
However, if you see a conversion page like the checkout page of an e-commerce store or a landing page with a contact form on this list. If exit rates are high here, it’s a good idea to review if something isn’t performing to expectations.
9. Traffic sources
This report analyzes the traffic sources driving traffic to your website. These fall into four main categories.
- Direct: People reach your website by typing in your website URL into their browser
- Organic: People finding your website through a search engine, boosted by SEO efforts
- Referral: People find your site from links appearing on a different website
- Paid search: People finding your site through a paid search campaign
The traffic sources report helps measure the effectiveness of marketing efforts or identify top-performing channels. It’s also helpful to measure the effectiveness of your marketing strategy to boost traffic from a traffic source.
10. Device sources
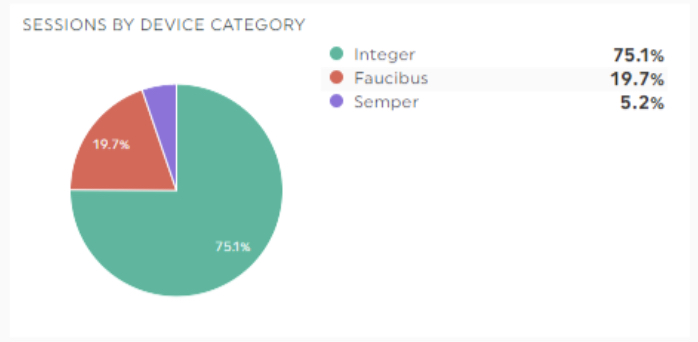
In 2021, 88.5% in Canada accessed the Internet through a mobile device, and it’s projected to grow.
Hence, designing your website to deliver a consistent device experience is essential. Use the device source report to see which devices your website visitors come from. Do people interact with your website through mobile devices? Scrutinize how your website is performing for these devices.
How do you measure website performance metrics?
With your metrics in place, it’s time to think about presenting your data in a crystal-clear manner that your boss or client will understand.
DashThis integrates with Google Analytics and 34+ other crucial digital marketing and e-commerce tools.
We bring all the data from your analytics tools into one report, allowing you to see how your website metrics perform and flawlessly explain what’s going on in your presentation. You can even customize your dashboards to your liking and automate data flow between tools, saving you valuable time spent on reporting.
Step 1: Connect your favorite marketing tools
Step 2: Select your metrics from DashThis’ preset widgets
Step 3: Drag and drop your desired metrics into your reports!
Get insights on how your website is performing
Carefully analyzing your website metrics means you no longer need to fumble in the dark when thinking about website performance.
With DashThis, quickly get all the critical information you need on your website without navigating through pages of information on web analytics tools.
Sign up for your free 15-day trial to automate your website performance metrics reporting in a visually-pleasing format. Track and present the website metrics that matter in a single report.

Ready to measure your website metrics?
Read More

Don’t miss out!
Follow us on social media to stay tuned!
Automate your reports!
Bring all your marketing data into one automated report.
Try dashthis for free