How to Track Landing Page Conversions & Other Important Metrics

The average landing page conversion rate is around 2.35% and the top 10% of sites see landing page conversions upwards of 11.45%.
Do your landing pages measure up?
Naturally, the ultimate goal is to increase landing page conversions. The only way to do that is to monitor results with Google Analytics and look for areas of improvement. And there’s more to it than conversions alone.
Just as a Pokemon’s power is made up of several stats: attack, defense, stamina… Other key metrics have an impact on conversions. For instance, a high bounce rate means that you’re losing customers before they act on your offer.
In other words, something’s going wrong somewhere.
To resolve problem areas you need to understand key seo and ppc metrics and why they’re important. As well as how to track them and use this information to optimize your landing pages.
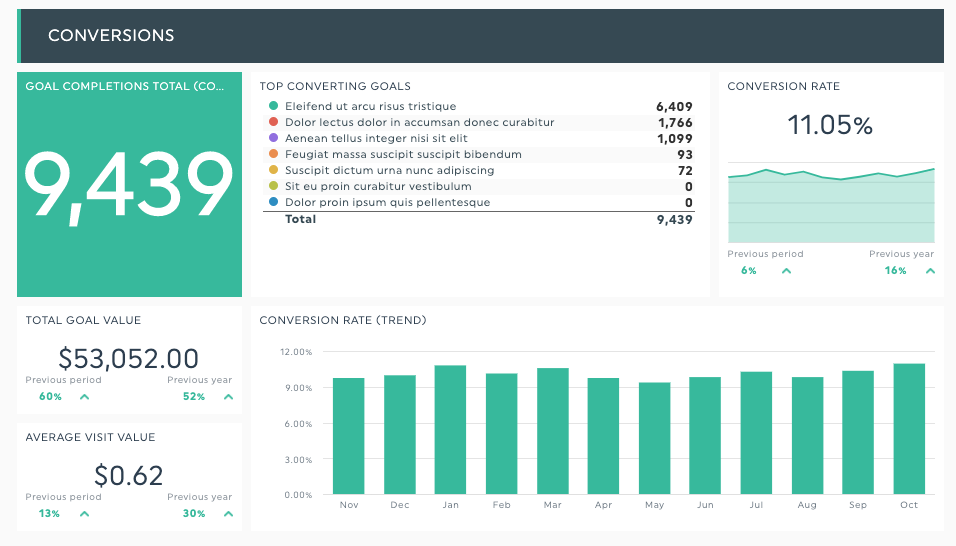
1. Conversions
The sole purpose of a landing page is to convert visitors. By tracking conversions you can measure how effectively your landing pages are doing their job.
This is important because only 22% of businesses are satisfied with their conversion rates.
If you fall into the unsatisfied category you need to put a strategy in place where you track performance and work on boosting conversions.
To get started, set up Goals and/or ecommerce tracking in Google Analytics. Now, what counts as a conversion differs from company to company. For instance, a SaaS company may want to track free trial signups or form submissions, while an ecommerce company may want to track the number of transactions.
So, don’t just set up arbitrary goals you think you should have. Choose those that will be most profitable for your business, whether that’s in the long or short-term.
Go to Admin > Goals.
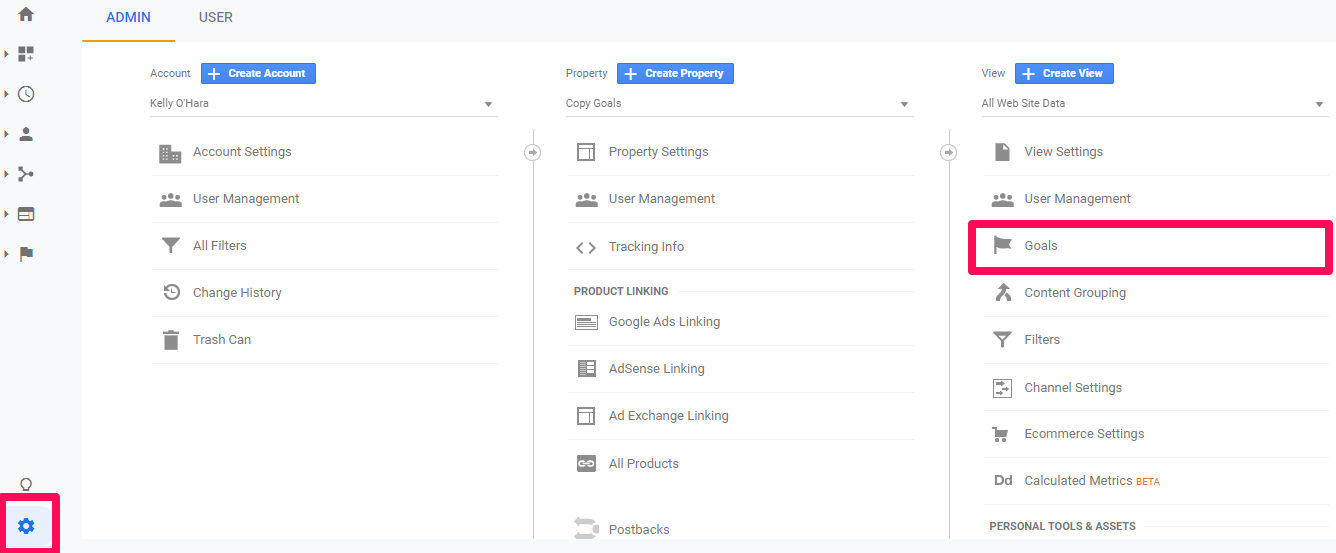
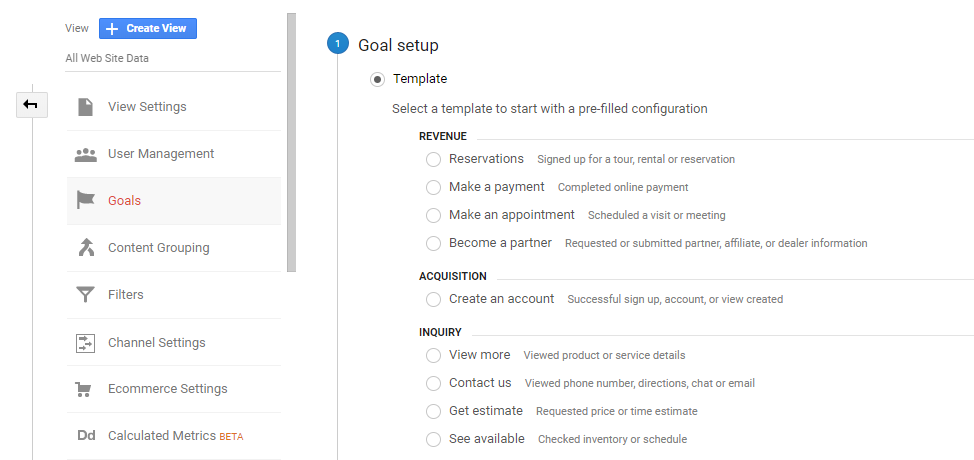
Click on “New Goal” and you will be taken to a selection of ready-made templates for various revenue, acquisition and inquiry-based goals.
Or you can set up a custom goal from scratch.
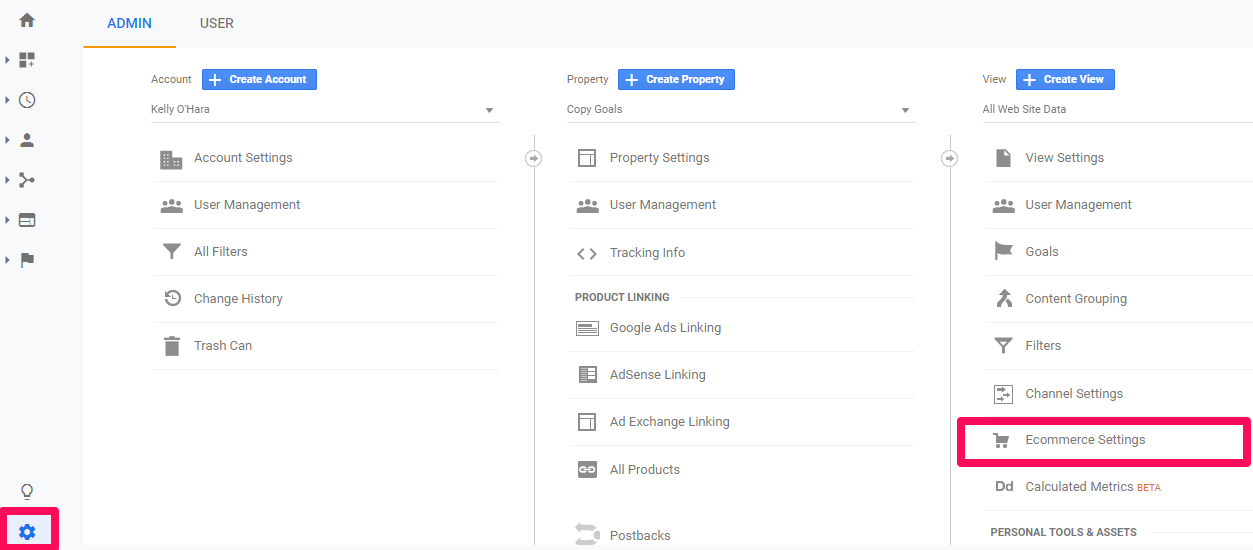
If you have an ecommerce store, you should enable ecommerce tracking to see metrics such as revenue, average order value and sessions to transaction within Analytics.
Go to Admin > Ecommerce Settings.
Under “Enable Ecommerce” click the switch and hit save.
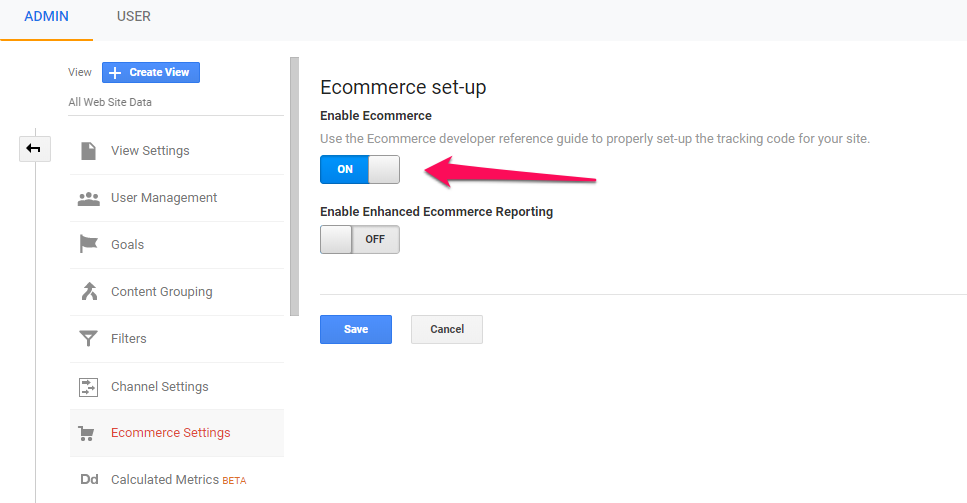
Note that there may be further steps if you use third-party apps or software on your ecommerce site.
Once you have Goals and/or ecommerce tracking set up you can monitor landing page conversions.
Head to Behavior > Site Content > Landing Pages.
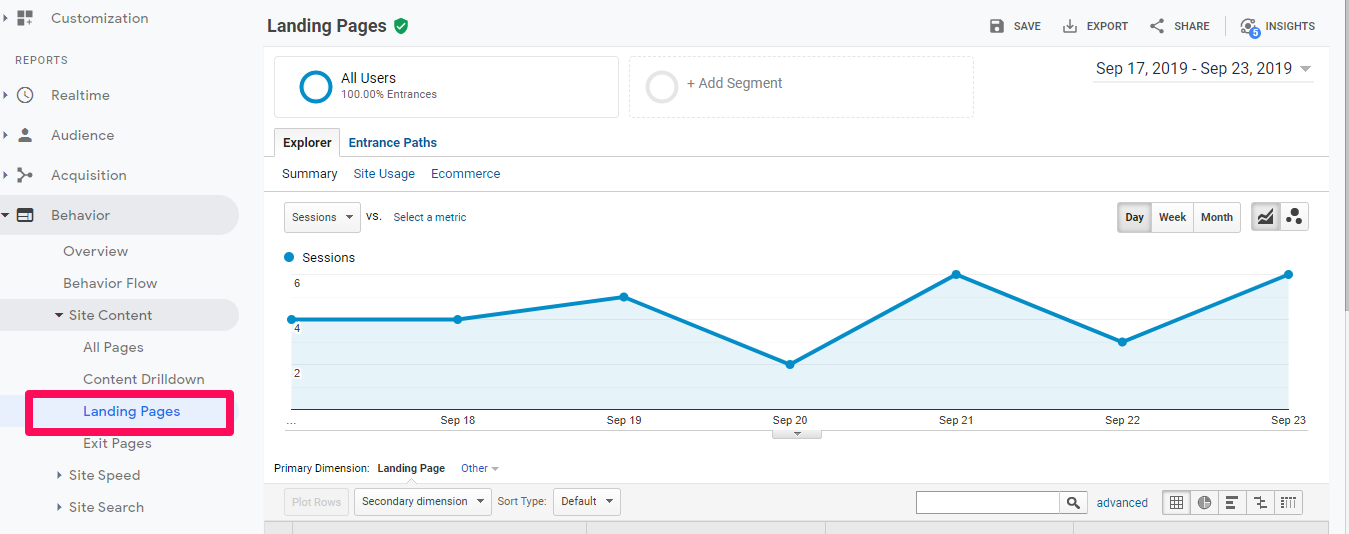
In the Conversions column choose either Ecommerce or your desired goal from the drop-down menu.

From here, you can put your landing pages in order of most or least goal conversions, and thereby figure out what’s working best for you, so that you can do more of it.
You can also discover which pages are most in need of optimization, because the first step towards increasing conversions is to determine what kind of work needs to be done and where.
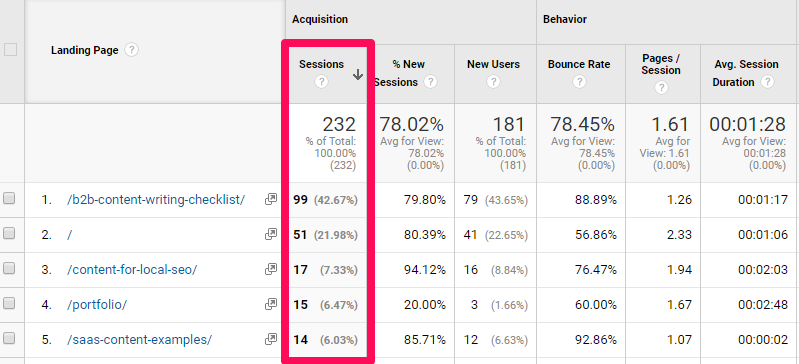
2. Sessions / New Sessions
Seeing as the number of sessions shows how many visitors are actually landing on your landing pages, it’s a strong indicator as to whether your marketing and advertising efforts are working.
Because this data is so useful, Sessions and number of visitors is one of the most tracked metric in Google Analytics.
You can see which are your most and least visited landing pages.
If a particular landing page has a low number of sessions then you might need to, for example, enhance your advertising copy to entice more people to click.
This company does a great job of making people want to find out more:

They use a bunch of value propositions - their veggies are fresh, organic, seasonal, etc.
So, Sessions data shows you where you need to take steps like this to increase the number of visitors to your landing pages.
Find Sessions in the Acquisition column of your Landing Pages section.
It’s also vital that you look at the percentage of New Sessions at this point.
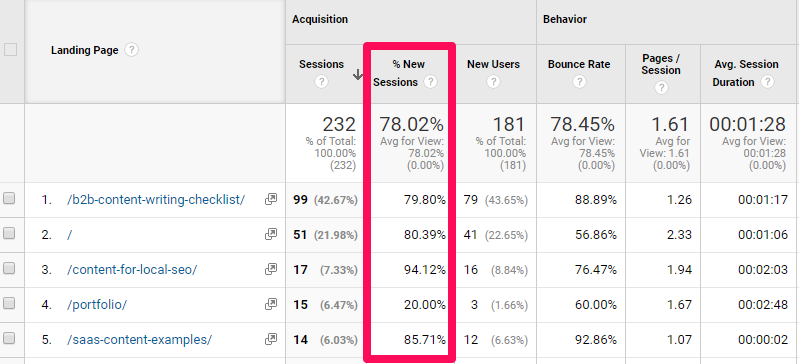
This shows the rate at which you’re acquiring new leads.
And whether users are returning to your landing page for a second look.
If you have a high percentage of returning visitors, it’s not necessarily a bad thing…
But it may indicate that something is preventing visitors from converting the first time around.
In this case, you may wish to delve deeper into user behavior in order to increase conversions.
Heatmapping, scrollmapping and recording software shows how users interact with your landing pages.
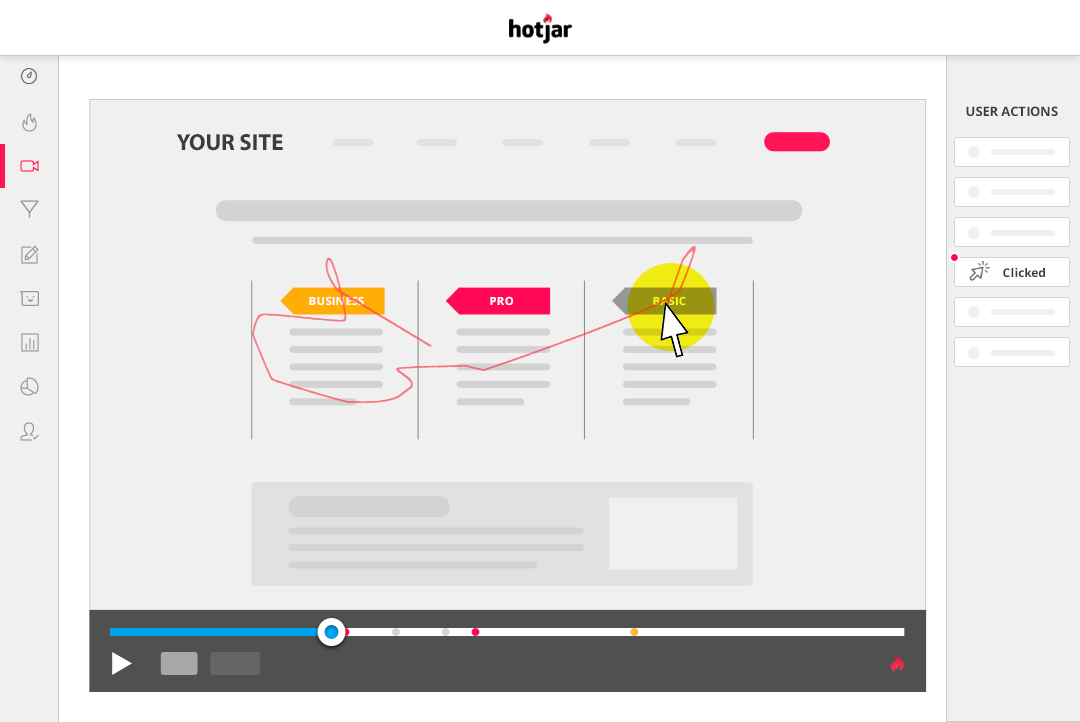
You can use the results to establish what exactly is stopping visitors from taking the next step.
There may be a usability issue perhaps.
Or visitors might not see your below-the-fold call to action as they tend to only scroll a short distance down the page.
As you can see, the information you glean from Sessions / New Sessions shows where you need to take steps on and off-page to optimize for conversions.
3. Source
Monitoring traffic sources will help you make key business decisions.
Author and three-time startup founder Etienne Garbugli at Highlights says,
“Only a few channels will scale and drive consistent traffic to your landing pages. What works today might not work tomorrow, so you’ll consistently want to test new channels.”
How do you test new channels? You try them out, monitor their results and decide whether they deliver a strong enough ROI.
Within Analytics, you can see which sources bring the most visitors and conversions. Which might be affiliates, email marketing, social media, paid ads, organic traffic, and so on…
By figuring out where you’re getting the most quality traffic from, you can decide where your time and budget are best spent. For example, you may discover that despite throwing everything you have at paid ads, you still have more organic reach.
Therefore, you might wish to focus on organic traffic for your next campaign. It doesn’t mean you should ignore other sources completely, however.
You need a diversified range of traffic sources. Because if something goes wrong with one source e.g. an algorithm change, you know you can rely on traffic from other sources.
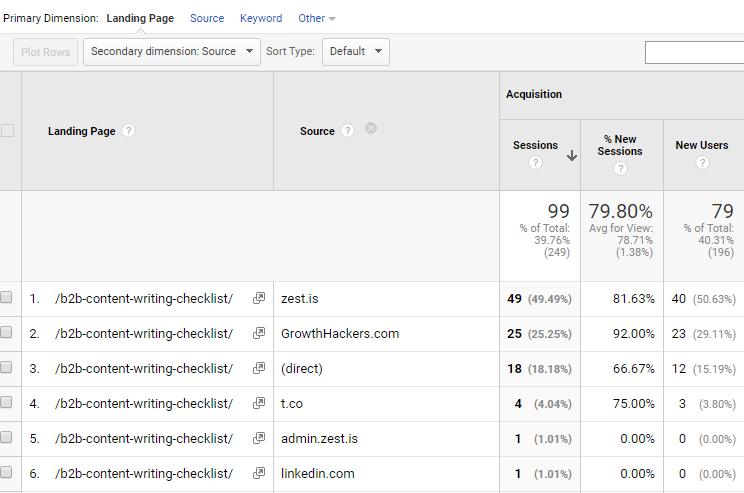
To see where your traffic is coming from, add Source as a secondary dimension within the Landing Pages section (Secondary Dimension > Acquisition > Source).
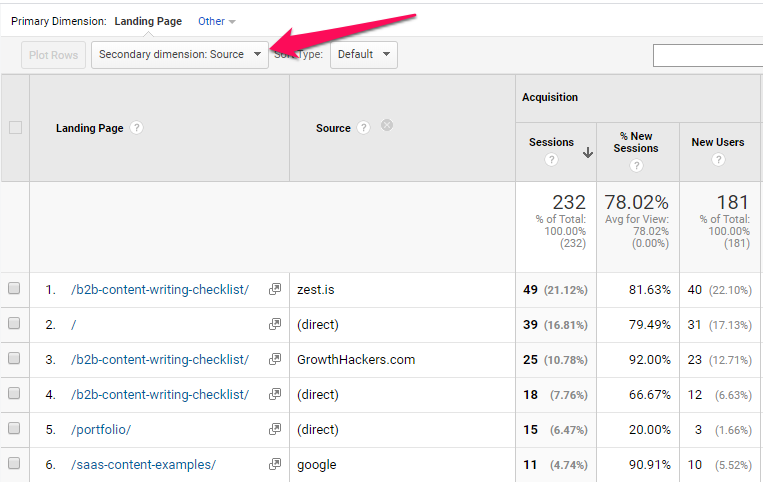
You can also click on a specific landing page then add Source as a secondary dimension to get a complete breakdown for that page.
When analyzing sources of traffic, you need to examine how it relates to other metrics. For instance, you may get a lot of traffic from Facebook. But that traffic has a high bounce rate and doesn’t ultimately result in conversions.
You may get less traffic from email but that traffic is targeted and converts better. High numbers are not the be-all and end-all, you must make sure those numbers are converting, too.
It’s about finding which sources help you achieve your business goals after all.
4. Session Duration
Session duration indicates how engaging your landing page is.
A reasonable benchmark for average session duration is around 2-3 minutes. Ideally, that’s what you should be aiming for, especially if your landing page contains lots of content, as opposed to say, product or category pages.
A low session duration likely means that visitors have left your page without converting. It proves that elements of your page such as copy or your hero image are not luring people in.
Perhaps they are leaving before they even get to your call to action. You need to make improvements to the visual appeal and information included on a landing page.
For instance, a longer landing page with more valuable information may increase session duration.
This landing page from eco-friendly water bottle company, Chilly’s is super engaging:
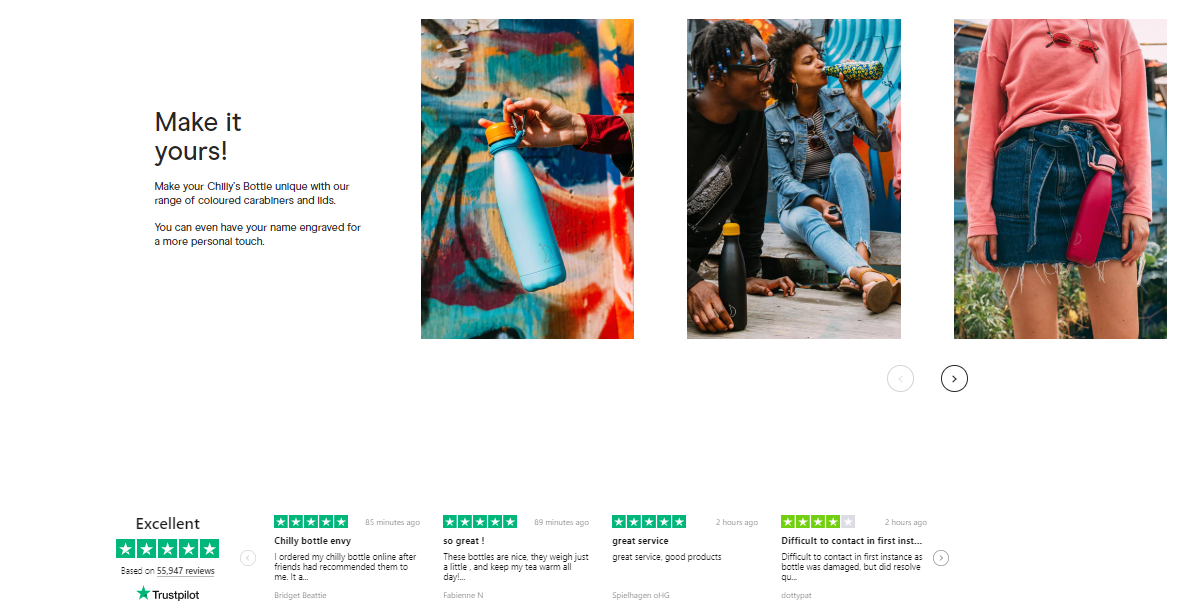
It contains high-quality images, social proof and tons of information that outlines their key value propositions.
Basically, all of the elements of an effective landing page that makes you want to keep scrolling and keep reading.
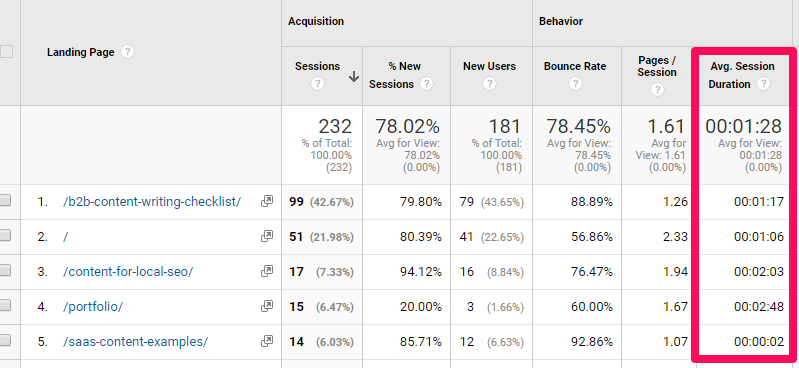
You can find the Avg. Session Duration column in the Landing Pages section.
However, it must be noted that Google Analytics only measures session duration if the user visits another page on your site.
It shows a figure of 0.00 if they bounce after only viewing your landing page.
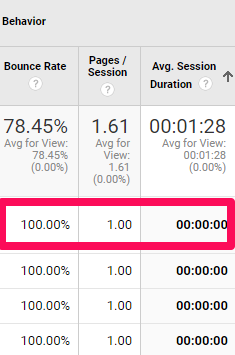
Here, you can’t tell exactly how long the user spent on your landing page before bouncing.
If you wish to get an idea of whether the user is reading or interacting with your page in this case, then you have the option of setting up event tracking.
You can track whether a visitor clicked play on a video or scrolled down the page, for example. So, there’s still an opportunity to see how visitors engage with your page even if you’re unable to measure session duration.
But, all in all, if you can track session duration, you should.
It provides insight as to whether you need to make your landing page more engaging.
5. Bounce Rate
Bounce rate is an excellent measure of how well your landing pages are performing.
Landing pages are supposed to encourage visitors to take action. And bounce rate tells you whether they clicked through to other pages on your site, signed up to your webinar, made a purchase etc...
Or, like a bad Tinder date, if they bounced without doing anything.
One thing you need to remember is that bounce rates vary significantly depending on industry and the type of page. A high bounce rate is okay for a content-heavy page or blog post as visitors get all of the information they need on just one page.
They don’t need to visit other pages on your site. But a healthy landing page bounce rate should be lower because you want visitors to pass through to other pages (convert).
There could be several reasons for a high landing page bounce rate. For instance, your content or offer might not be compelling enough for visitors to take the next step.
Or perhaps your off-page promotions don’t match up with your landing page offer. Visitors don’t find what they were expecting so they just bounce.
Thus, you need to keep an eye on your landing page bounce rate.
Find Bounce Rate in the Behavior column of the Landing Pages section:
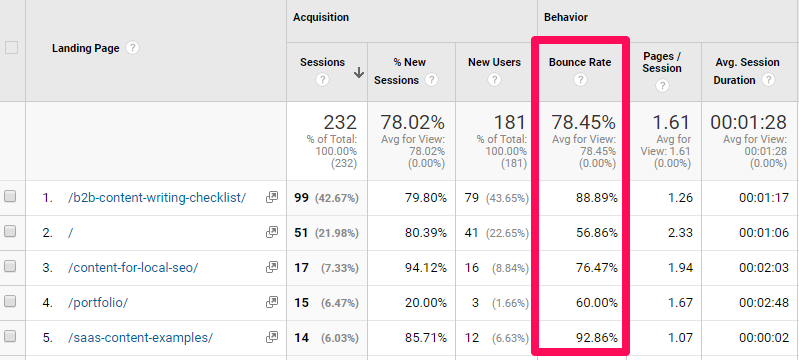
Organize your landing pages according to bounce rate and you’ll see which of your landing pages are performing well, and which needs more work in terms of getting people to act.
Conversion rate optimization techniques could help you lower your bounce rate. You might want to try a limited time offer, for example.
Here, Protein World has a payday offer:

On the last Friday of the month, they offer a 45% discount just for one day.
You could do something similar to encourage visitors to take the next step and start shopping.
The trick is to look at your bounce rates, consider why visitors are bouncing and do everything in your power to change their minds.
Final Word
Data is incredibly useful for any site. It’s vital you track conversions to make sure your landing pages are working effectively.
Analyze further metrics to get a deeper insight into where you can optimize landing pages and thereby boost conversions.
Key analytics can show you so much from whether your off-page promotional strategies are bringing the right visitors to your pages, to whether your landing pages are compelling enough to get visitors to act.
Don’t simply monitor landing page metrics, use them wisely to implement effective changes.
The first step is setting up your Analytics goals or ecommerce tracking.
Want To Track Your Landing Page Performance Easily?
Track all your Google Analytics Landing page metrics by simply connecting your Google Analytics account to DashThis and you'll get an automated landing page report in seconds.
Track all your landing page data in one easy-to-use report.

Ready to automate your reporting?
Read More
Don’t miss out!
Follow us on social media to stay tuned!
Automate your reports!
Bring all your marketing data into one automated report.
Try dashthis for free