The Top Google Analytics KPIs & Metrics You Should Track

Are you wondering which Google Analytics KPIs you should track so that you can achieve your business goals like a pro?
Great news, you're in the right place.
- What are Google Analytics KPIs
- How to Track These KPIs
- Top KPIs to Track
- - Audience KPIs
- - Acquisition KPIs
- - Behavior KPIs
- - Conversion KPIs
- Automate it
- Create your Google Analytics report with DashThis today!
What are Google Analytics KPIs
Google Analytics key performance indicators (KPIs) offer crucial insights into your website’s performance.
These key metrics function as a compass for your digital marketing strategy—they tell you how close or far off you are in meeting your business objectives.
Note this Google Analytics report that breaks down the website’s traffic overview in eye-catching graphs and charts.
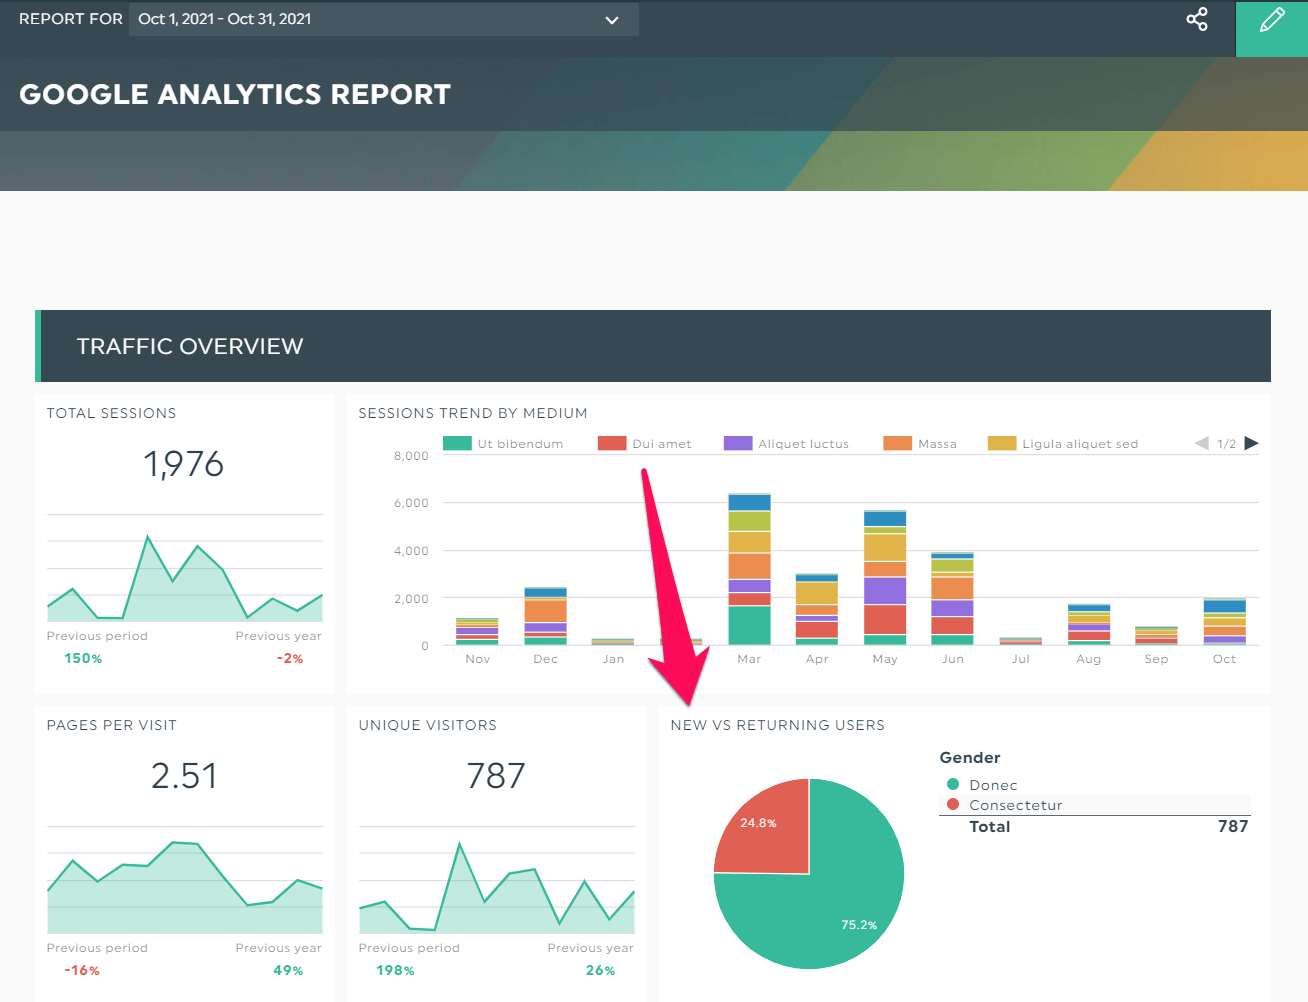
Grab this template with your own data!
Take New vs Returning Users, for instance.
This digital marketing KPI shows how many of your visitors are actually returning to your website.
In other words, this Google Analytics KPI dashboard that you see above is critical in an SEO strategy. It helps you to see if readers are enjoying your content!
How to Track These KPIs
Do you often have trouble making sense of the messy data in Google Analytics (GA)?
You’re not alone.
Based on a survey by Demand Gen Report, 51% of B2B marketers struggle with connecting and analyzing data across multiple platforms.
Given that GA is part and parcel of every marketer’s job, we wouldn’t be surprised if it’s one of the aforementioned platforms.
A better alternative to untangling these messy data is using Google Analytics dashboards.
Here’s how it works.
First, connect your favorite marketing tools with DashThis and select a premade template.
Next, complete the following steps:
- Click Preset Widgets
- Select your KPIs (all widgets are set up based on the most commonly used KPIs)
- Drag and drop the KPIs as you desire
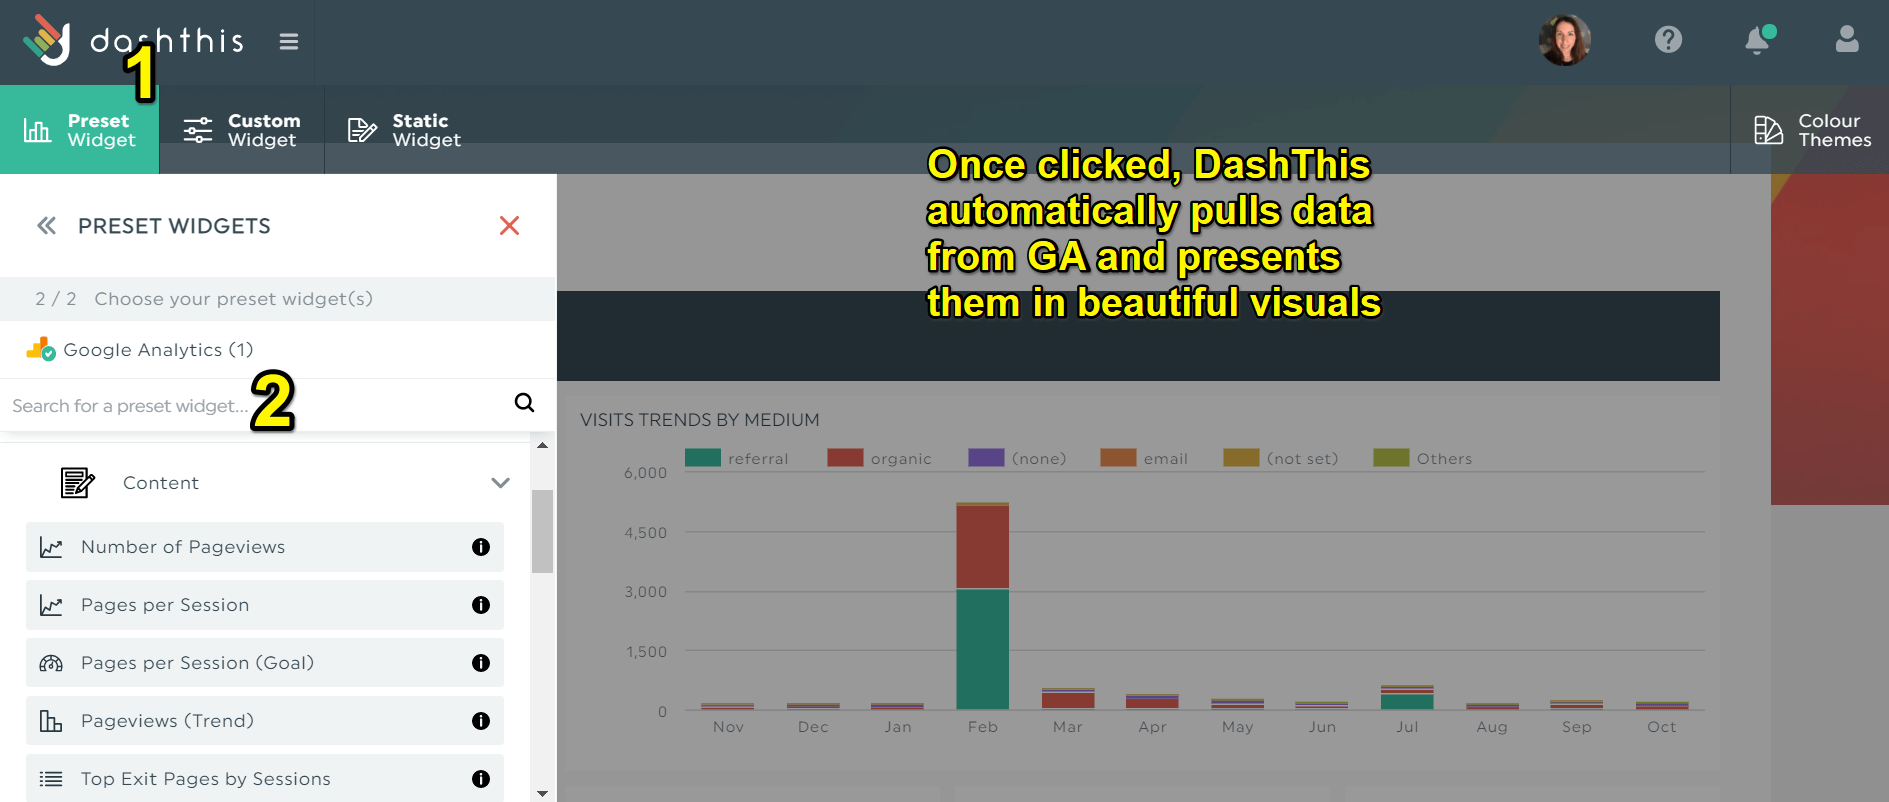
Everything happens within seconds.
After you click a KPI, DashThis automatically pulls data from your Google Analytics account and transforms it into a beautiful visual.
There are no coding or design skills required. Plus, you don’t need to take screenshots or copy and paste the data across multiple tabs. #lifechanging
DashThis focuses on the right metrics and simplifies the reporting process.
Start your 15-day FREE trial on DashThis to automate your Google Analytics reporting today.
Top KPIs to Track
Not all Google Analytics KPIs are worth the same amount of gold.
Nonetheless, there are several important KPIs that all businesses should track to improve their website performance.
Audience KPIs
The Audience report informs you about the type of users visiting your website.
You can segment them based on attributes relevant to your business and optimize your marketing campaigns to target them accordingly.
(i) Number of Visitors
This is the number of folks who visit your website. Note that this KPI covers both new and returning visitors. The more views and repeat visits, the better.
(ii) Pageviews
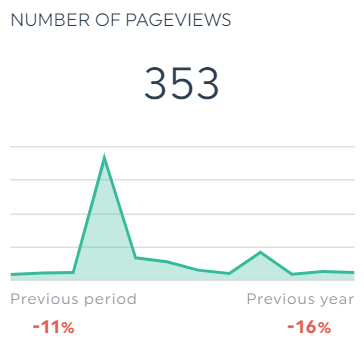
Track your pageviews with your own data!
Pageviews is the total number of pages viewed. Note that this also includes multiple views of a single page.
(iii) Session Duration
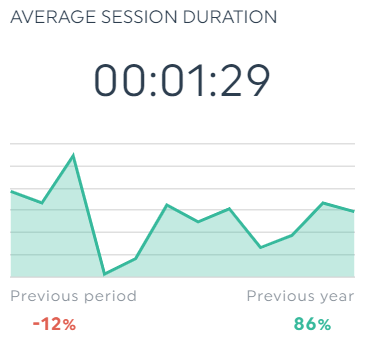
Track your average session duration with your own data!
This Google Analytics KPI measures the average length of sessions on a website.
(iv) Bounce Rate
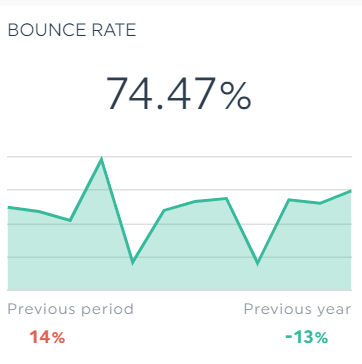
Track your bounce rate with your own data!
The bounce rate KPI tells you the percentage of visitors who leave your website.
It’s normal to see high bounce rates on single-page websites (e.g., landing pages), so don’t be alarmed if you spot this on Google Analytics.
However, if you’re seeing high bounce rates on multiple-page sites (i.e., users leaving the homepage without visiting other pages), watch out.
This signals there’s a problem lurking in the corner.
For example, a high bounce rate from users via PPC ads could mean a disconnected experience between the ads and your site content.
All in all, it’s all about context.
(v) Ratio of New vs Returning Visitors
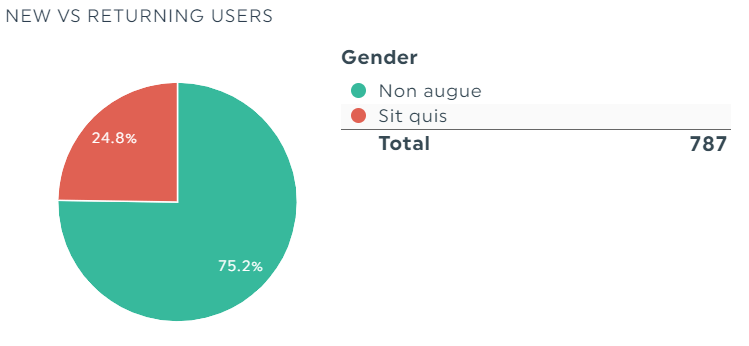
Track New vs Returning Users with your own data!
New users are folks who’ve never been to your website, whereas returning users are folks who’ve visited your site.
Be careful if you're seeing a lot of new visitors but low returning visitors. It's likely because your content isn’t resonating with them.
Acquisition KPIs
The Acquisition report shows you how users find your site (a.k.a. the source of your website traffic).
(i) Top Channels
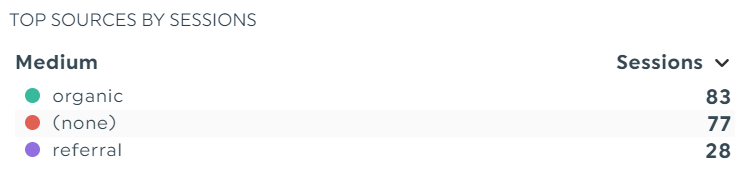
Track your top sources by sessions with your own data!
The Top Channels KPI helps you identify your best-performing marketing channels.
If you want to do more of what works in your marketing efforts, this is the section to focus on.
Popular channels include:
- Organic search
- Direct (users who click your site from their bookmark or type the URL directly into their browser)
- Paid search (Google Ads, formerly known as AdWords)
- Referral (channels outside of search engine and social media)
- Social
To dig deeper into where your users are coming from, analyze the Source/Medium report.
Behavior KPIs
The Behavior report displays information about how visitors are interacting with your content.
Out of all reports in Google Analytics, this is the most important if you want to understand and improve the user experience.
(i) Top Pages
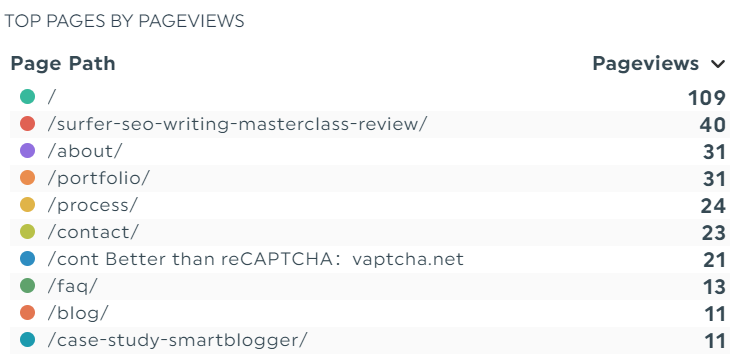
Track your top pages with your own data!
This shows your website’s most viewed pages; it helps you identify the specific pages worth optimizing in a marketing campaign.
(ii) Average Time on Page
This is the average amount of time users spend on a particular web page during a session.
(iii) Average Page Speed
This Google Analytics KPI measures how long it takes for your page to load. Keep a close eye on your site speed.
Slow websites are the culprits behind high bounce rates and dropped rankings on the SERPs.
Conversions KPIs
The Conversions report indicates how successful you are in getting users to complete an action.
This is a “money metric” that plays a vital role in your lead generation and sales.
(i) Conversion Rate
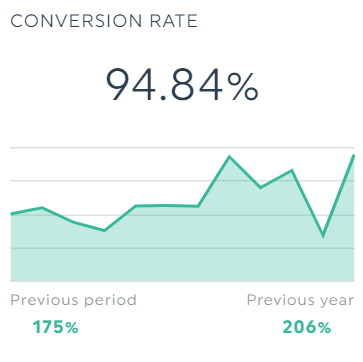
Track your conversion rate with your own data!
Your conversion rate reveals the percentage of users who took action on your website (e.g., submit a contact-form on landing pages, buy a product from an e-commerce site).
To calculate goal conversion rate: (Number of goal conversions / Number of sessions) x 100
At this stage, you'll also want to use event tracking to analyze how users are interacting with your site (e.g., number of clicks on a call-to-action button).
(ii) Cost per Acquisition (CPA)
CPA tracks how much money is spent to acquire a customer.
Another similar KPI, cost per conversion, measures the cost of a user’s action (e.g., download lead magnet, click a link).
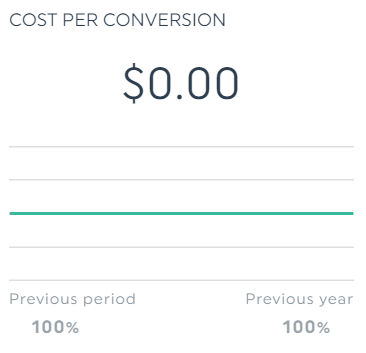
Track your cost-per-conversion with your own data!
(iii) Average Order Value (AOV)
This is the average total of every order a customer spends in an online store.
(iv) Cart Abandonment Rate
This is the percentage of customers who added products to their cart but left the checkout page without purchasing.
Reasons for cart abandonment include a lack of trust, expensive shipping costs, and a confusing checkout process.
(v) Revenue on Advertising Spend (ROAS)
This Google Analytics KPI indicates the amount of revenue earned for every dollar spent on advertising.
Automate it
Now that you know which KPIs to track, you can do it in seconds with an automated Google Analytics dashboard.
Either create a standalone GA web analytics report or showcase all your digital performance in a single report. Here’s how it looks when you combine GA with a social media platform like LinkedIn.
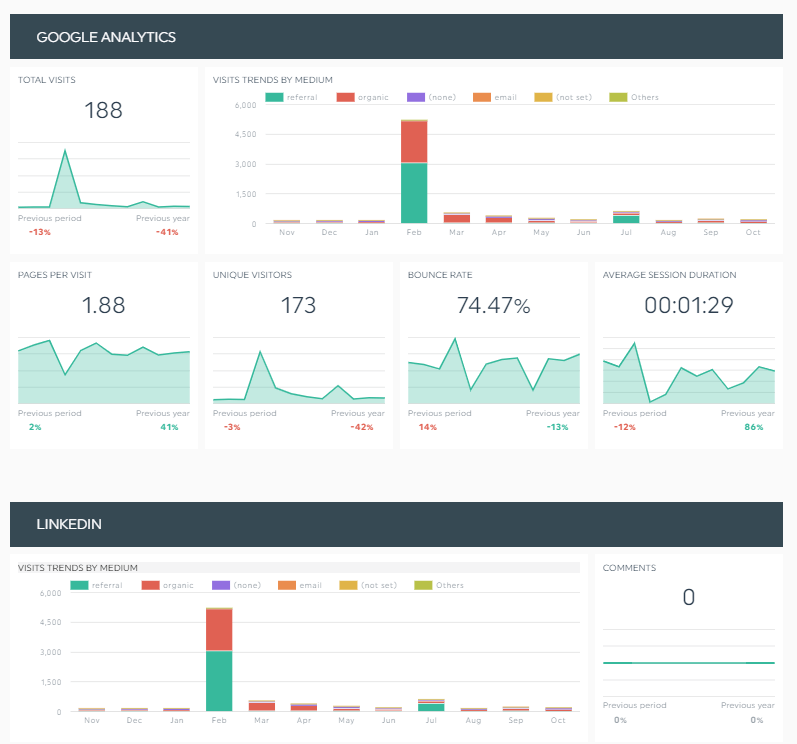
PPC, SEO, or social media, you can pull all data from these multiple platforms in one beautiful dashboard.
Sign up for your FREE 15-day trial today.
Create your Google Analytics report with DashThis today!
Not all Google Analytics KPIs are worth the same amount of gold, but these are the important ones that all businesses should track today.
Need a hand to make sense of your messy data? DashThis can help.
Connect your marketing channels with DashThis and let it automatically grab data from the relevant sources. With our automated marketing reporting tool, long gone are the days where you had to copy and paste data across multiple tabs.
Start your 15-day FREE trial on DashThis to simplify your Google Analytics KPIs reporting today.
This article was refreshed in November 2021.
The original post was written by the staff members of State of Digital Publishing. State of Digital Publishing is a digital media publishing technology news & information publication and community for better audience engagement.
Want to track your Google Analytics KPIs, Adwords metrics, social media strategies and landing page performance all in the same report?
Gather all these KPIs in one automated marketing report.
Read More

Don’t miss out!
Follow us on social media to stay tuned!
Automate your reports!
Bring all your marketing data into one automated report.
Try dashthis for free