What is data interpretation? (5-step guide to successful data interpretation included)

By 2023, data literacy will become an explicit and necessary driver of business value. (Gartner)
What do these trends mean for you as a marketer? If looking at charts and Excel spreadsheet rows scare you, fret not.
We’re here to help you demystify and interpret data to turn it into valuable insights for your team for informed decision-making.
- What is the meaning of data interpretation?
- Different types of data interpretation methods
- Benefits of investing in data interpretation
- A 5-step guide to successful data interpretation
- Data interpretation examples (with templates!)
- How to create a data interpretation report with DashThis
What is the meaning of data interpretation?
The interpretation of data is reviewing and analyzing data to draw conclusions relevant to a business.
It’s more than copy-pasting data sets into Excel spreadsheets or fancy charts from Google Analytics into your slide deck. Data interpretation is connecting the patterns and recognizing trends in your data, turning these insights into actionable recommendations for a business.
What does data interpretation look like in digital marketing?
- Search engine optimization (SEO): Using keyword search volume data to organize your keyword strategy for maximum impact
- Paid media campaigns: Statistical analysis to analyze your performance based on keywords or channel trends and determine channels with the highest ROI.
- Customer segmentation: Categorizing customers by customer lifetime value to find your most valuable customers for an email campaign.
Data interpretations consist of a report, data visualizations, and recommendations based on data to help your audience digest your message.
Jordie van Rijn, an email marketing consultant at emailmonday, adds:
"Statistics show that email is very profitable, often quoting incredible ROI. But the value optimization may just be in the data. Email and marketing automation generate a lot of valuable first-party data, but often the standard reports in simple email marketing software don't allow you the depth to get real insights and do the drill down.
Some of the biggest are a connection to browsing and shop visit behavior, sales, product history, and preferences that are missing from the reports. But other cross sections can be just as insightful: think about new subscribers per subscription source, premium versus discount shoppers, and reporting on product margin. You'll have to bring together more data sources, but these are incredibly actionable insights."
2 different types of data interpretation methods
Quantitative data interpretation
Quantitative data are numbers and statistics that can be quantified and measured.
Think of analyzing numerical questionnaire results, where several values are compiled into tables and histograms and analyzed using statistical methods.
In marketing, this will be all your quantitative marketing metric data through analytics tools like Google Analytics and Adobe Analytics.
Qualitative data interpretation
While quantitative data is about hard numbers, qualitative data is about everything that isn’t a number. Think of text from a customer interview or analyze what your respondents say in a survey.
These data types are considered unstructured data. You’ll need to spend some time structuring qualitative data before you can analyze it for business insights.
3 benefits of investing in data interpretation
At this point, you might be wondering:
“But wait, I’m a marketer, not a data analyst! Why should I learn data analysis?”
Truth is, data is everywhere in marketing as well. For one, data-driven martech tools jumped 24% to 9,932 martech tools in 2022, up 24% from 2020.
Even M&C Saatchi is working with artificial intelligence and big data to quantify emotions as intangible as brand desire.
As marketers, data helps benchmark performance, set suitable goals, and measure progress towards these goals.
Here are 3 reasons why sharpening your skills in data interpretation is a must for the modern marketer today.
1. Data interpretation helps with problem-solving and making informed decisions
Having access to data isn’t the end.
It’s acting on that data.
You need to interpret the data, spot issues or business opportunities, solve problems and make solid recommendations backed by data.
Consider two marketing executives making a recommendation to their head of department.
Gut Feeling Executive: “OK, we should change the page layout in our blog because I used this in my previous company, and it worked better for us.
Data-Driven Executive: “We need to change the page layout because based on this quarter’s time on page and scroll rate data, people don’t see our content at the bottom, and we need to draw attention to it with a clear call-to-action.
See the difference? Using data effectively makes you more credible to your clients and superiors.
2. Data helps you predict trends and prepare accordingly
Investing in data-driven behaviors often improves business time to market, employee retention, and customer acquisition.
This isn’t restricted to heavyweight organizations that rely on AI, machine learning, and big data.
Let’s take a retail or e-commerce business, for example.
Reviewing your order numbers and average order value over the year (visualizing numerical data with a line graph or bar charts helps here!) helps you predict busy months for your business, helping you allocate sufficient manpower and inventory to take advantage of brisk business.
Reviewing average order values can help you optimize your pricing strategy and how your products are displayed on your website.
3. Data helps measure your ROI accurately
By measuring how each campaign performs over a specific time, you’ll know which initiatives to focus on and what to cut back on to reduce costs.
This applies across all digital marketing activities, including email marketing, paid media, social media marketing, and landing page optimization.
A 5-step guide to successful data interpretation
1. Consider what you want to learn
Before we get into the nitty-gritty of data analysis, focus your data collection process and analysis by asking yourself what you want to derive from the data.
Keep these data interpretation questions specific, considering relevant business KPIs.
Another method is asking yourself these 2 questions:
- Where are you now, and where do you want to be?
- What actions are necessary to get there?
Here’s what this might look like.
OK question: What can I do to generate more leads for my business?
A better question (more specific, with a clear timeline): Which channels should I focus on to generate more leads in the next quarter?
2. Collect your data
Ensure the data sources you pick from provide the correct data relevant to the questions you want to answer.
Spend time reviewing and cleaning your raw data before using the collected data for analysis. Check for missing values, inconsistencies, and duplicate data to ensure your data remains clean for analysis.
Tip: Automated reporting tools like DashThis can automatically import your latest data from Google Analytics, paid marketing tools, SEO software, and more. All you need to do is to choose your integrations, import your data and select the metrics you want to display in your metrics dashboard.
3. Analyze your findings
Tap on statistical methods and different types of analysis like regression analysis and compare your data to look for relevant conclusions. Look for trends, patterns, or correlations that help you answer the questions you posed. Take note of any outliers and look for reasons behind these outliers.
Feel free to tap on data visualization and predictive analytics tools to help you.
4. Answer the So-What question
You’ve got your data and your analysis. What’s next?
Think about how to answer the ‘so what’ question. What do these numerical values mean to the people viewing the report, and how does it help them achieve their business goals better?
Write a recommendation and next steps for every finding. Ideally, these recommendations should answer one of these questions:
- How is initiative X progressing? Any opportunities for further improvement?
- How should we prioritize our next steps?
- Should we start/stop something?
Tip: Make sure you personalize this to your audience. What a head of sales cares about differs greatly from the head of consulting or tech solutions.
Organize multiple recommendations by priority. Once you’ve defined your recommendations, you might want to define:
- Who is responsible for carrying out these recommendations?
- What’s the next step
- Is there a timeframe in mind?
5. Present your results in a way that helps communicate your points
Presenting your report as unformatted Excel spreadsheets with inconsistent formatting and never-ending lists of numbers is a sure-fire way to get the recommendations you worked so hard on ignored.
Instead, you’ll want to tie all your hard work together in a structured report. Gather all your data in one easily understandable report. Place key information on top, use sections to guide the reader, and always relate your recommendations to your data. Select tables and appropriate graphs to emphasize points where needed.
2 data interpretation examples (with templates!)
Digital marketing report template
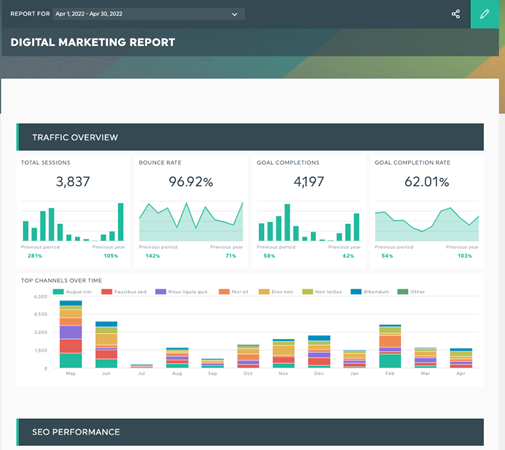
What’s in DashThis’s digital marketing report template:
- A clear overview of marketing performance by channel in one dashboard
- Data visualization tools like line charts, bar graphs, histograms, and pie charts help you interpret different types of data and present your data points with clear recommendations
- Section headers for each digital marketing line item, allowing executives to compare performance across channels to make more informed decisions
Executive report template
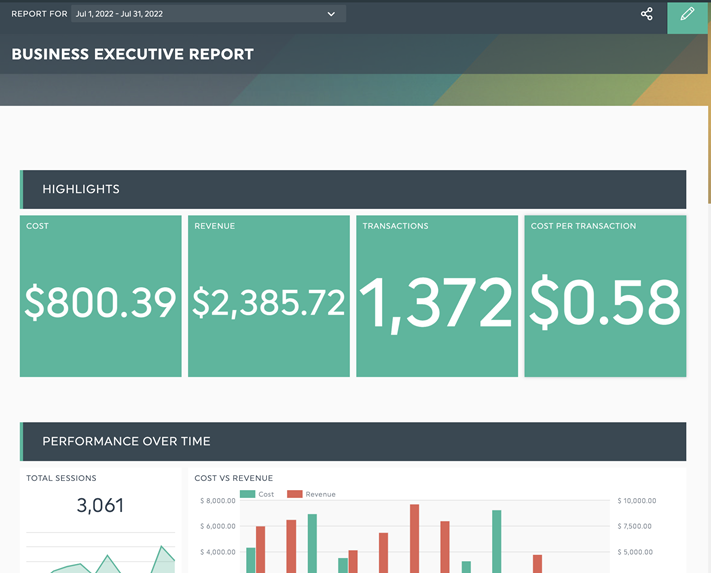
What’s in DashThis’s executive report template:
- A section calls out the month's key highlights, allowing you to show essential information upfront for your busy executive. Supplement this overview with notes and more contextual information for straightforward data interpretation
- Goal performance trackers for your executive team to see progress and help them make suitable decisions.
Tip: All our report templates are editable, so you can easily customize a report to your unique needs!
How to create a data interpretation report with DashThis
Step 1: Sign up for an account with DashThis. We have a fully-featured 15-day free trial to see if we’re right for you.
Step 2: Choose from over 40+ integrations and connect your marketing tools and data sources in seconds.
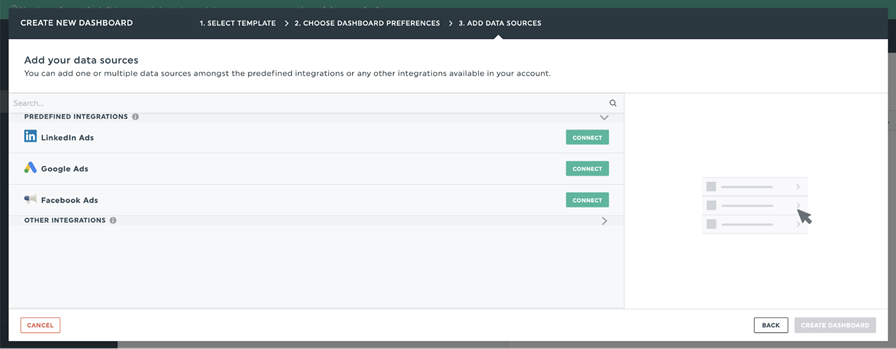
Step 3: Select the metrics to include in your report from DashThis’ preset widgets.
Step 4: Add as many data points as you need to set up your report.
Take advantage of DashThis' free 15-day trial today to save hours on data interpretation.

Start interpreting your data today
Read More

Don’t miss out!
Follow us on social media to stay tuned!
Automate your reports!
Bring all your marketing data into one automated report.
Try dashthis for free