Boost Your E-commerce Reporting with Google Analytics E-commerce Dashboards (3 Example Templates)

Websites. Google Shopping. Instagram Shopping. Online marketplaces.
Done well, omnichannel marketing for an e-commerce site does wonders for business.
Data from Omnisend shows that marketers who used three or more channels in a campaign saw a 494% higher order rate than those using a single-channel campaign.
Oof. That’s a lot!
But with so many possible marketing channels out there, marketers and e-commerce managers need to focus on a few specific marketing channels to make their efforts to grow their online store worthwhile.
It’s challenging to monitor how everything is performing when you’ve got so many things on your plate. We’ll show you how to make your client’s life easier with the right reporting tools.
- What is an eCommerce dashboard?
- - Why should you use Google Analytics to track your ecommerce metrics?
- Three things to include in a winning e-commerce Google Analytics report
- 3 top eCommerce dashboard templates with Google Analytics
- How to create an e-commerce dashboard with Google Analytics in minutes using DashThis
- Automate your e-commerce dashboard analytics with DashThis
What is an eCommerce dashboard?
An e-commerce dashboard makes the data analysis process easier by displaying all your e-commerce performance metrics in one place.
Get your ecommerce report with your own data!
Processing data from Google Analytics, digital marketing, product management tools and social media channels usually takes hours to create a report. With an e-commerce dashboard and custom reports, creating reports can be done in minutes, freeing up your time for analysis and recommendations.
Visualizing your data with a custom dashboard makes it easy to monitor progress and understand where your strategy is working for your client’s e-commerce store.
Why should you use Google Analytics to track your ecommerce metrics?
GA4’s performance dashboards and web analytics tools have a wealth of information to help optimize your client’s e-commerce business.
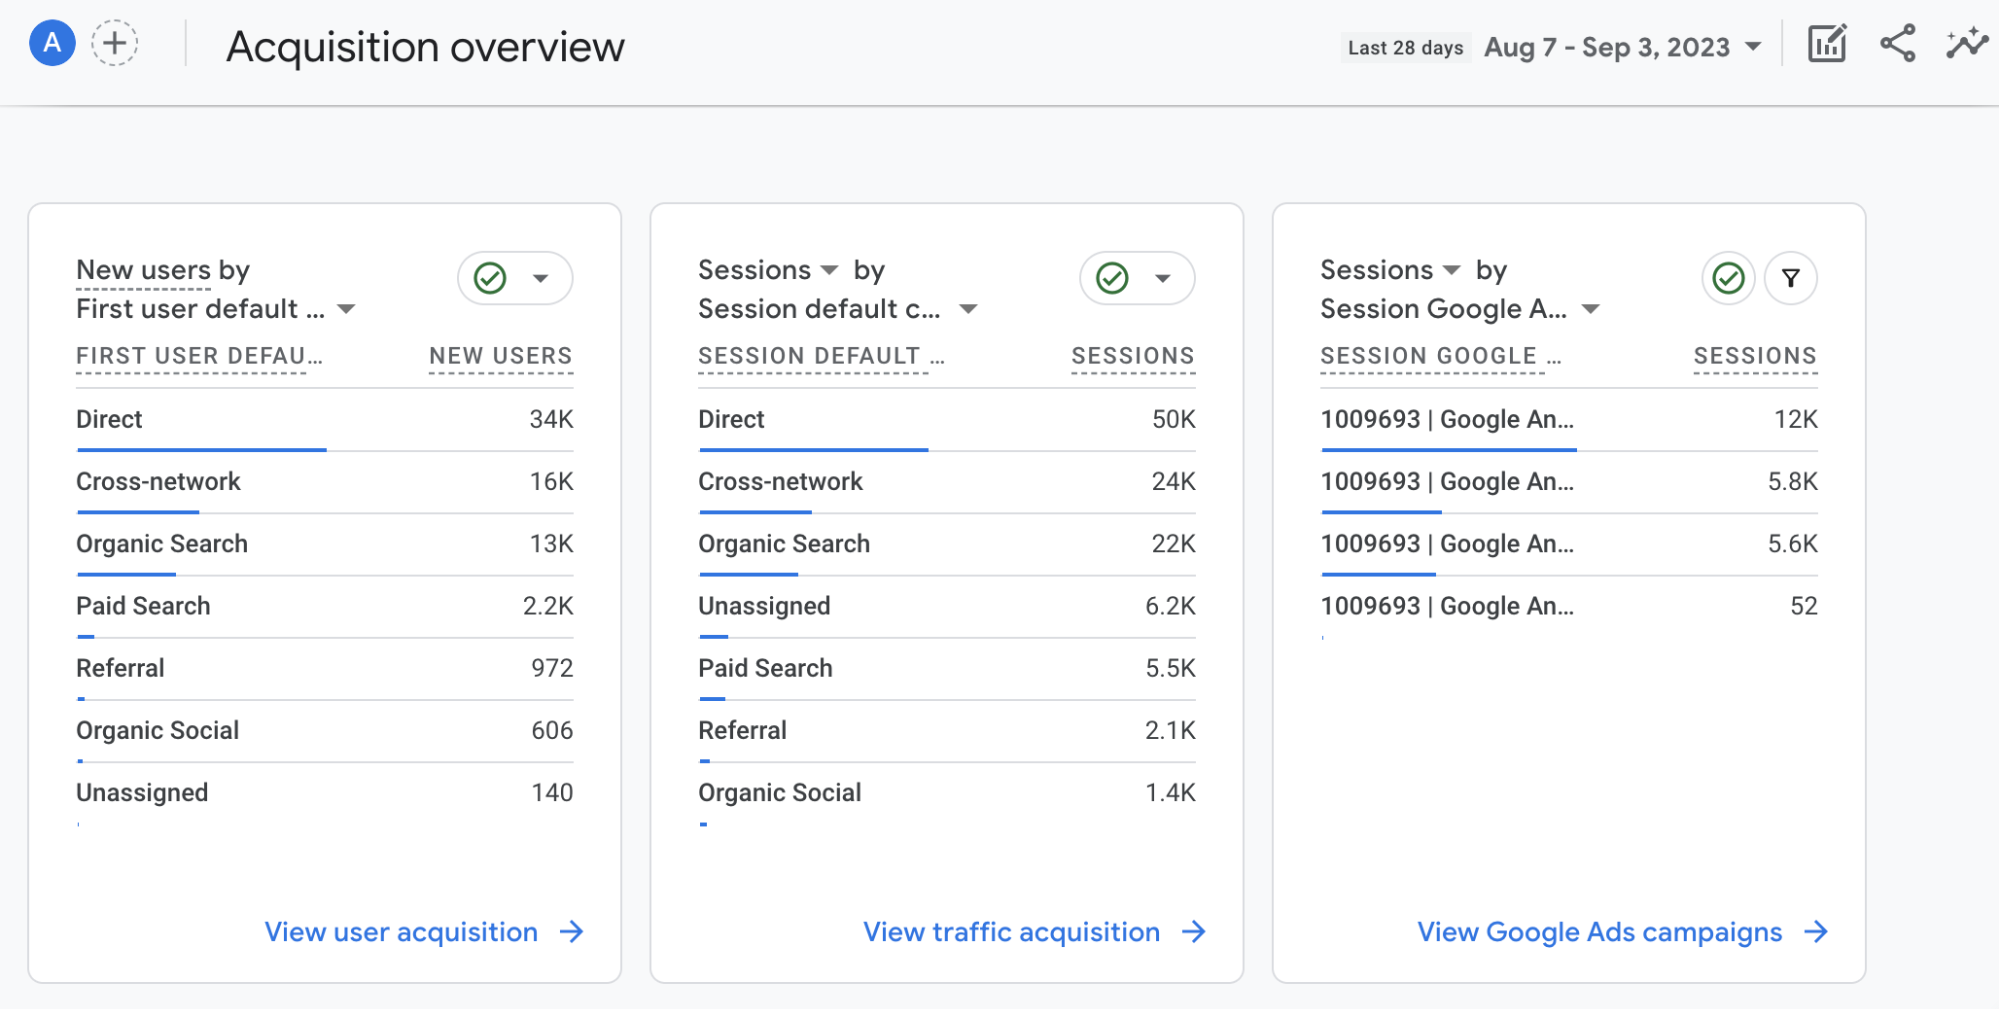
For example, acquisition reports in GA4 answer which countries your site visitors come from, their demographics, and which channels bring in the most website traffic. Perfect when working out which marketing channels to focus on.
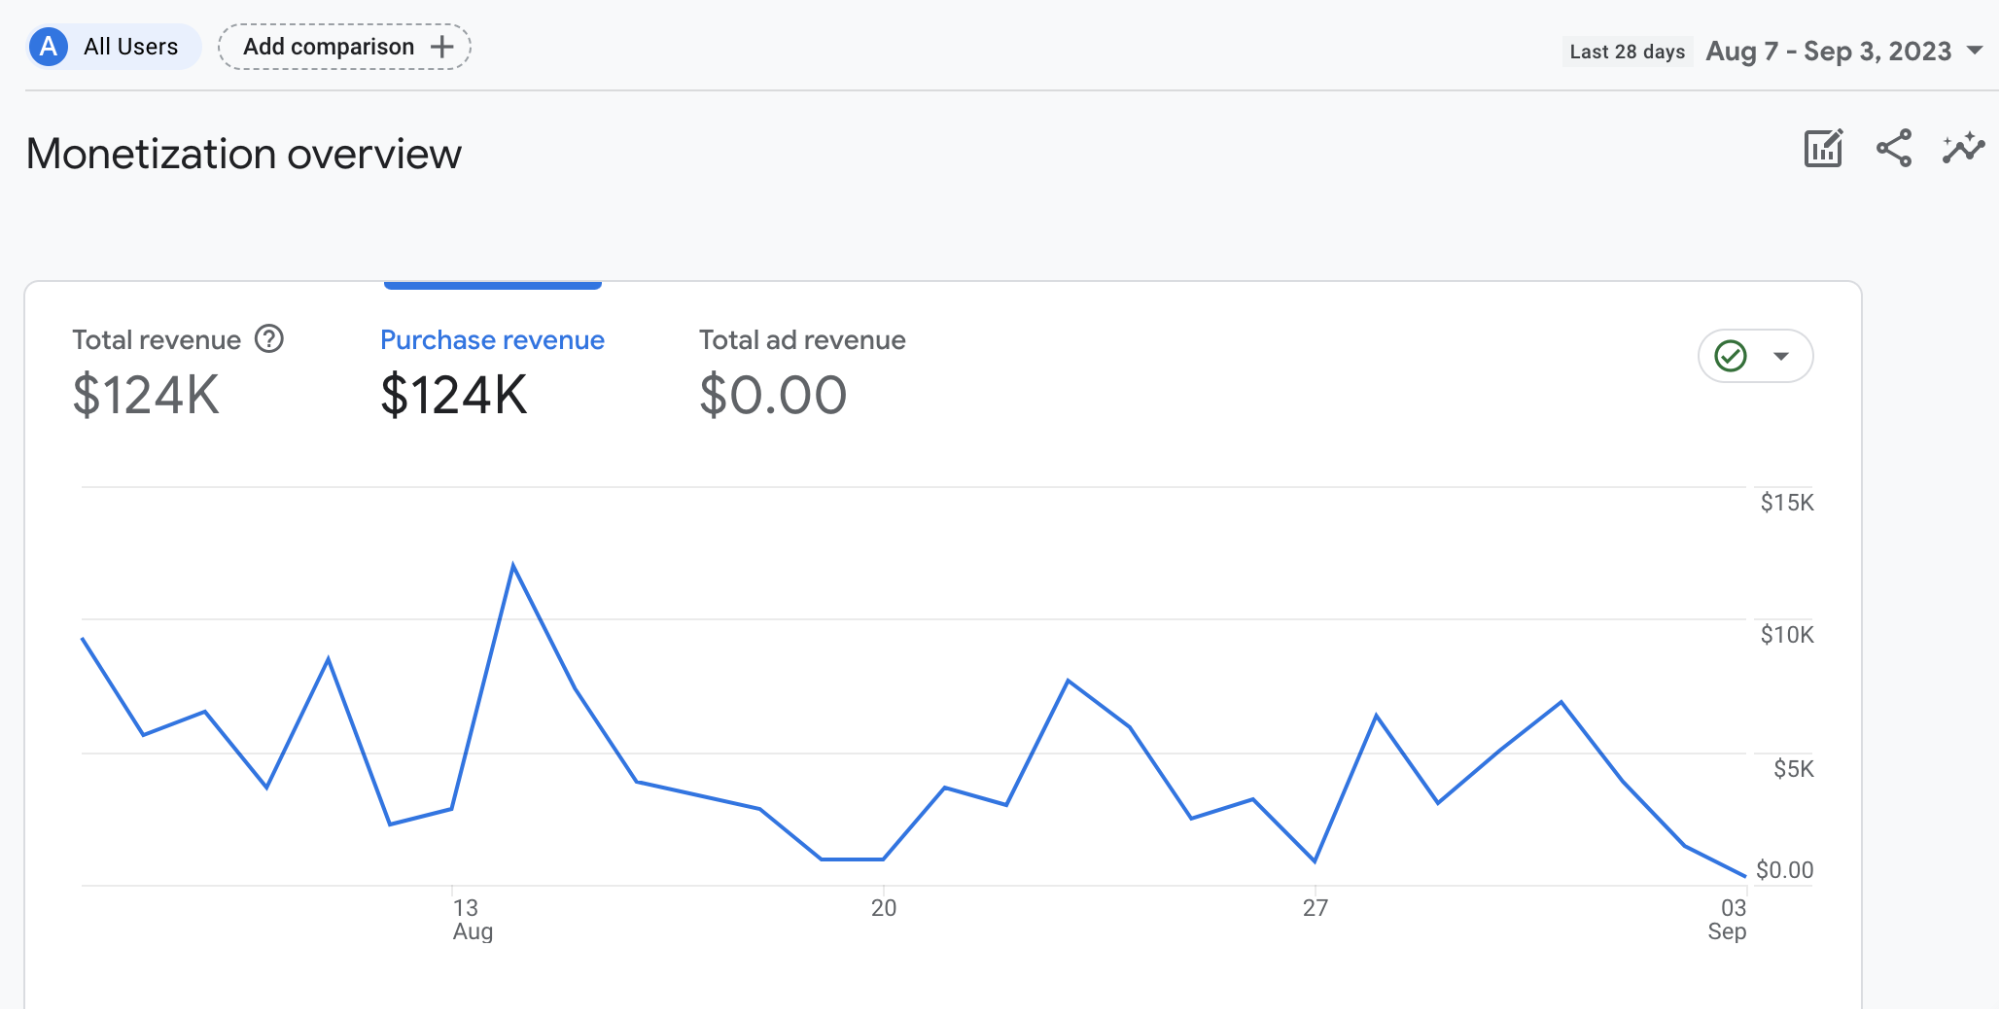
Besides acquisition, website loading times, design, and navigation also play a part in keeping people on your site and leading them to purchase. GA4’s engagement reports tell you which pages people view and spend time on, while monetization reports show your effort’s influence on total revenue against ad spend.
However, showing raw metrics isn’t enough to show your value to your client. It’s curating metrics, adding analysis, and structuring them into an easy-to-read report that turns you into a valuable partner for your e-commerce clients.
GA4 is excellent for traffic and behavior, but it relies on tracking that can miss or sample orders. For exact sales numbers, pair it with the native DashThis Shopify integration, which pulls revenue, orders, and customer data straight from your store. Together they give you the full funnel: GA for how people arrive and browse, Shopify for what they actually buy.
Three things to include in a winning e-commerce Google Analytics report
Quick note: Need some inspiration for KPIs? Use our database of over 100 KPI examples to use in your reports.
1. A clear goal and objective
Before choosing your KPIs and key metrics, you need to answer three questions:
- What’s the business goal you’re reporting for?
- Who are you presenting this information to?
- What do they care about?
2. Relevant KPIs and metrics
Analysts make sure every metric relates to a report's business goal.
In the words of analyst Avinash Kaushik,
“When you find yourself experiencing data overload, don an assassin's garb, identify the metrics, and kill them. They are not tied to business success; no senior leader will miss them."
Some metrics you can consider adding for different business goals:
- Conversion metrics: How many people bought or added a product to cart?
Example conversion metrics: goal completions, ecommerce conversion rate, average order value (AOV)
- Website performance metrics: Are people engaging with our website content and landing pages?
Example website performance metrics: engagement rate, page views, engagement time per session, engaged sessions per user
- Paid advertising metrics: How effectively are my paid advertising campaigns attracting new visitors and leads?
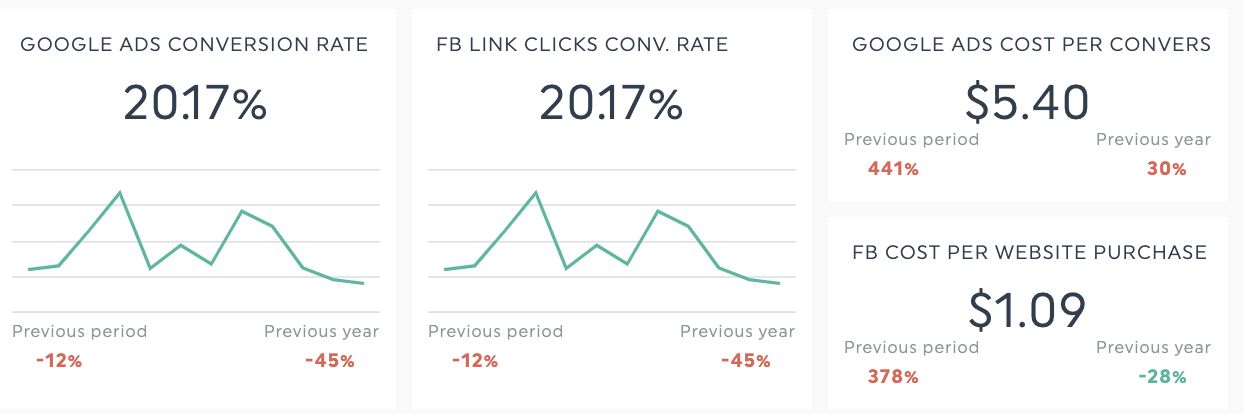
Example paid advertising metrics: cost per result, Facebook ad revenue, impressions, reach
- Long-term business profitability metrics: Is the business financially sustainable in the long run?
Example profitability metrics: Customer lifetime value, net promoter score (NPS), average revenue per unit (ARPU)
- Cart metrics: How is our checkout flow performing?
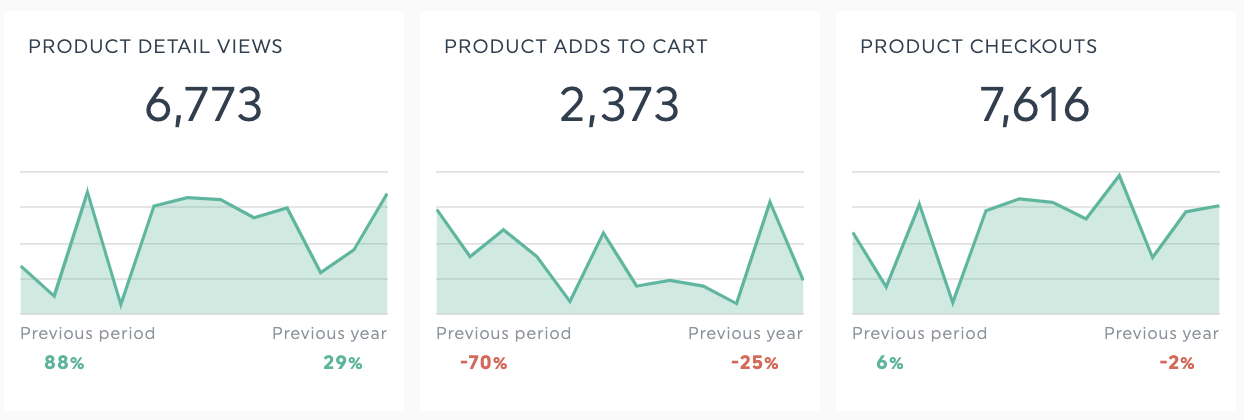
Example cart metrics: Shopping cart conversion rate, number of completed orders, cart abandonment rate, cart-to-product detail views
3. Analysis: Add insights and comment boxes
Now that you’ve got the data, it’s time to turn your reports into something that guides your client to make better decisions.
Let’s say you’re presenting an SEO dashboard to your e-commerce manager client to review their organic marketing efforts.
Here’s how you might approach data analysis.
Describe: What has happened?
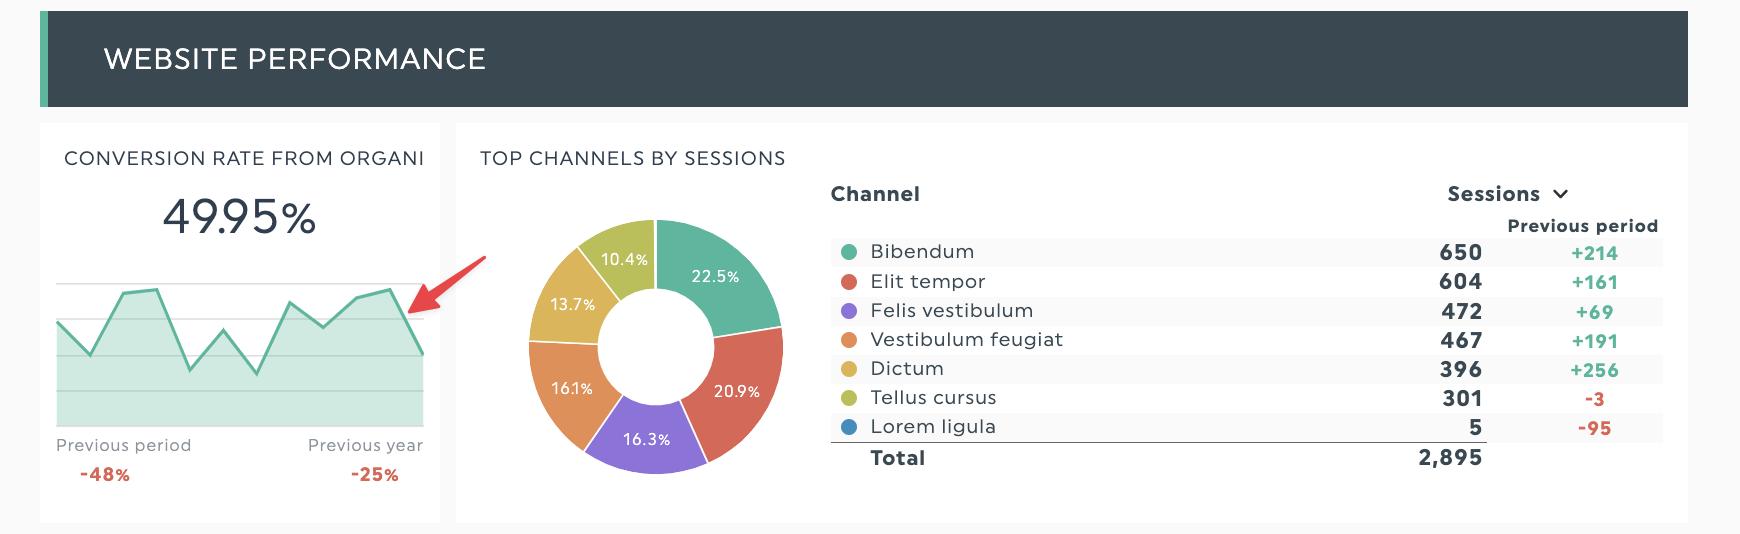
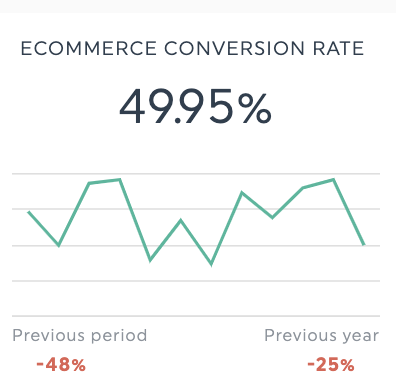
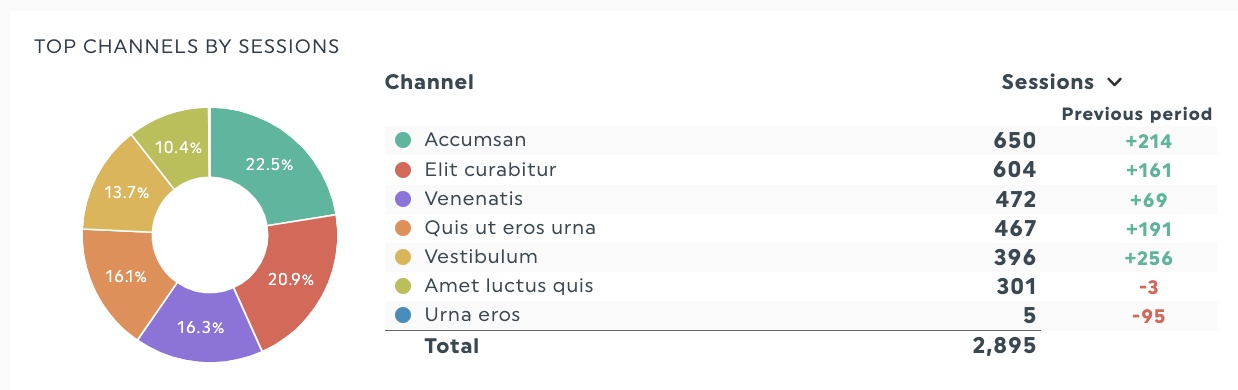
First, you might notice a significant drop in the conversion rate from organic marketing this month. Using DashThis’s widgets and graphs, you can place a channel breakdown next to an aggregate metric.
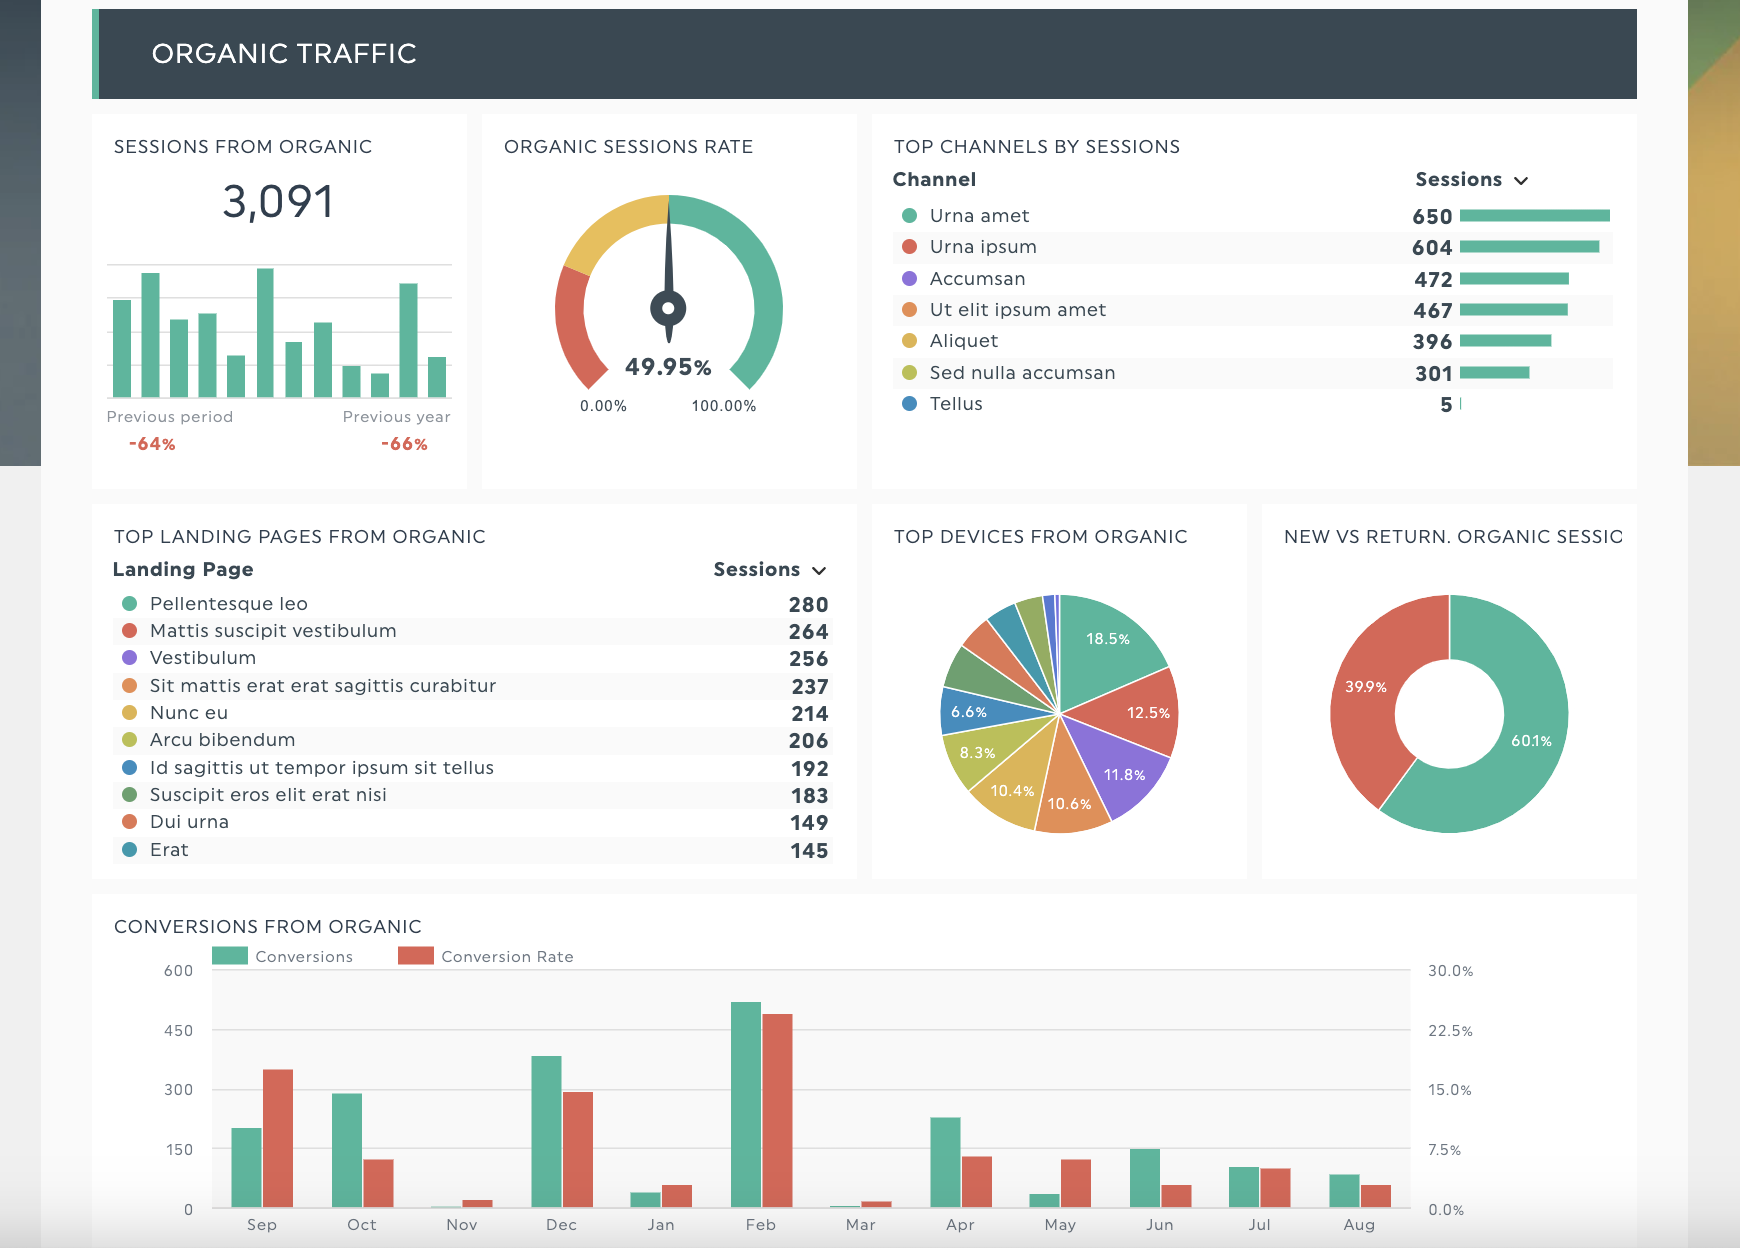
Or dedicate an entire section in your report to organic traffic analysis to help you dive into the data for further research.
Understand: Why did something happen?
Let’s say one of your SEO keyword rankings has dropped, resulting in fewer sessions and conversion rates.
Here’s where you can pull data from your other SEO tools like SEMRush or Moz into your DashThis report (psst, DashThis integrates with these tools, along with 30+ more!)
Then, explain the results to your client. Use DashThis’s notes and comments feature to add extra context to a widget to help your client understand the results.
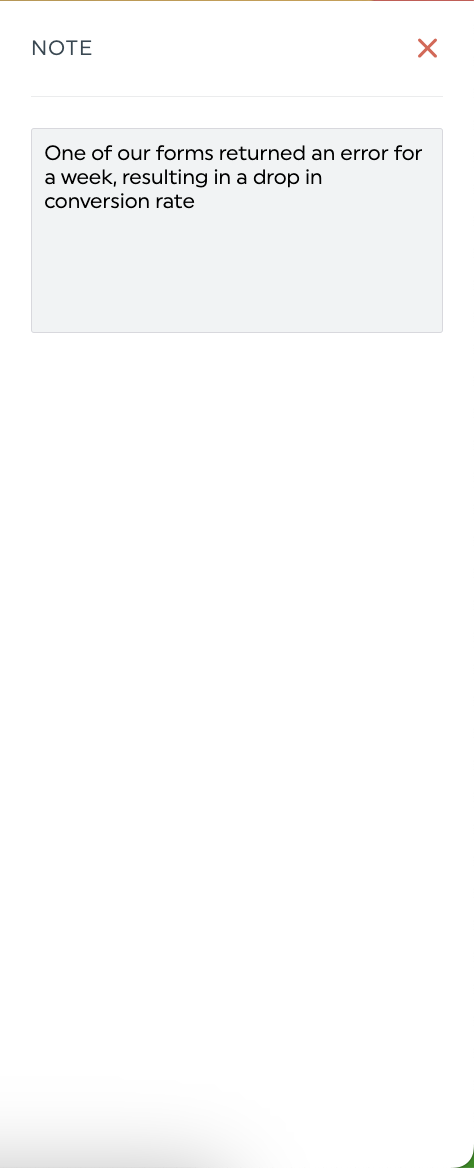
You could also add a summary box on top of the report to give them the highlights quickly.
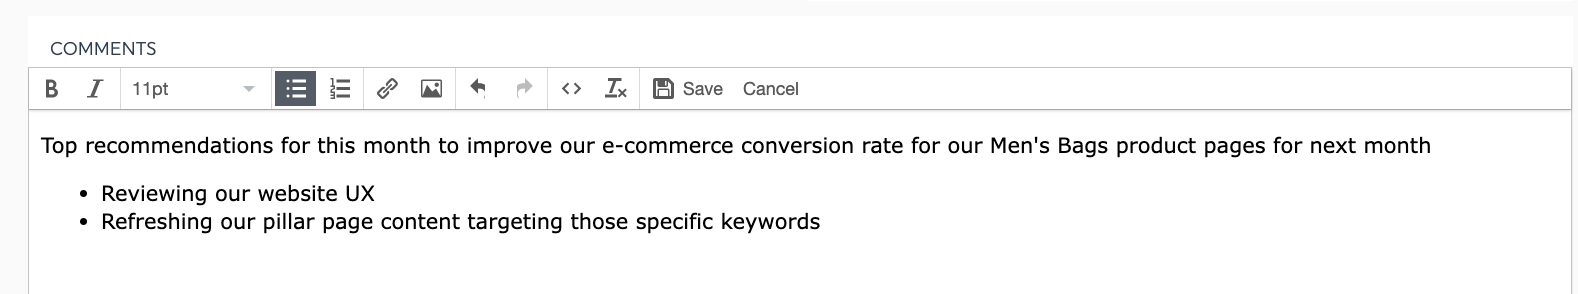
Recommendation: What shall we do next?
OK, so now you’ve got a solid analysis going. Next, make a recommendation and action plan.
So, to improve SEO rankings for a keyword, you might recommend the following:
- Reviewing your website UX
- Refreshing your content targeting those specific keywords
- Investing in a backlink strategy
Now you’ve got a solid process in place for reports. But what if you don’t have time to create a report from scratch?
Not to worry. Here’s where report templates come in to help.
3 top eCommerce dashboard templates with Google Analytics
Our dashboard templates are fully customizable, meaning you could use any of these templates as a foundation for your reports.
Feel free to add or remove widgets, include an executive summary for your client or custom data to make sure your report fits your clients needs.
Send these reports to your client as a PDF report on a regular schedule, refer to them in real-time during client presentations, or use them daily to guide campaign decisions.
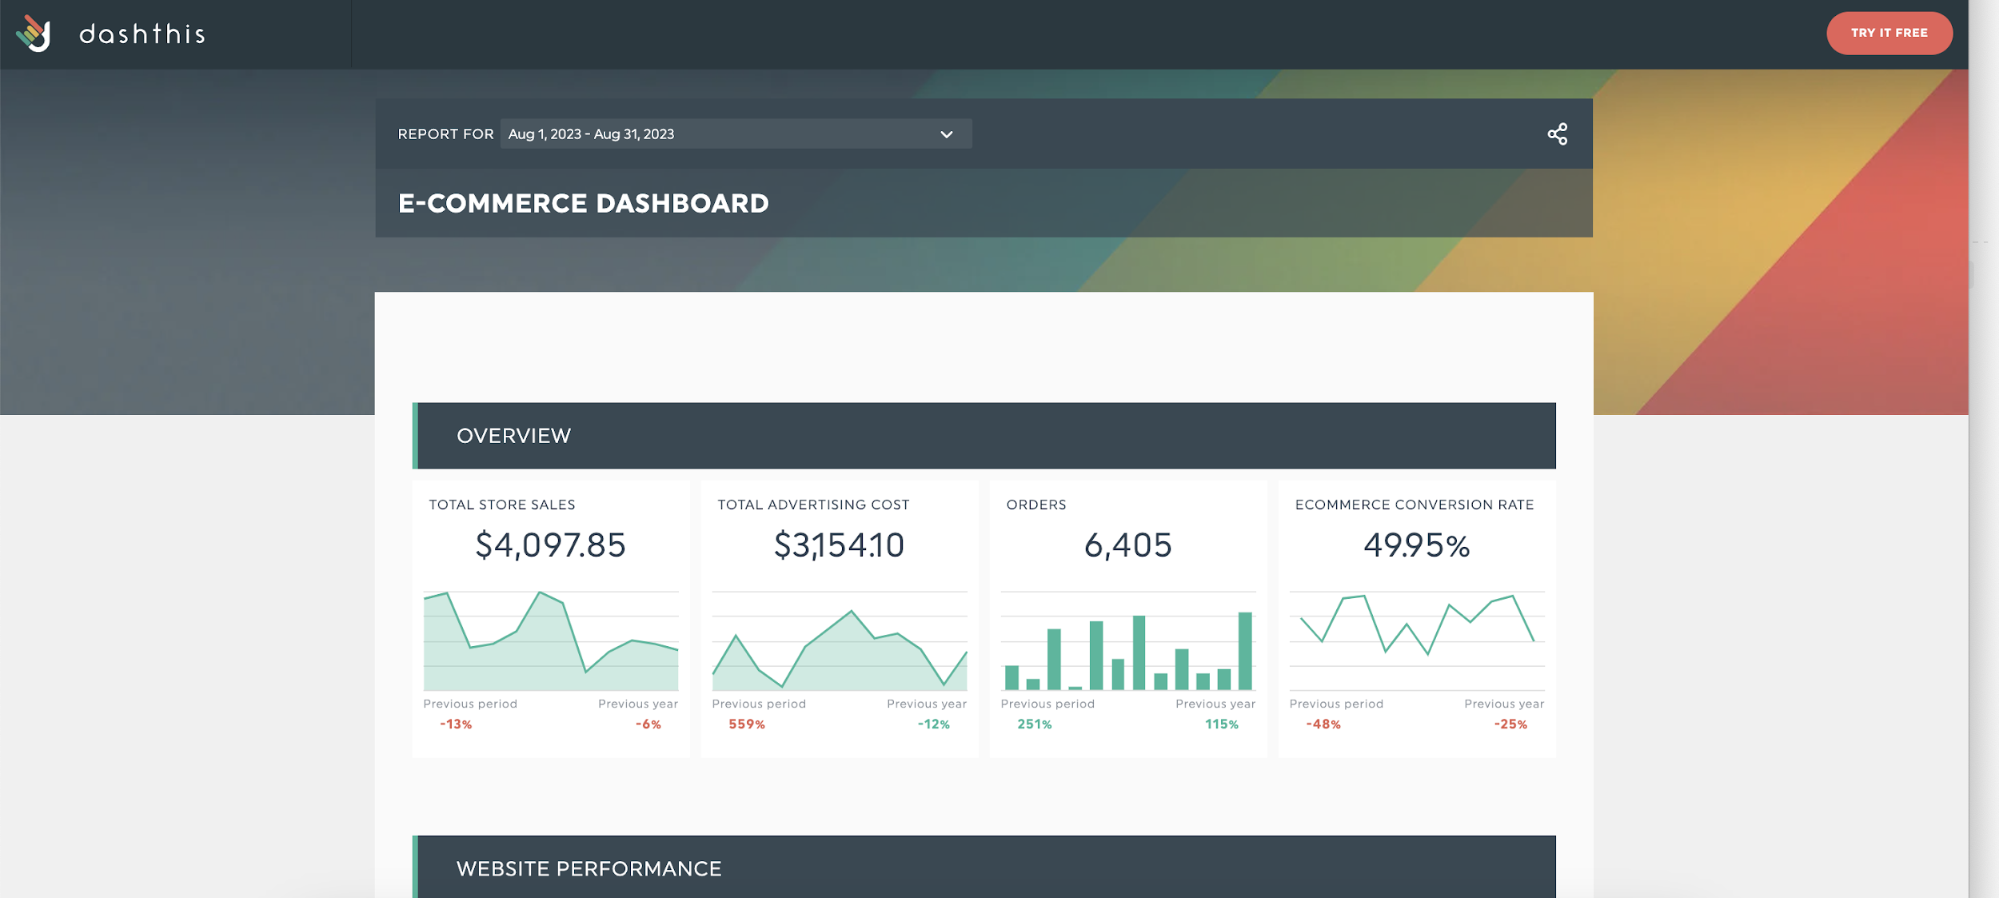
E-commerce report template
Get your ecommerce report with your own data
Help your client make better decisions to grow their ecommerce website by getting a full view on their customers, products sold, and marketing campaign performance with this e-commerce report template.
Features of the e-commerce report template
- All essential e-commerce metrics from revenue, product sales and e-commerce conversion rate by channel to help your client get a quick overview of their e-commerce business performance - perfect for clients who’re constantly on the go
- Integrations from your Shopify store plus marketing tools like Google Analytics 4, Facebook, and Instagram to get all your digital marketing data in one place for easy analysis for that following marketing strategy review
- Prevent information overload with visuals and headers.
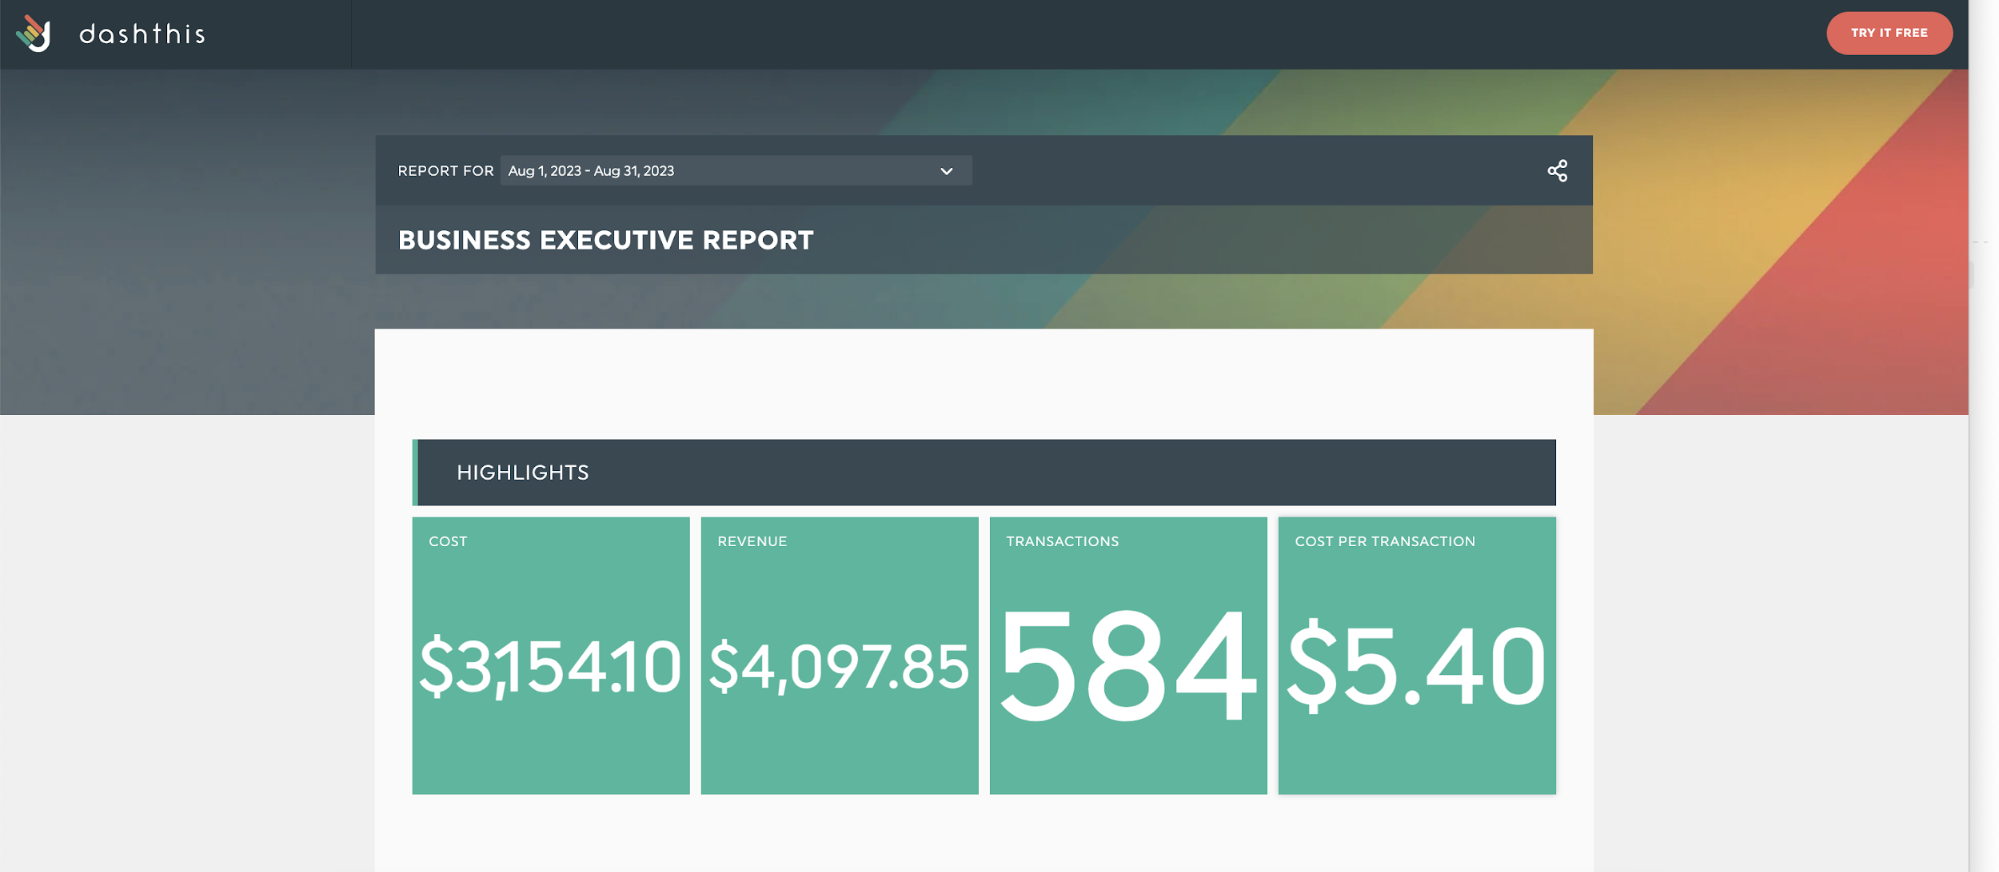
Business executive report template
Get your executive report with your own data!
CEOs make sure a business operates at a profit. They also drive the strategic direction of a company. This report template understands this and keeps critical revenue metrics front and center. They’re often constantly context-switching between different areas of responsibility, so make your report easy to read and relevant to the goal you’re reporting for.
Features of the executive report template
- All critical revenue, profit and return on investment (ROI) data front and center to help your CEO understand the financial health of the business and revenue trends
- Channel-specific details are kept below the fold for your executive to dive into if they need more context on specific metrics
Tip: Make the report as easy as possible for your executive to review. Include a header with an executive summary of this month’s performance. You can also place your client’s goals from the internal kickoff meeting or onboarding questionnaire to contextualize the report’s contents.
GA4 report template
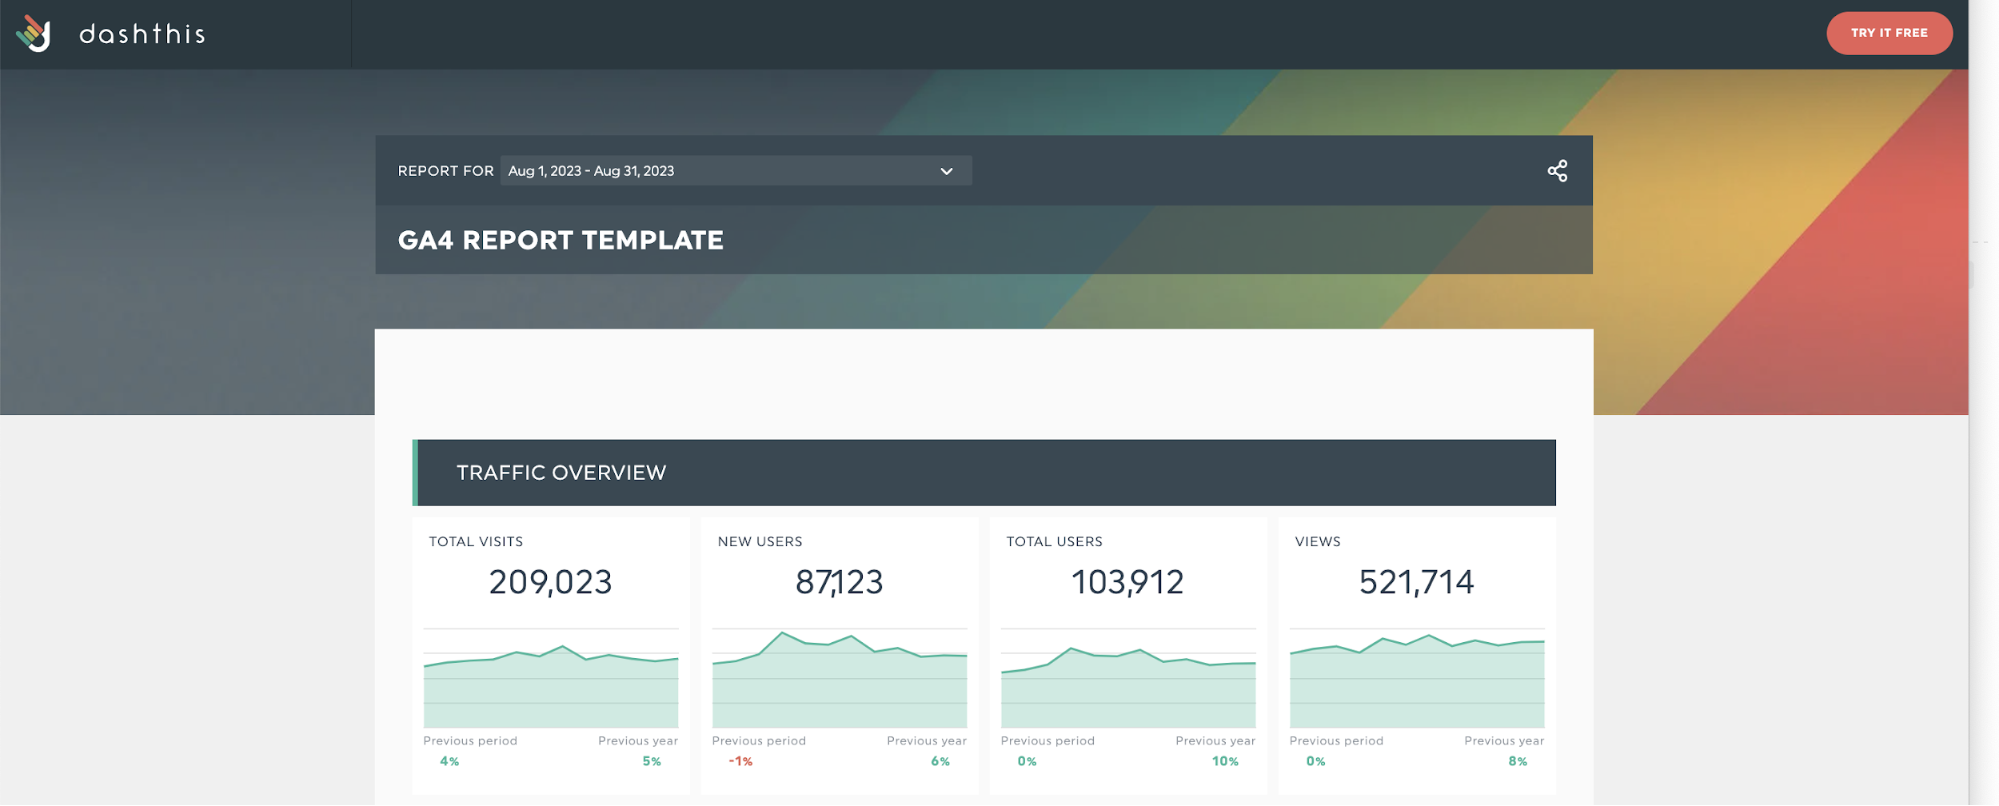
Get your GA4 report template with your own data!
GA4’s native reports feature an overwhelming amount of data and metrics. Fortunately, DashThis GA4 report template is a much more accessible way to review your Google Analytics data.
Features of the GA4 report template
- All your GA4 website data from acquisition, engagement, conversion, and monetization in a dashboard
- A variety of visuals, from pie charts, graphs, and widgets make information accessible
- This report template plays well with DashThis’s integrations. Use our Google Sheets integration and CSV file connector to upload your custom data, or connect your social media data with your website data to understand how well your social selling initiatives are going
PS: Need help adjusting to GA4? Check out our GA4 guides to help you out.
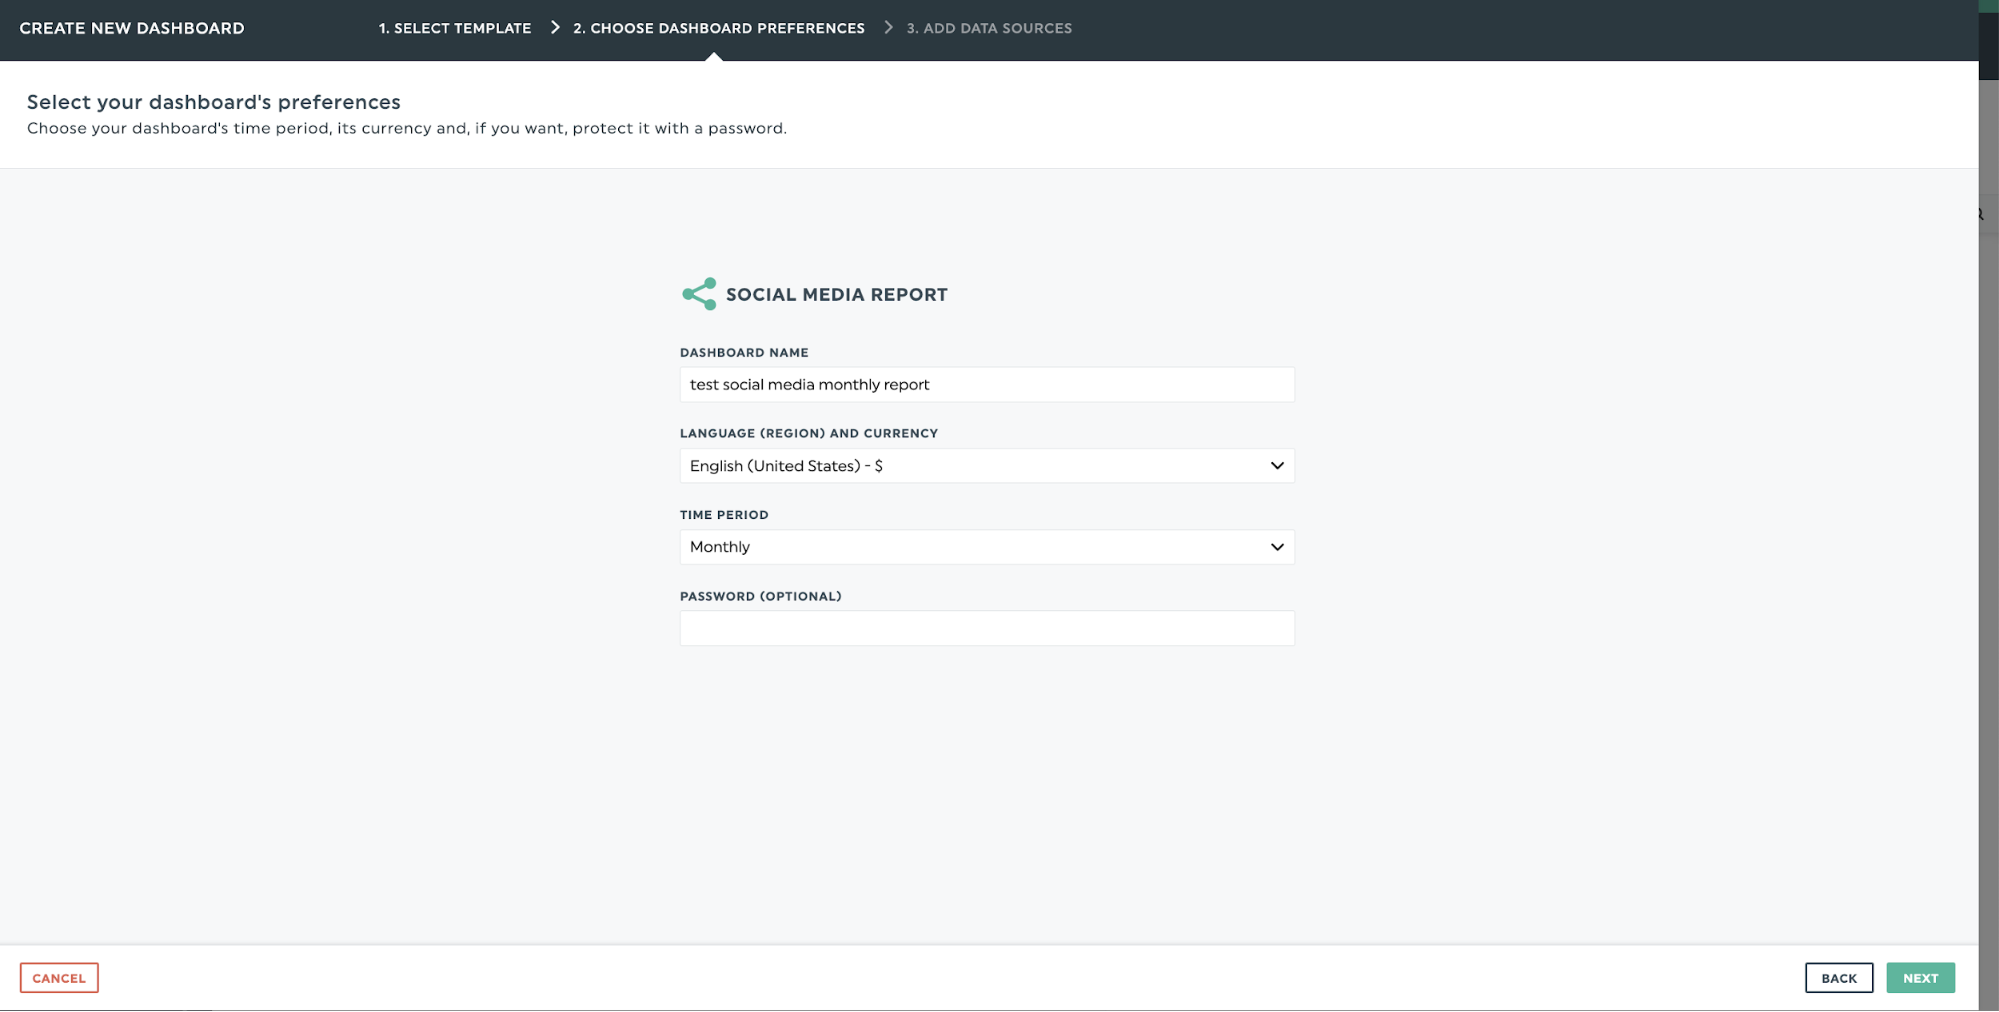
How to create an e-commerce dashboard with Google Analytics in minutes using DashThis
Once done, create your dashboard in DashThis. Take a look at our ready-to-use report templates to get started.
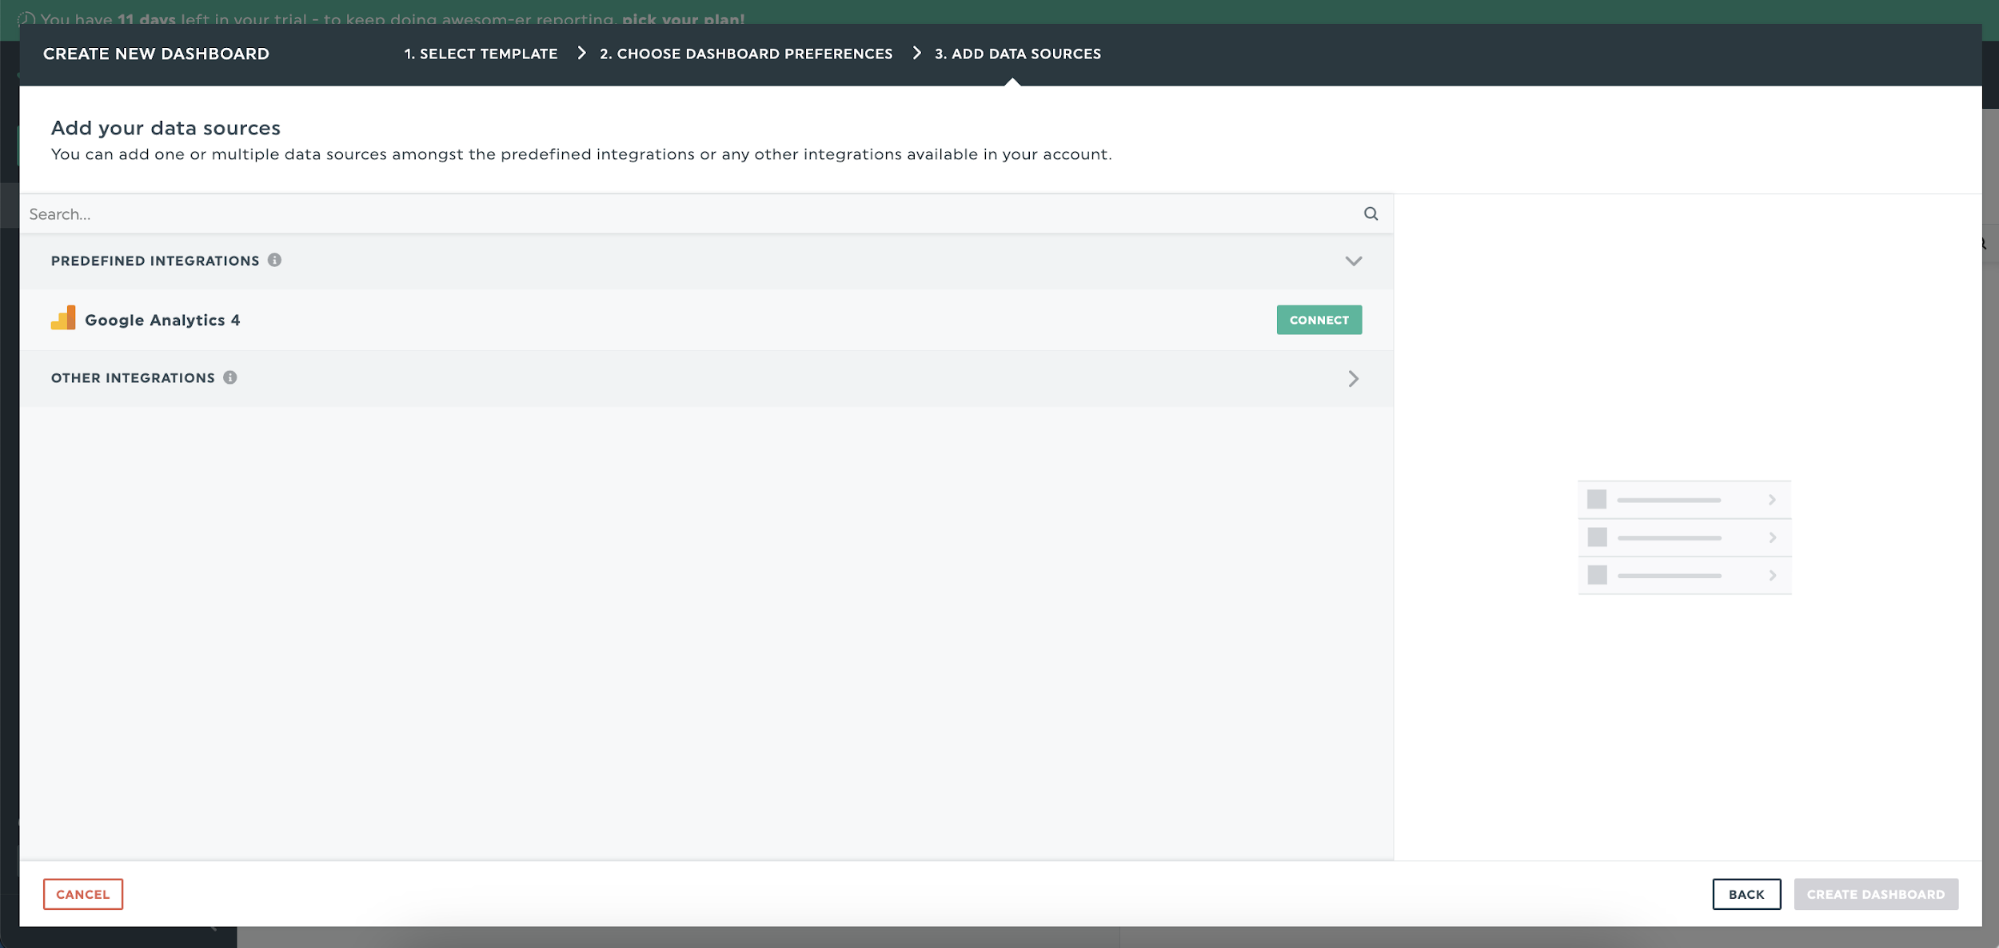
- Add your data sources
Connect your Google Analytics account, your Shopify store, and your favorite marketing tools to DashThis.
Once done, click on Create Dashboard, and you’ll get a pre-populated dashboard to customize
Remember to save your dashboard for future reports!
- Drag and drop as you desire to build your report.
Customize your report templates by selecting metrics from DashThis’s preset widgets.
Automate your e-commerce dashboard analytics with DashThis
Take advantage of DashThis’s time-saving report automation today for your Google Analytics dashboards. Sign up for your free 15-day trial of DashThis and see how much time you free up today.

Ready to create an eCommerce dashboard?
Read More

Don’t miss out!
Follow us on social media to stay tuned!
Automate your reports!
Bring all your marketing data into one automated report.
Try dashthis for free