What is a website dashboard?
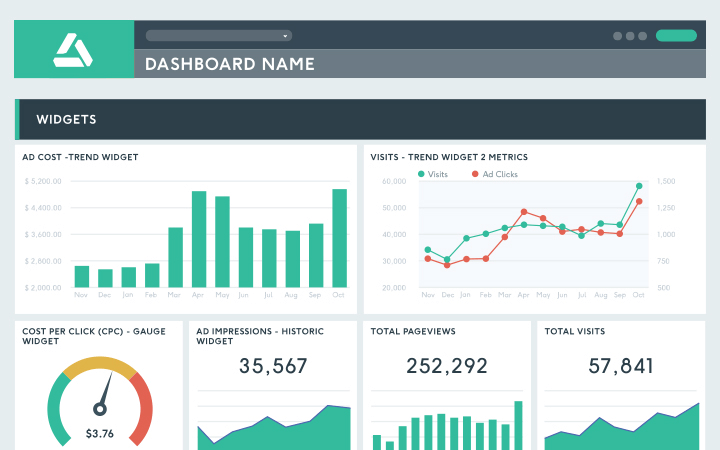
A website dashboard is an online report where your website data -- from ecommerce to web analytics -- is displayed. You're able to combine different data sources in one dashboard or you can create dashboards for different channels - it's totally up to you.