Google Analytics 4 reporting made simple: a beginner's guide (+ GA4 reporting template)

If you haven't switched to GA4, or if you don't know what the differences are between the two digital analytics systems, we've created this guide to help you understand the differences between the two: what's new, what's changed, and how it impacts your client reporting.
What is Google Analytics 4?
Announced in October 2020, Google Analytics 4 (GA4) is Google’s latest iteration of its analytics platform.
Here’s what will change between GA4 and Universal Analytics.
- More straightforward reporting: GA4’s new event-based attribution tracks mobile and desktop activities and explains how visitors move through the customer journey instead of splitting user behavior data into sessions or devices.
- Analyzing and collecting data is also easier. No need to set up Google Analytics for Firebase to track mobile app usage or a separate web property to track website usage.
- New metrics. Some UA metrics no longer exist, like bounce rate or unique page views), while you’ll see new GA4 properties and functionalities.
- More privacy controls. GA4's privacy-first event tracking doesn't rely on cookies, and you can limit data collection to specific device categories or locations.
- Machine learning-powered analytics. GA4 introduces machine learning to predict the future behavior of your visitors.
Google Analytics last major update was in 2012, and how we use the Internet has shifted drastically. Instead of a linear path from awareness to purchase across one device, here’s you might research and buy a pair of shoes:
- You first see an ad for shoes while scrolling your phone in bed on Amazon
- Intrigued, you review comparisons and YouTube reviews on desktops to find out more
- You let it stew in your heads, engaging with written reviews, Instagram reels, and video content across multiple devices across a few months
- Finally, you’ve got enough info to decide and check out on the mobile website while scrolling your phone in bed
GA4 is Google’s effort to update its analytics model to these new digital behaviors.
PSA: GA4 replaces Universal Analytics properties permanently from July 2023, meaning it’s an excellent time to migrate your data to GA4 and get comfortable with the platform.
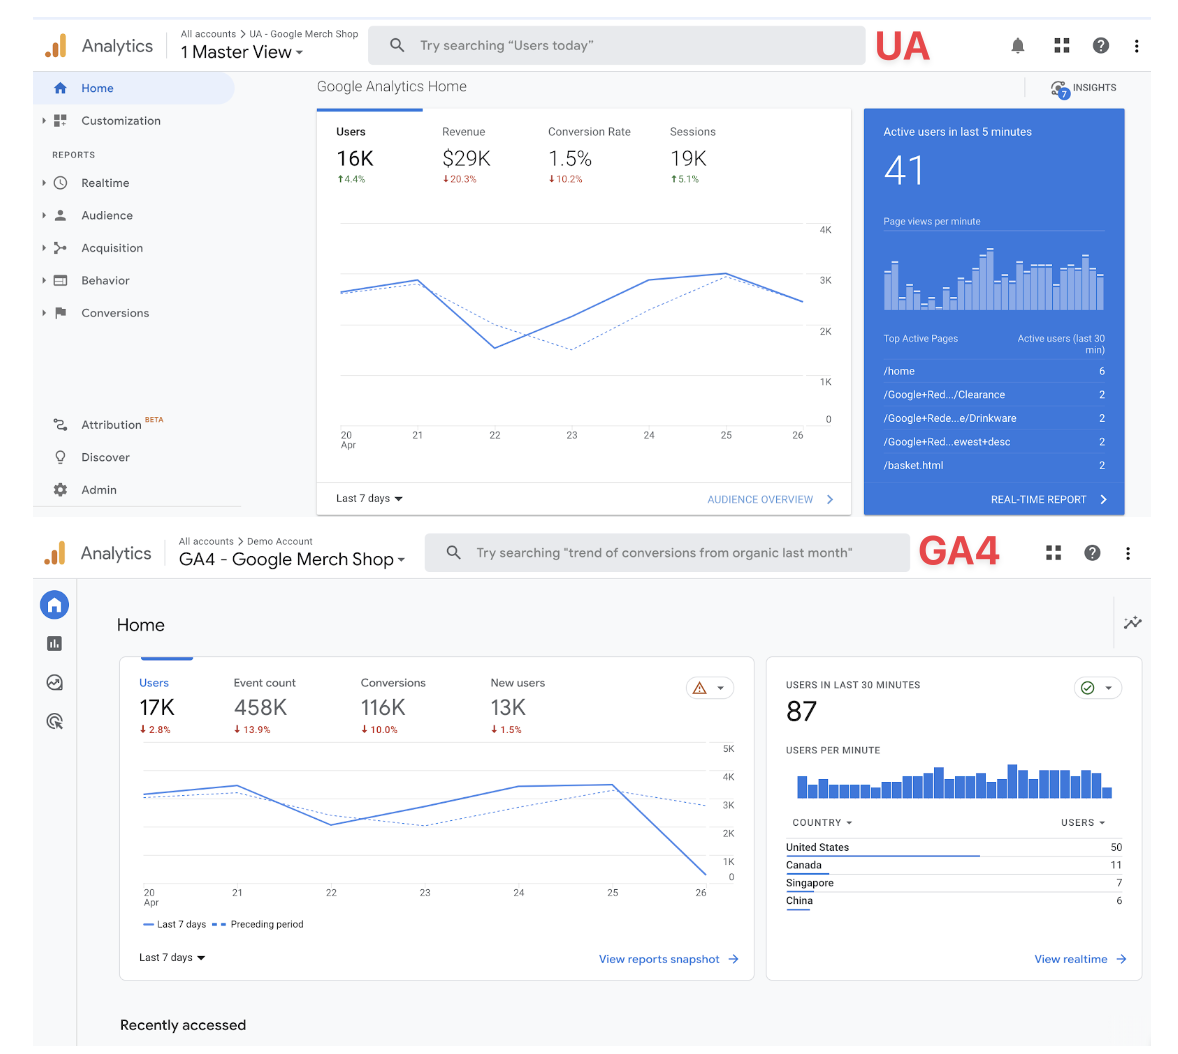
Google Analytics 4’s cleaner reporting interface vs. UA
We’ll dive into some of these significant differences in the next section.
What are the essential differences between Universal Analytics and GA4?
1. GA4’s event-based data model makes reporting more straightforward.
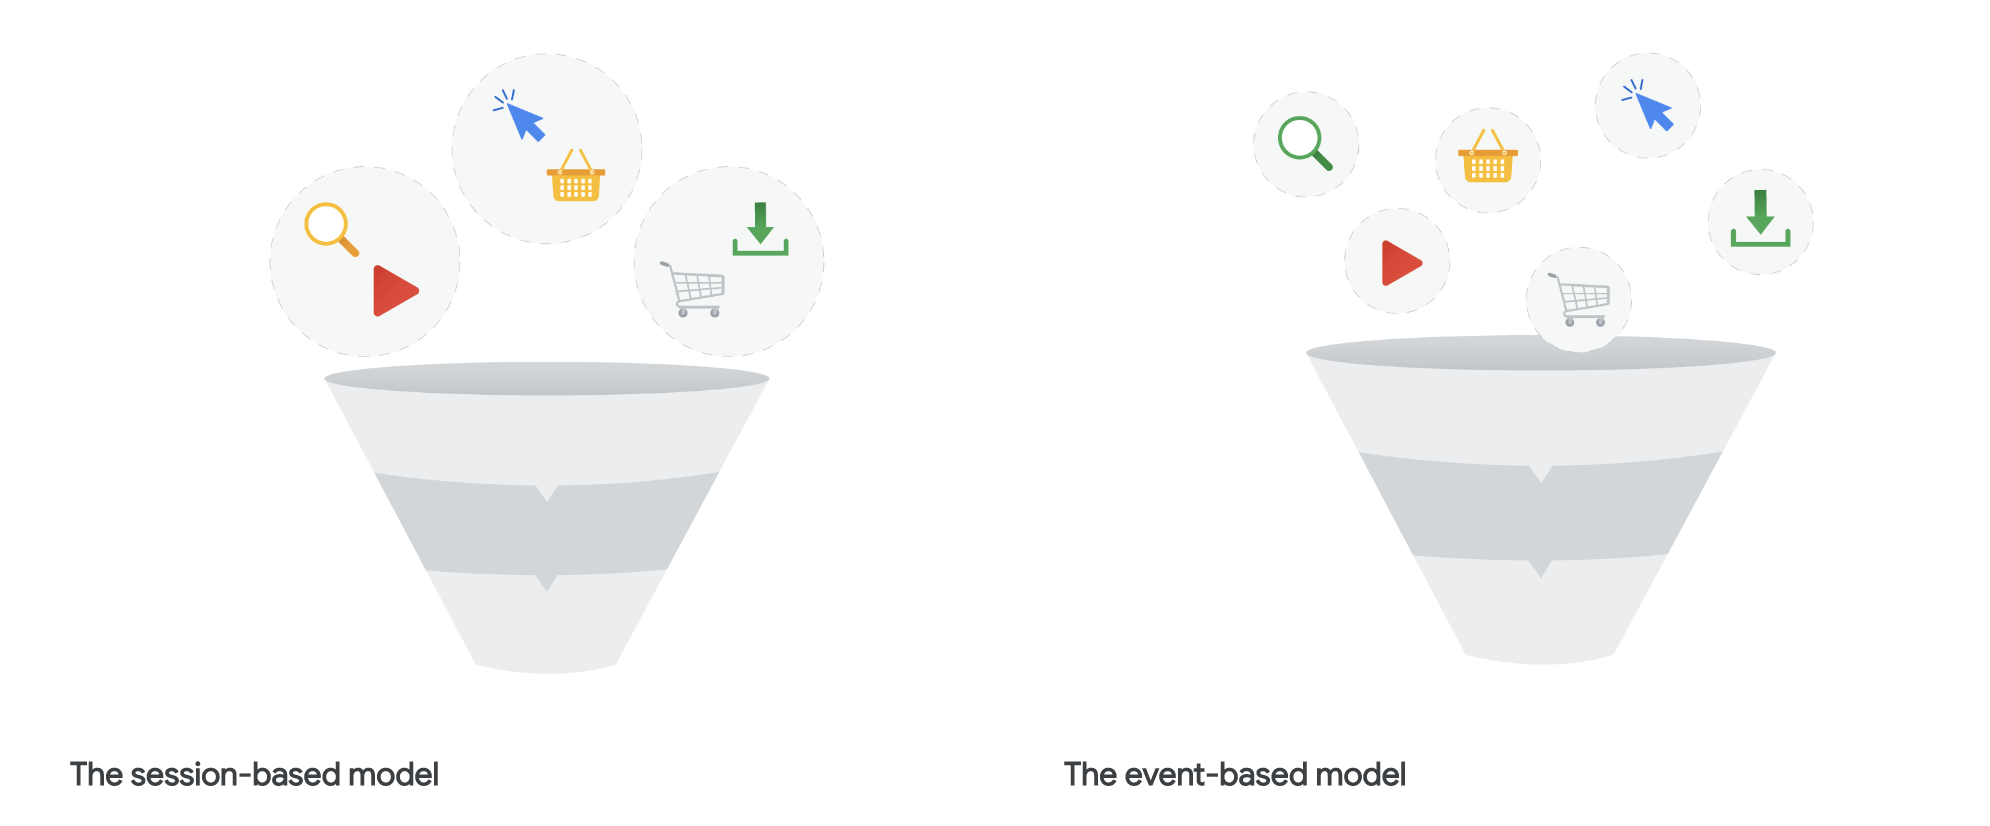
Key differences between session-based and event-based data models. Image from Google SkillShop: What Sets Google Analytics 4 Properties Apart
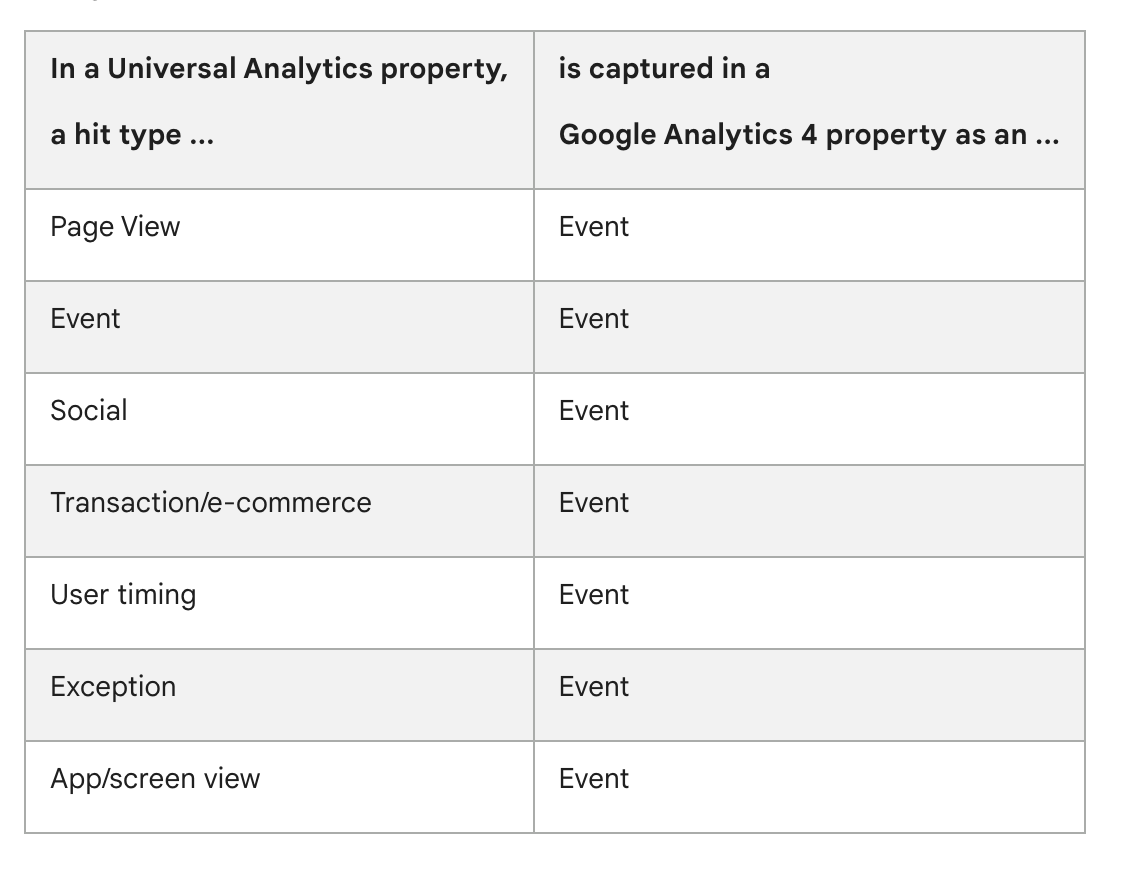
During a session in UA, a user can view multiple pages, sign up for a newsletter (trigger a conversion event) and buy things online (complete a transaction). UA collects these interactions as ‘hits,’ and a single session can contain multiple hits.
GA4 uses an event-based data model. It captures user interactions as separate events, meaning every interaction on the web, mobile, or app, whether viewing a page, clicking a button, or downloading a file, is separate. Finally, there’s no limit on sessions by time.
This event-based model is more flexible in predicting visitor behavior. You’ve got a more consistent data structure across your website and iOS or Android mobile app - making for easier data capture and analysis.
2. Goodbye custom reports, hello Explorations
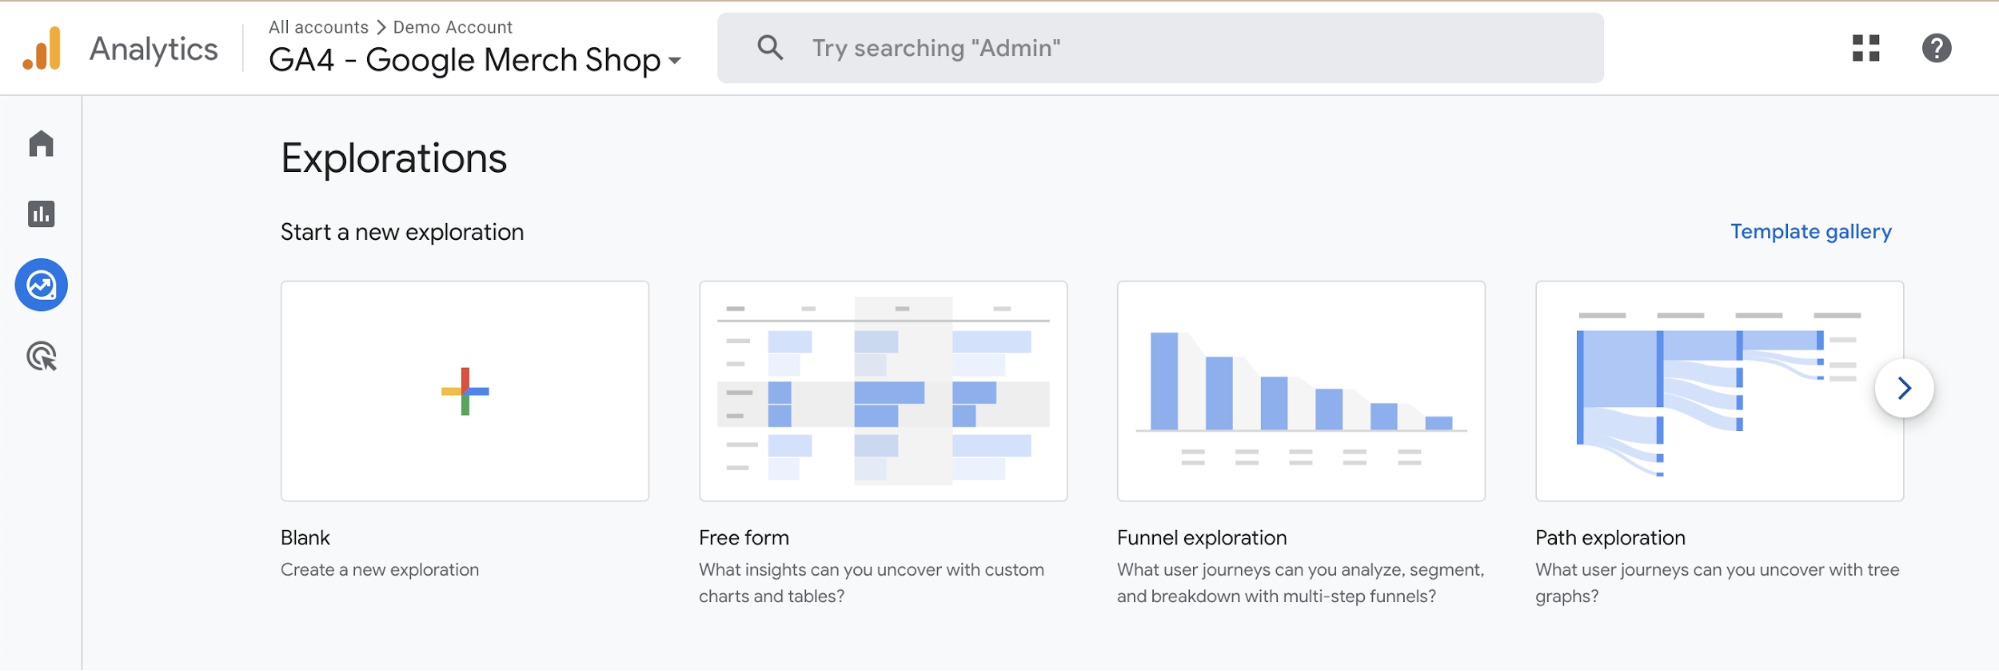
Good news for data analysts worldwide. GA4 introduces Explorations, a new feature that helps you analyze your data more effectively and in detail using intuitive visualizations.
Compared to UA’s Custom Reports, GA4’s Explorations is a one-stop analysis hub. It can help you see how different user segments relate, drill down into individual user activities, visualize the paths your users' paths as they interact with your website or app, and more.
A snapshot of questions you can answer with GA4’s Explorations.
3. A new identity management and privacy-first data model
GA4 introduces many new privacy features to comply with increasing privacy regulations like the GDPR.
Some of these additions:
- GA4 does not log IP addresses, whereas IP addresses were collected by default in UA
- GA4 collects EU data in EU-based servers, making GA legal to use in the EU. It previously processed EU users' data on servers in the United States.
- More control over device category and location data collection per region to reduce compliance risks
- Regional control over Google signal data collection. These data points collect data to personalize ads for people who have turned on Ads Personalization
Read more: More key differences between GA4 and Universal Analytics here.
A quick guide to GA4 reports
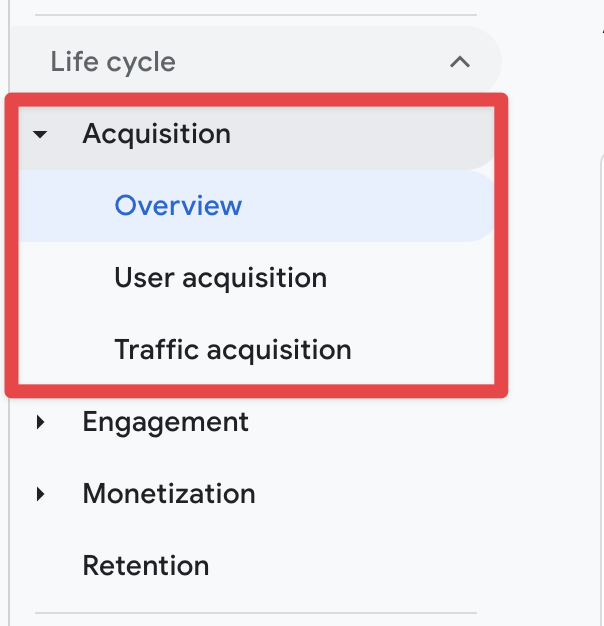
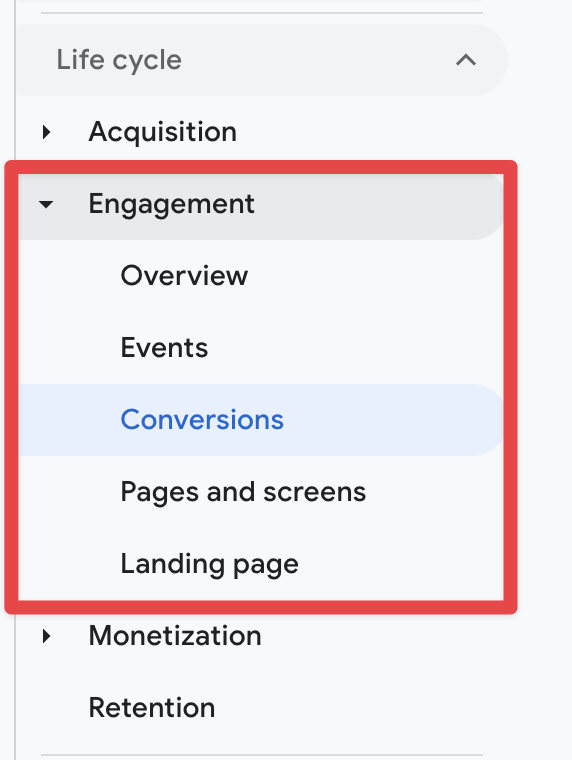
GA4 introduced a bunch of new reports that help you get a better picture on your website activity, which acquisition campaigns to focus on, and so on. They’ve structured the dropdown menu according to a typical customer lifecycle - Acquisition, Engagement, Monetization and Retention
GA4 also offers a convenient site search feature that allows you to easily search through your data streams, locate realtime reports, and access other GA4 properties using natural language queries.
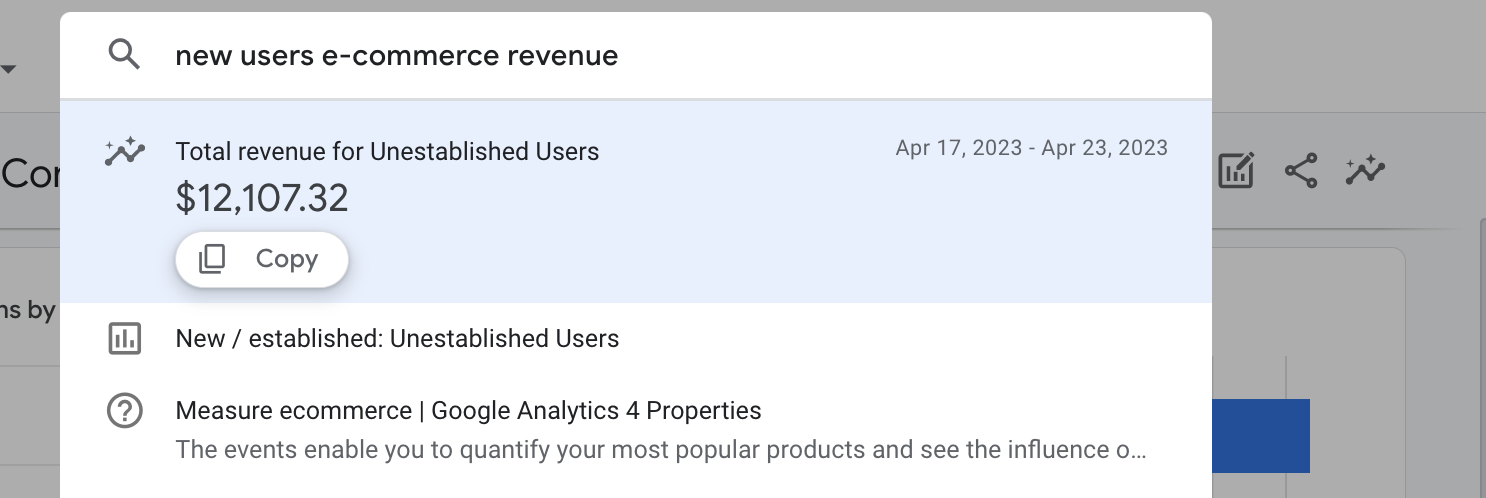
Here’s GA4 showing the total revenue metric based on a query
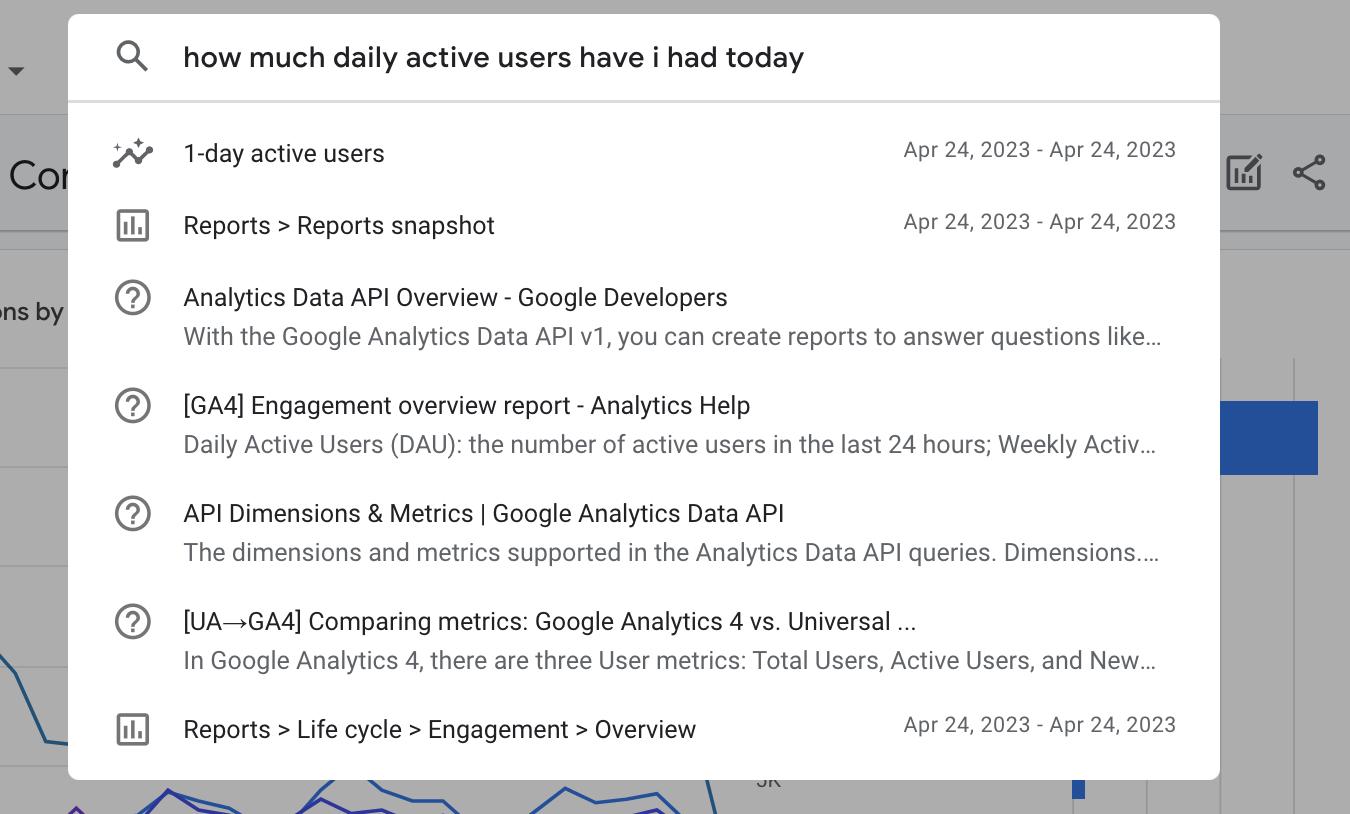
GA4 directing you to an appropriate report
User reports
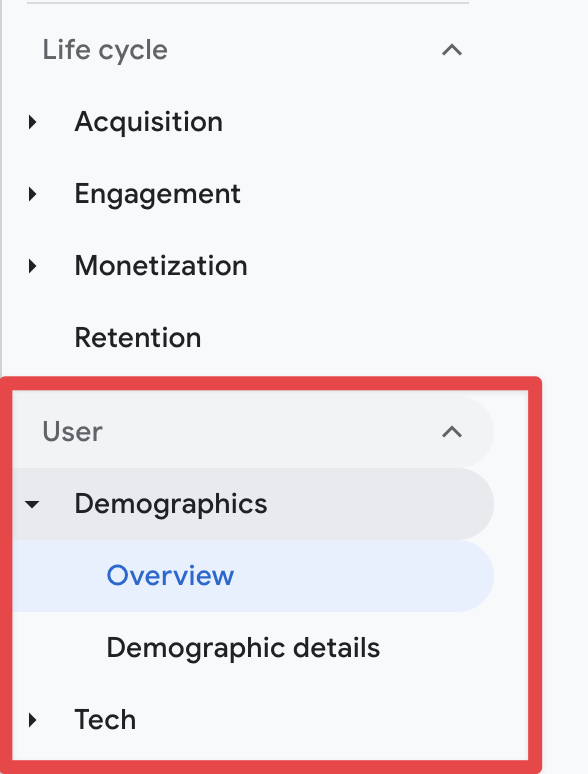
These reports shed more light on your website users to learn more about who’s visiting your website. You can use this data to create more targeted ad campaigns or understand if your website visitors match your ideal customer profile for any decision-making.
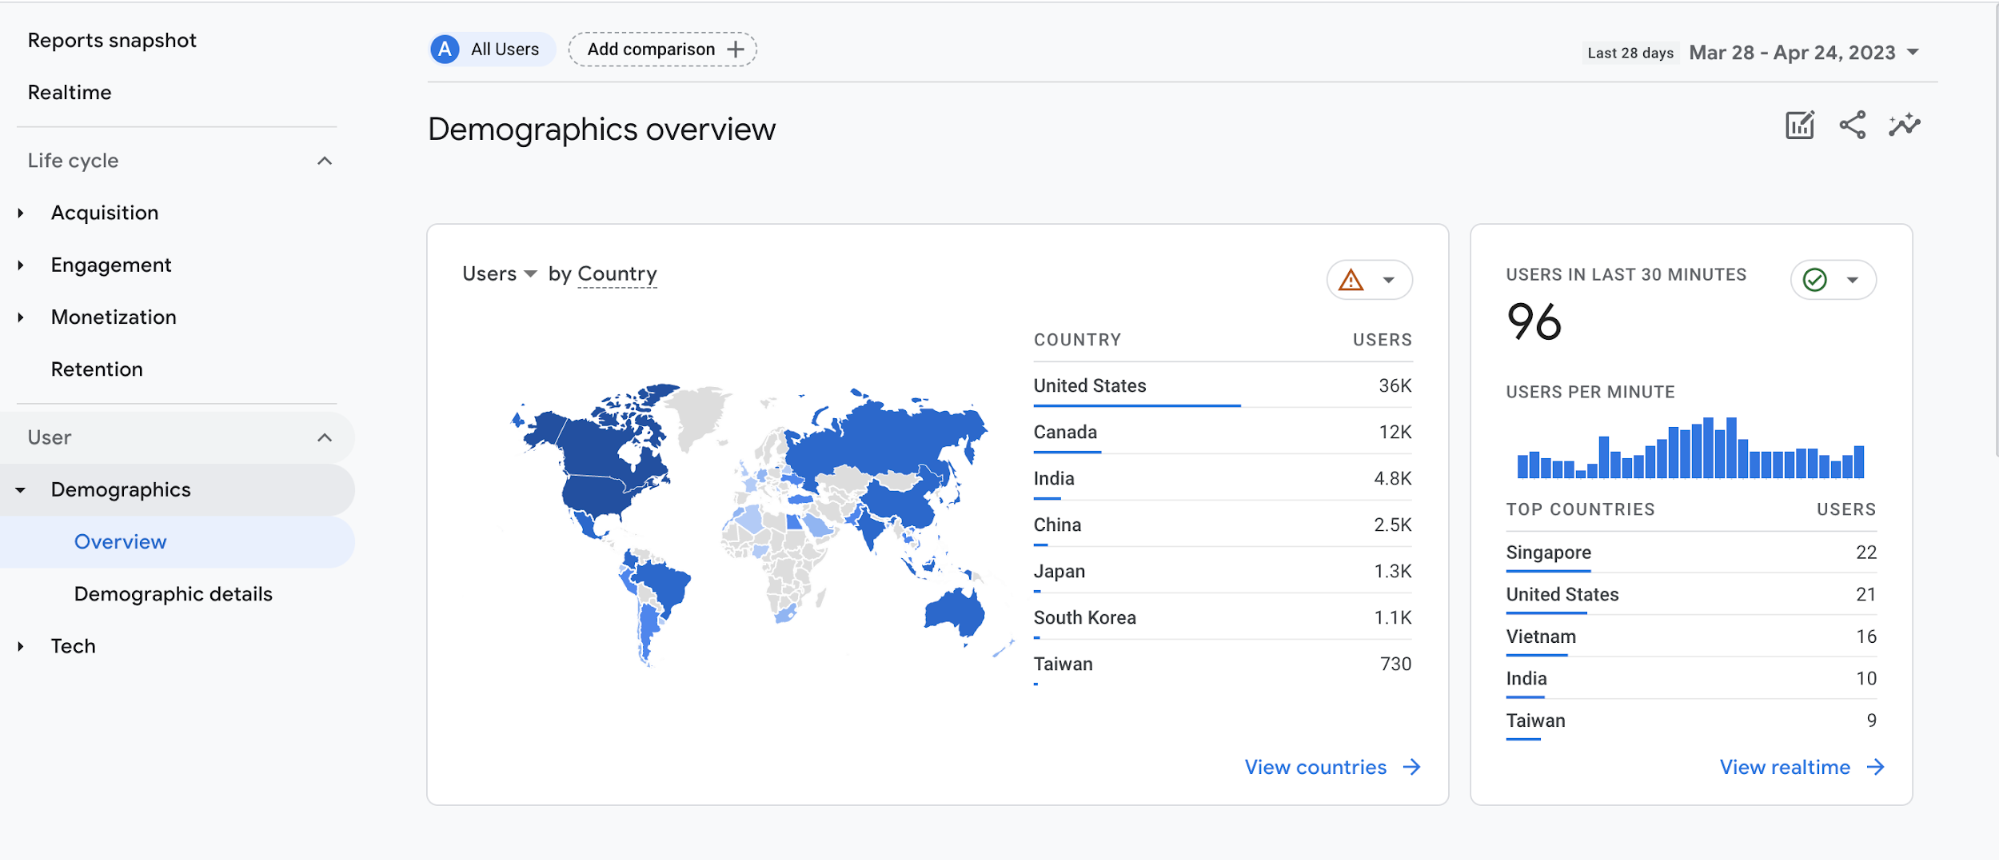
Demographic:
Where are your website users from? Demographic reports help you to know your audience. Drill down into country or city-level data, what languages they speak, and how old they are.
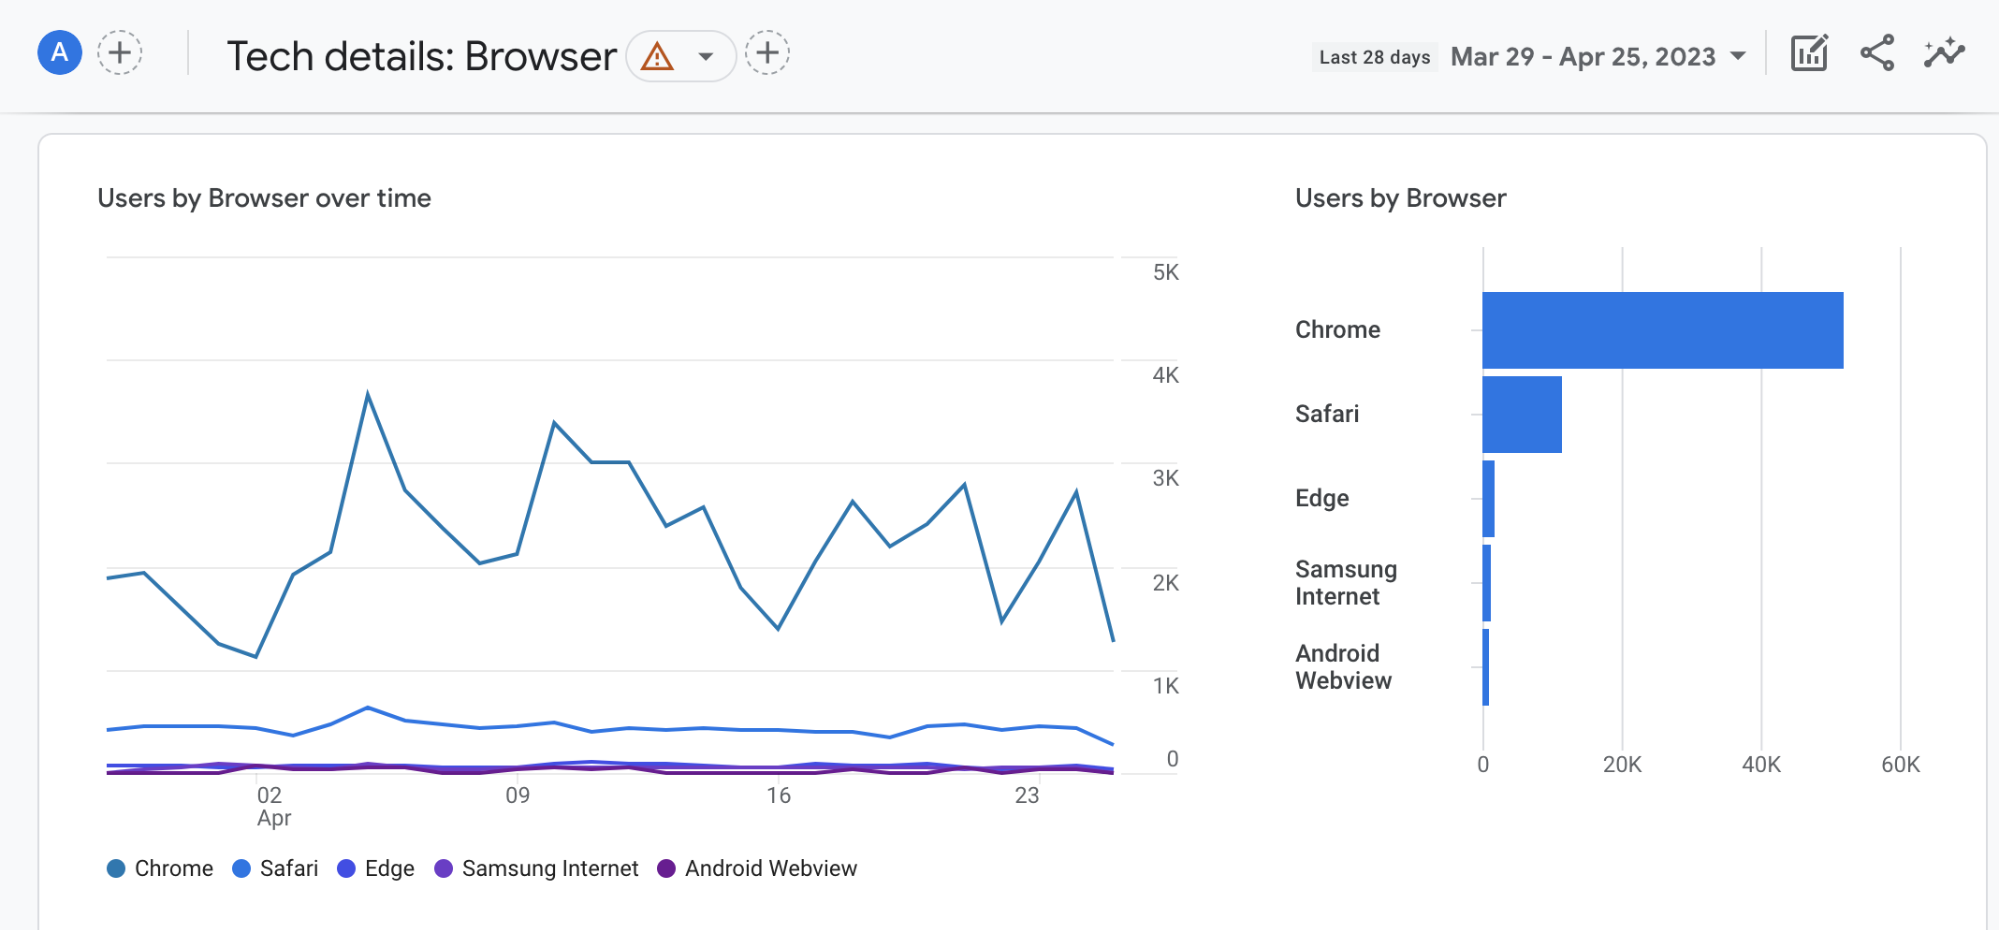
Tech:
Which platforms, devices, operating systems and browsers do people use to access your website or app? You can use this data to optimize your app, troubleshoot problems or prioritize feature development. Savvy marketers can narrow their campaign targeting criteria based on tech info here.
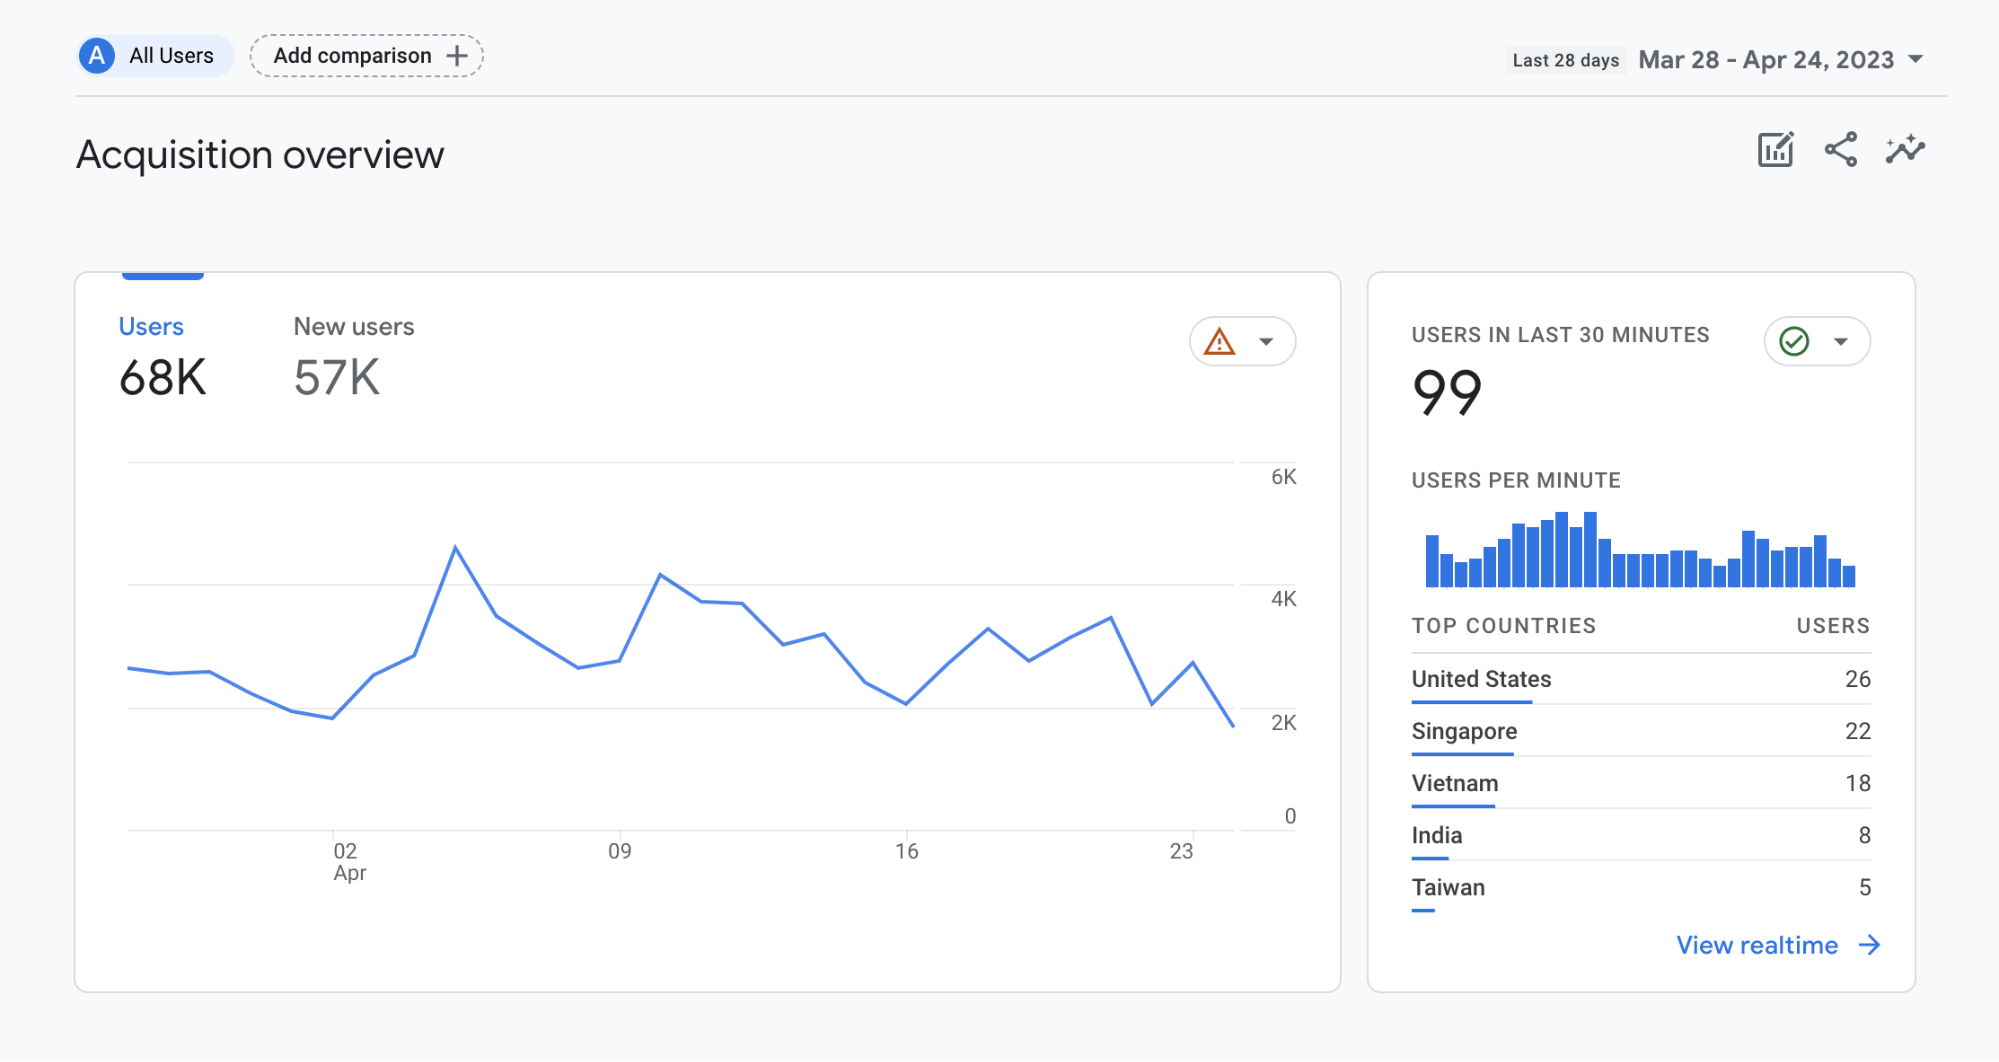
Acquisition reports
How do recent visitors find your website or app for the first time? Which channels did they use, and through which campaigns?
Marketers will love this set of reports, as they’re crucial to discovering effective marketing campaigns, and understanding whether you need to attract more recent visitors or invest more in retaining returning customers.
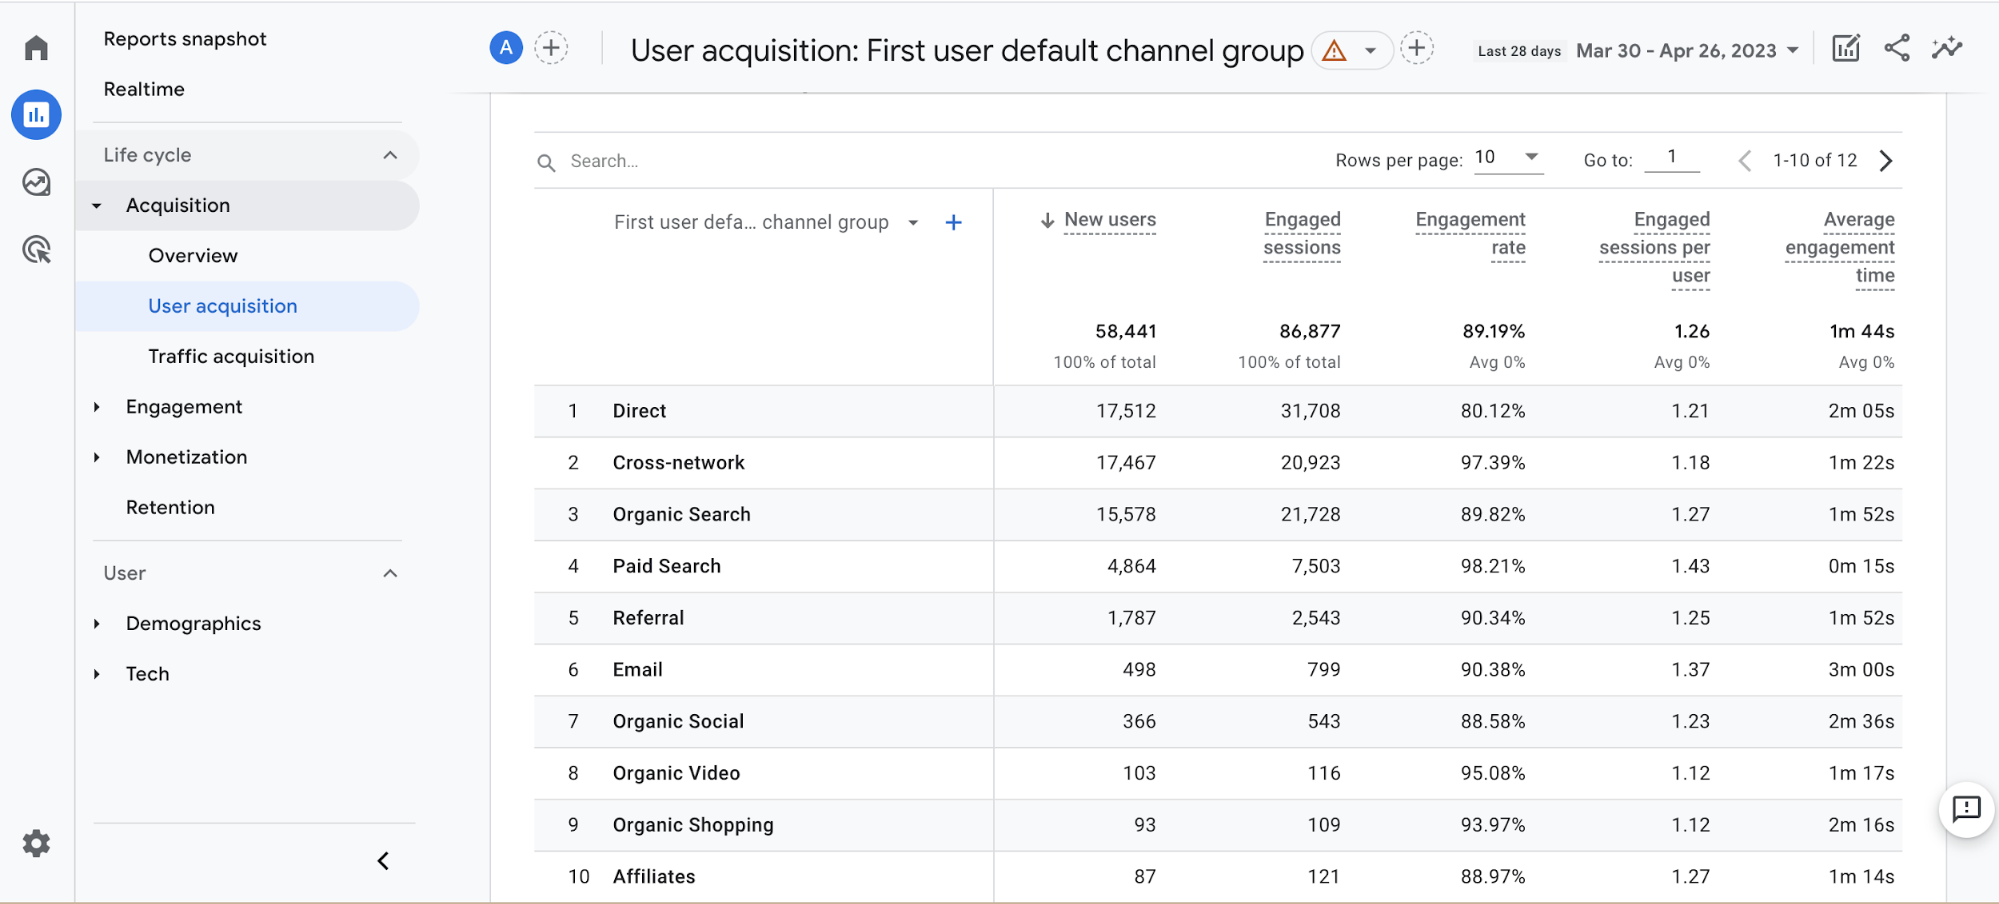
Each acquisition report shows how user engagement differs across channels, helping you identify top-performing channels for your marketing strategy or gather an audience for a remarketing campaign.
There’s a critical difference between user acquisition and traffic acquisition. User acquisition measures how new users find your website or app for the first time. In contrast, traffic acquisition analyzes where new sessions came from, regardless of whether the user is new or returning.
Behavior reports
What site content or landing pages are people engaging with? GA4’s behavior reports help you determine what your users find appealing based on the content they interact with.
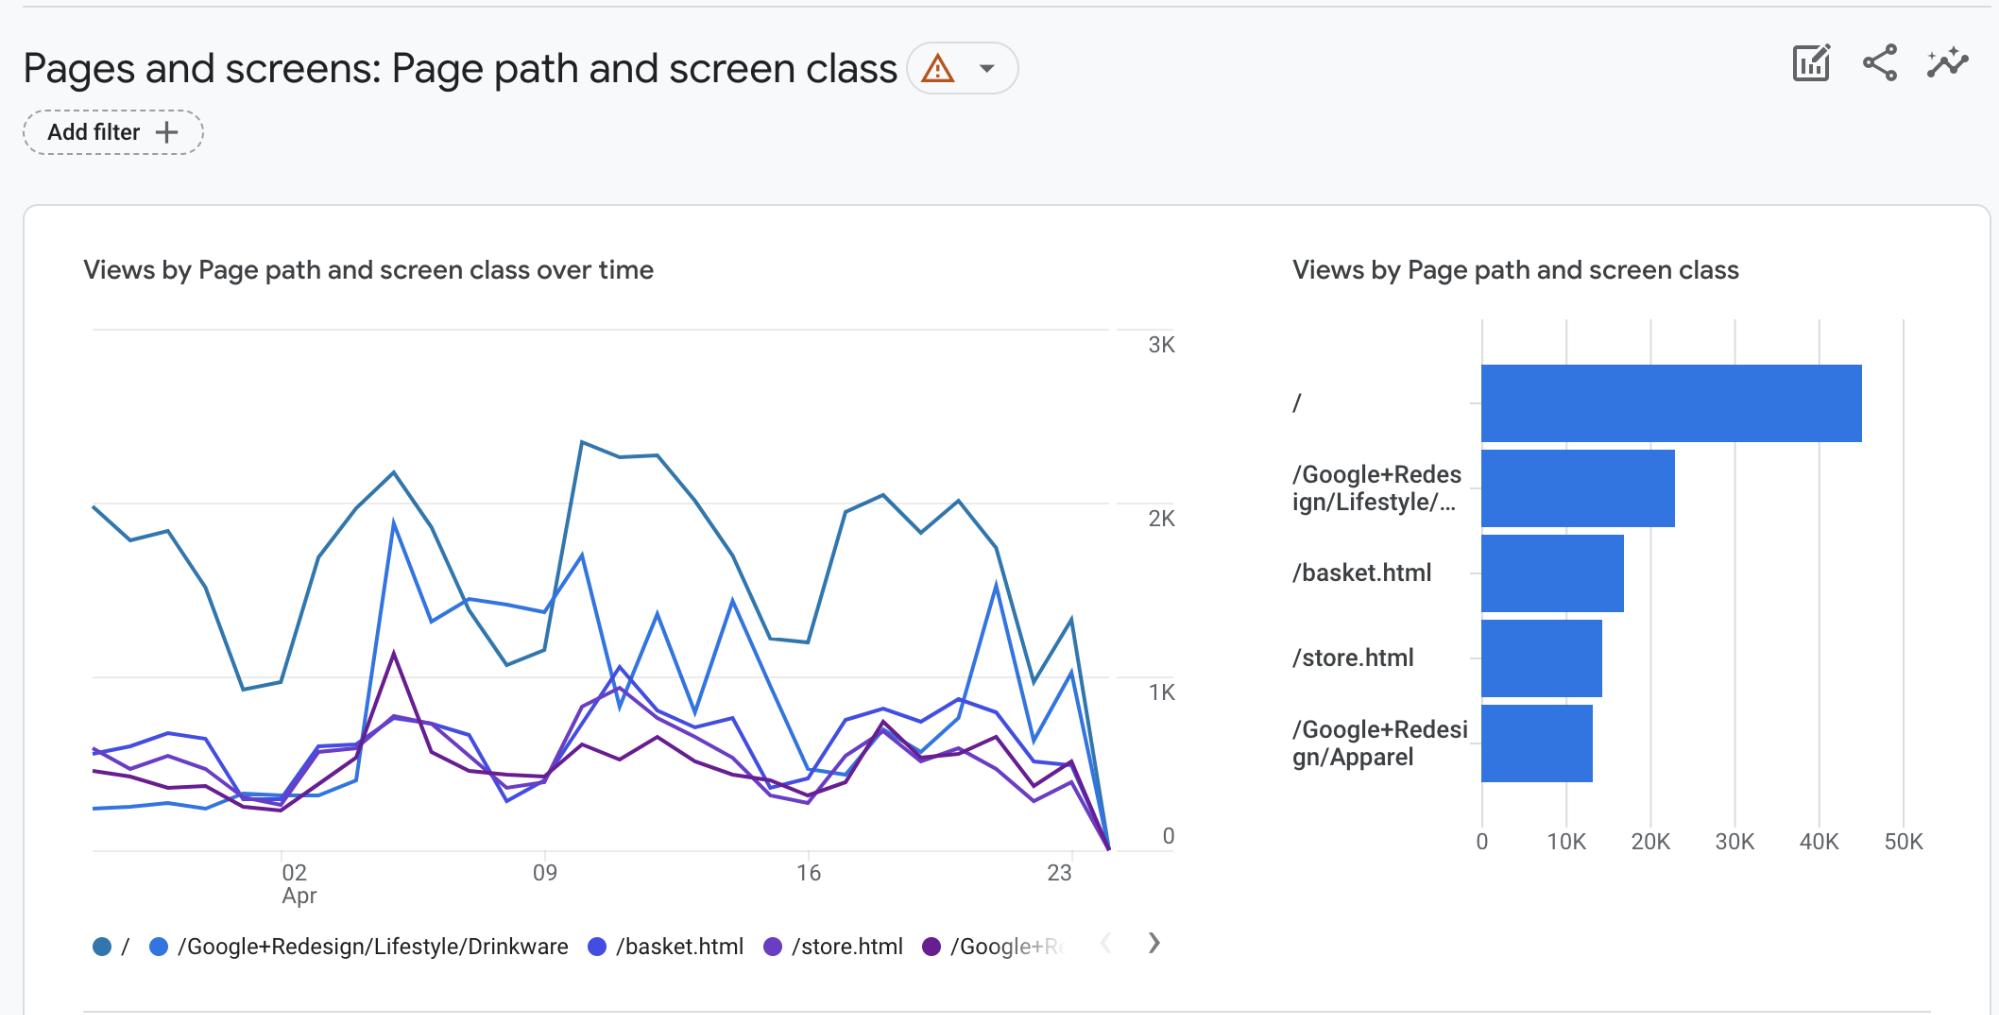
Pages and screens report:
The page report shows how your website and mobile apps perform according to the number of page views (known as screens in mobile apps). Scroll down to get more details on engagement metrics like average engagement time, views per user, etc.
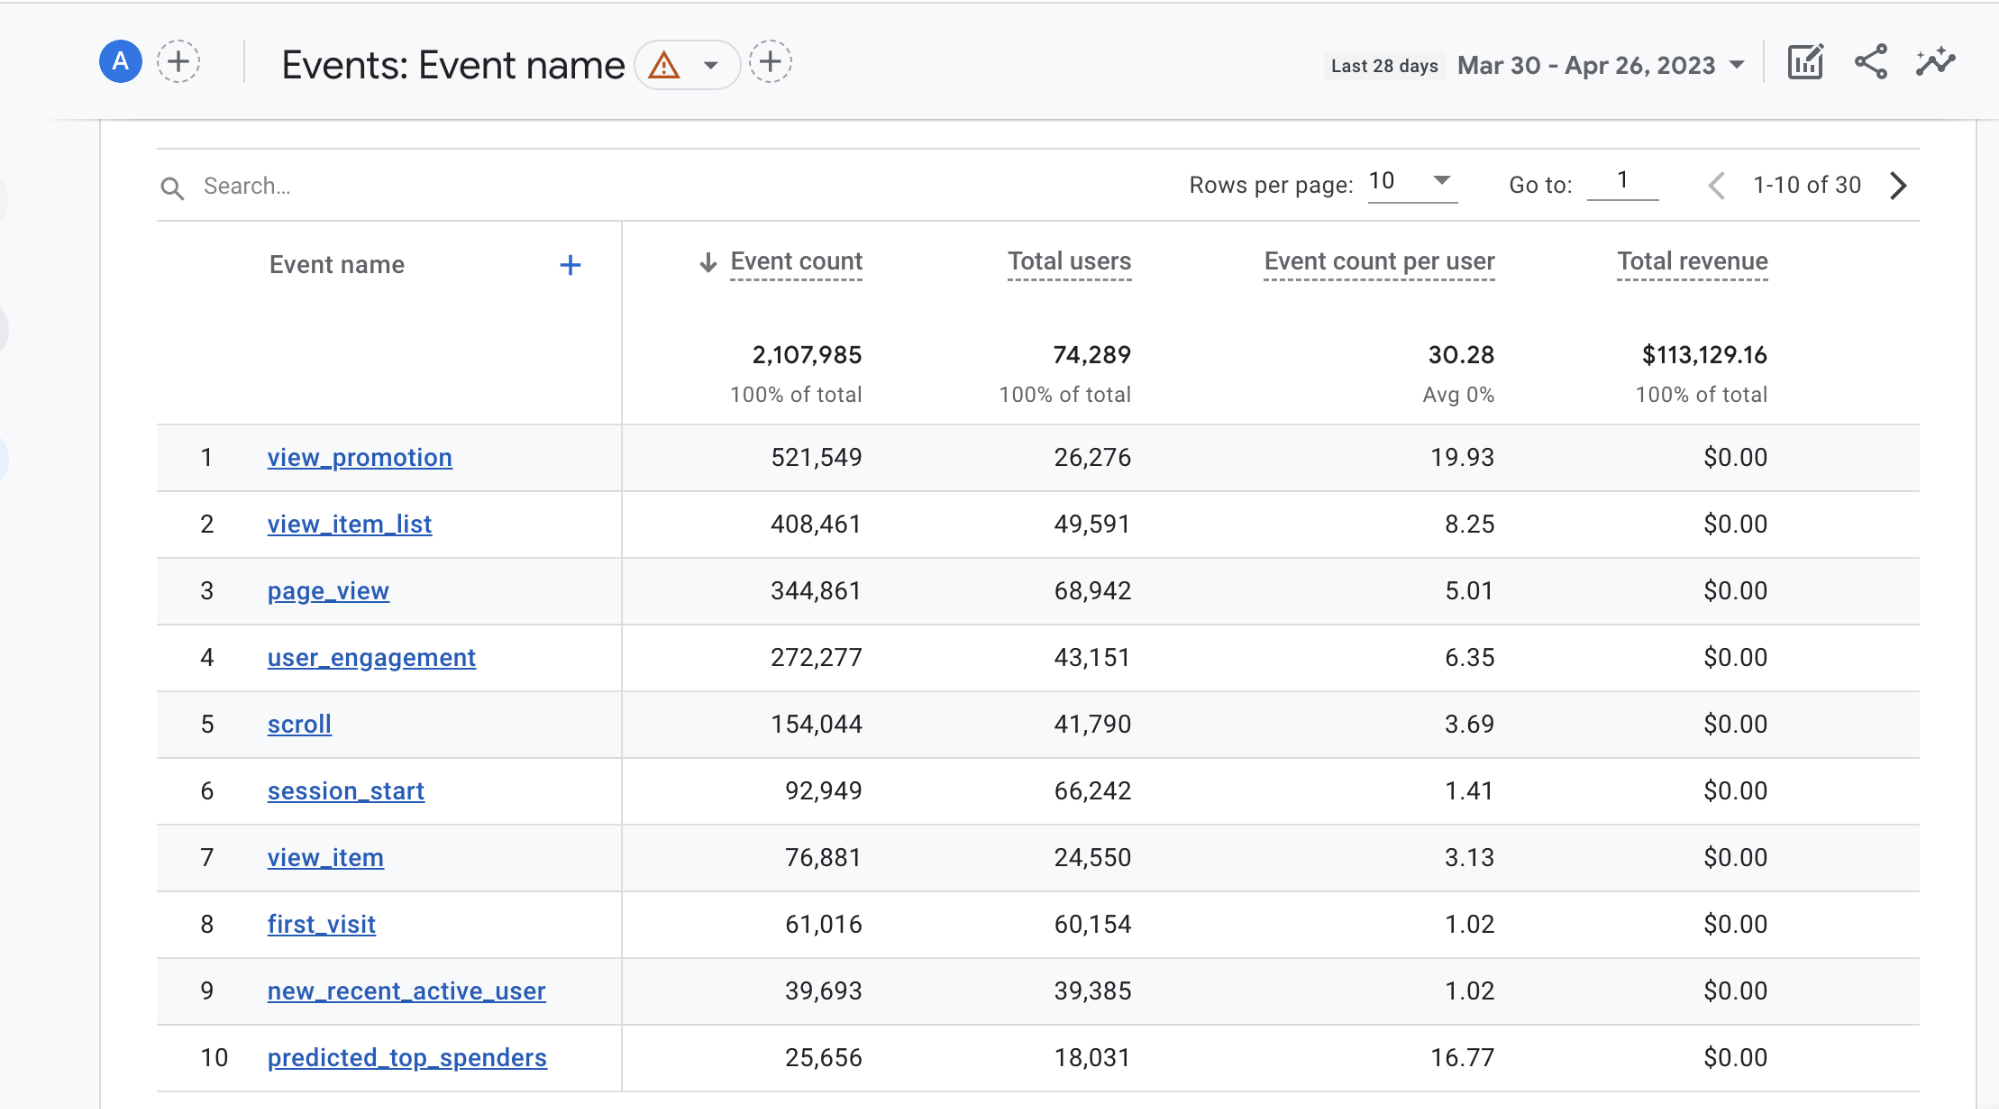
Events report:
This report summarizes how often you trigger events on your website or app. You can create events with the correct permissions or changed from a current event. With the events report, you’ll find out if visitors engage with your promotional banner, or how far they scroll down your site.
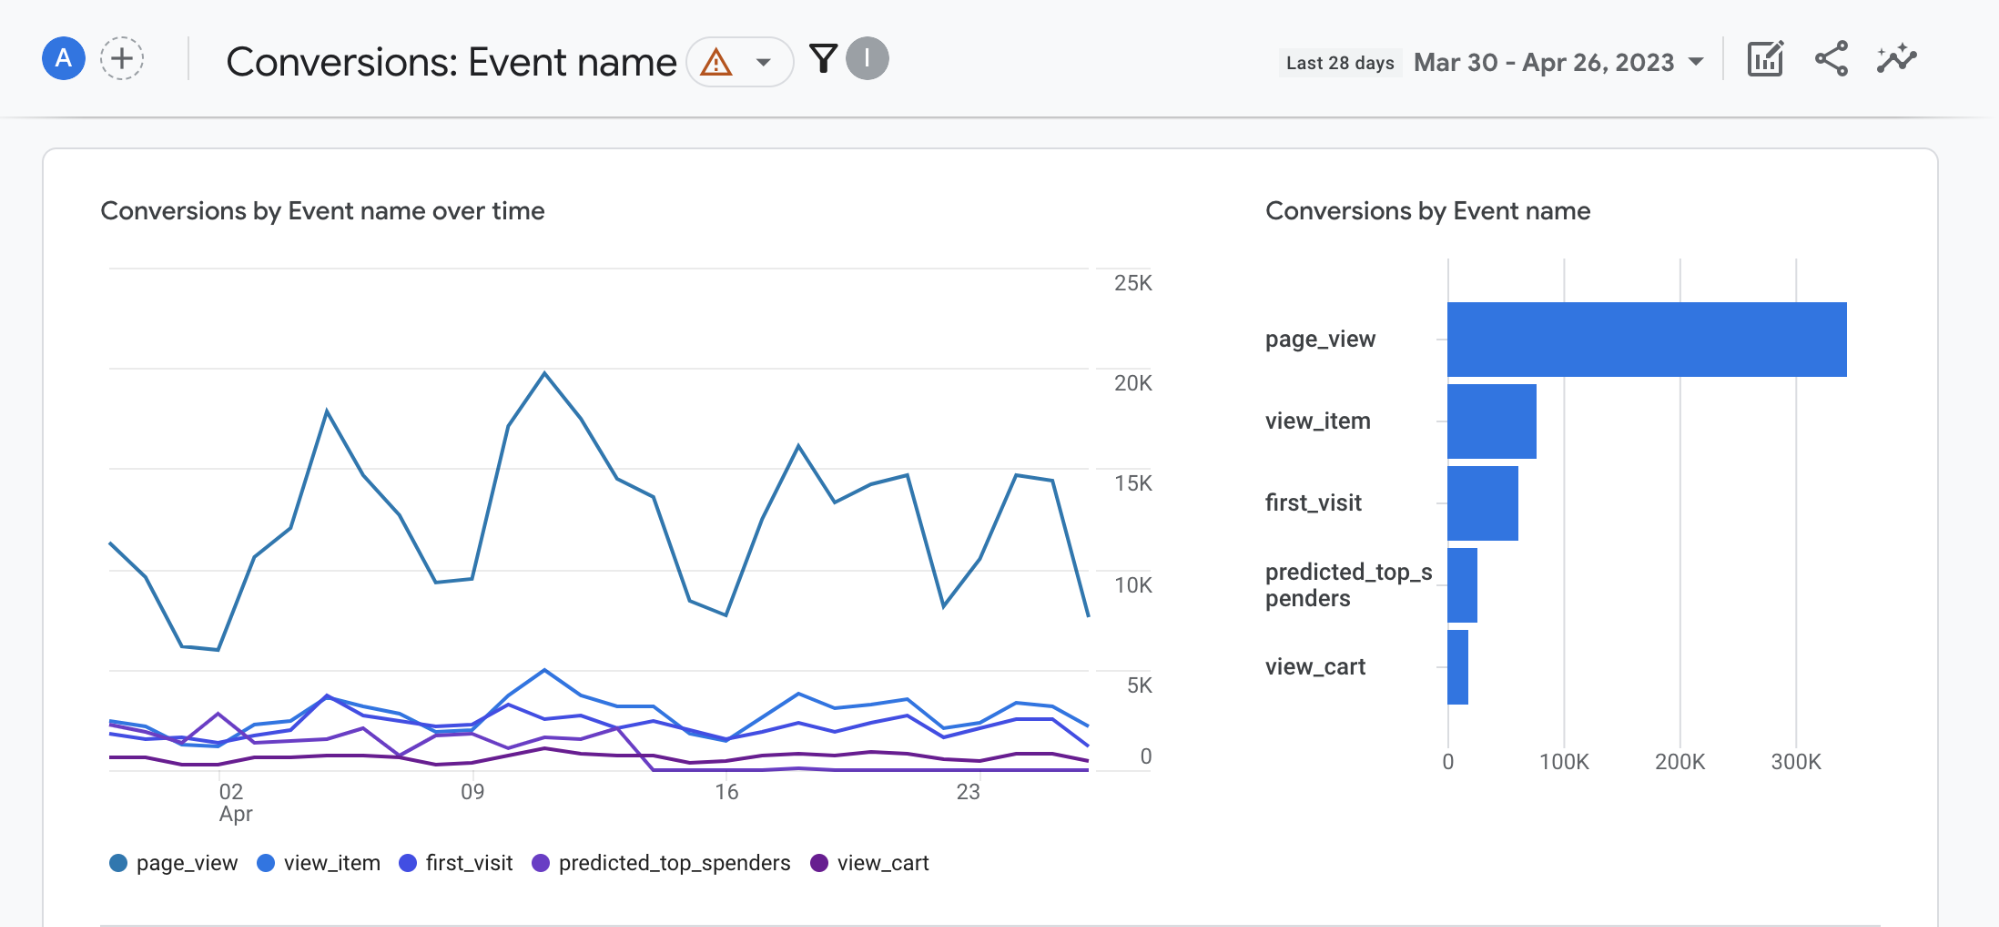
Conversion reports
Goals in Universal Analytics are now known as Conversions in GA4.
You can define your conversion event names specific to your business (like views on an order confirmation page). Especially helpful if you’re running a revenue or lead generation campaign to help you focus on the keywords or campaigns that drive the most results for your business.
Reports for e-commerce tracking
![]()
If you’re running an e-commerce business, GA4’s Monetization section has reports to help you track e-commerce purchases and how visitors interact with your shop. You also have the flexibility to add or remove custom dimensions, custom events, and metrics in the report with the proper permissions.
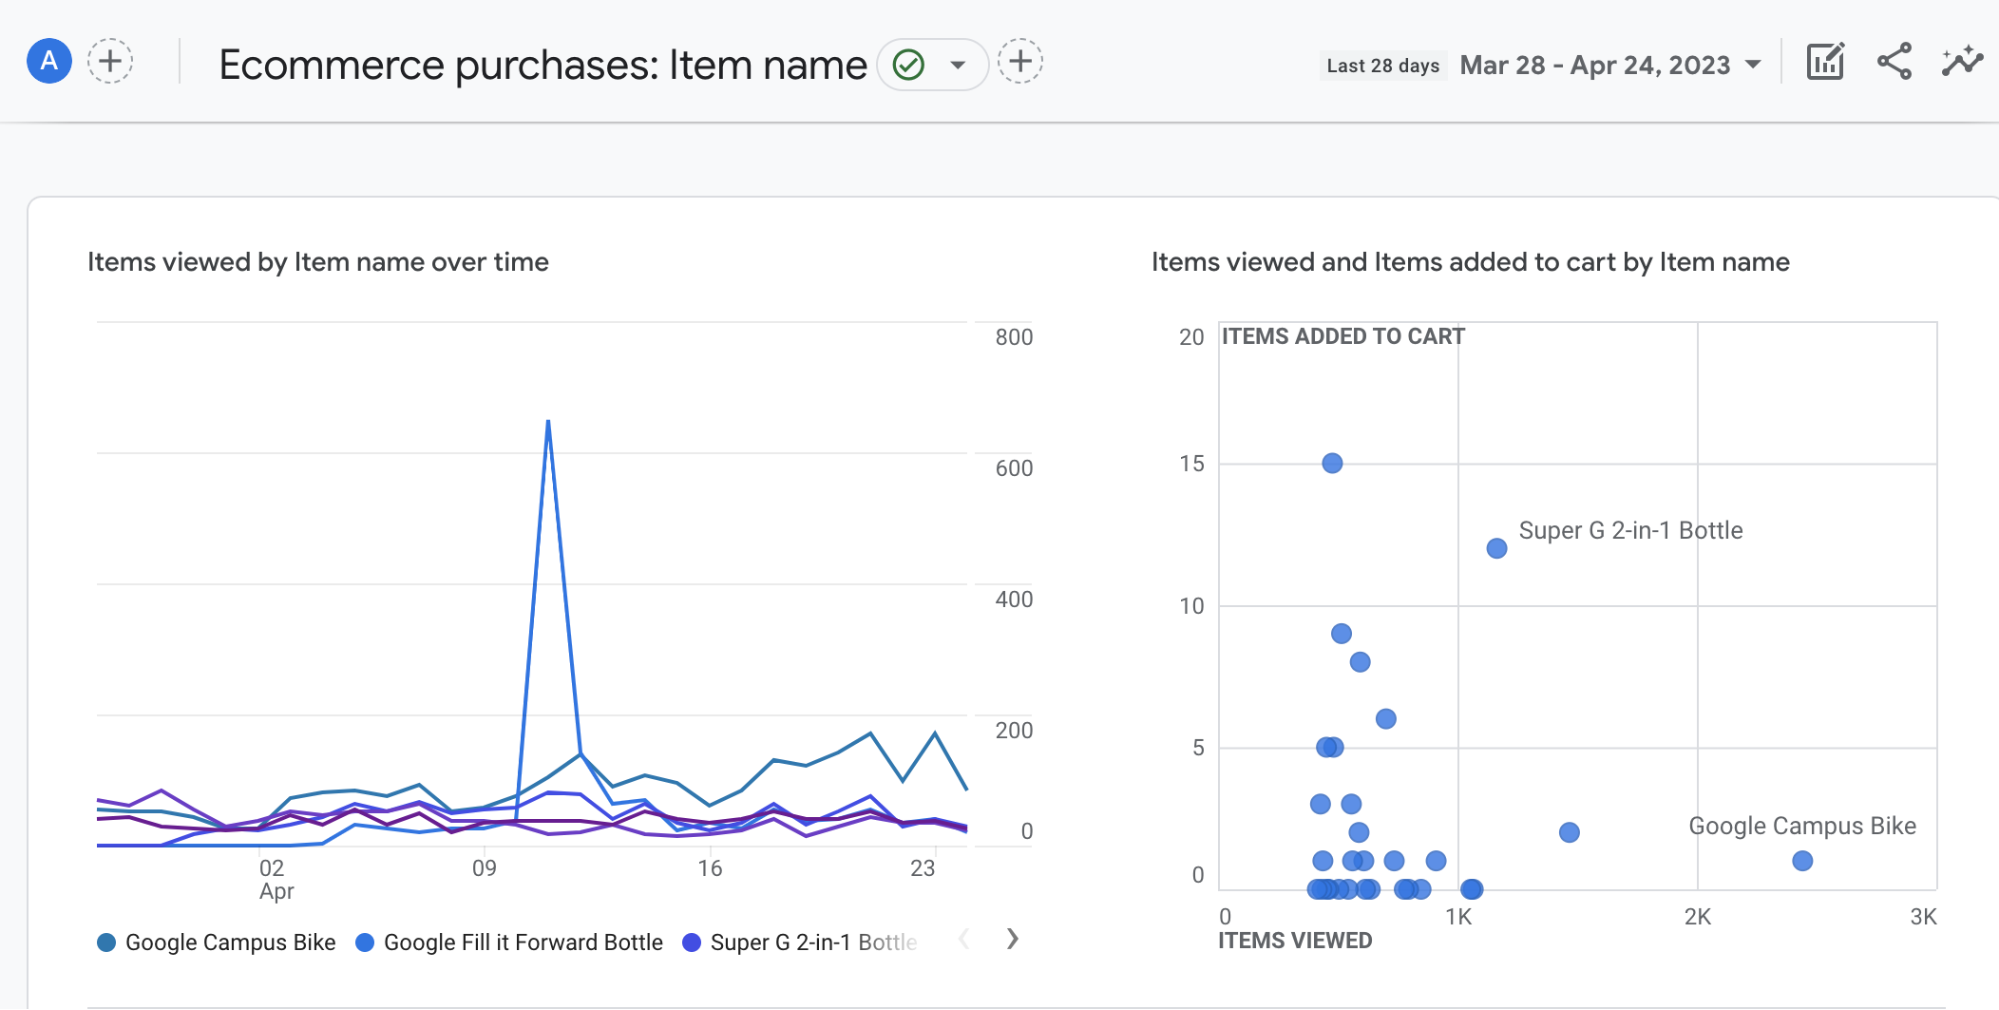
Combine these reports with filters to show the goals that matter the most to your business. You can even combine this report with acquisition data or use the Purchase Path funnel exploration to get more specific on the most effective revenue-generating activities or products.
Multichannel funnel reports
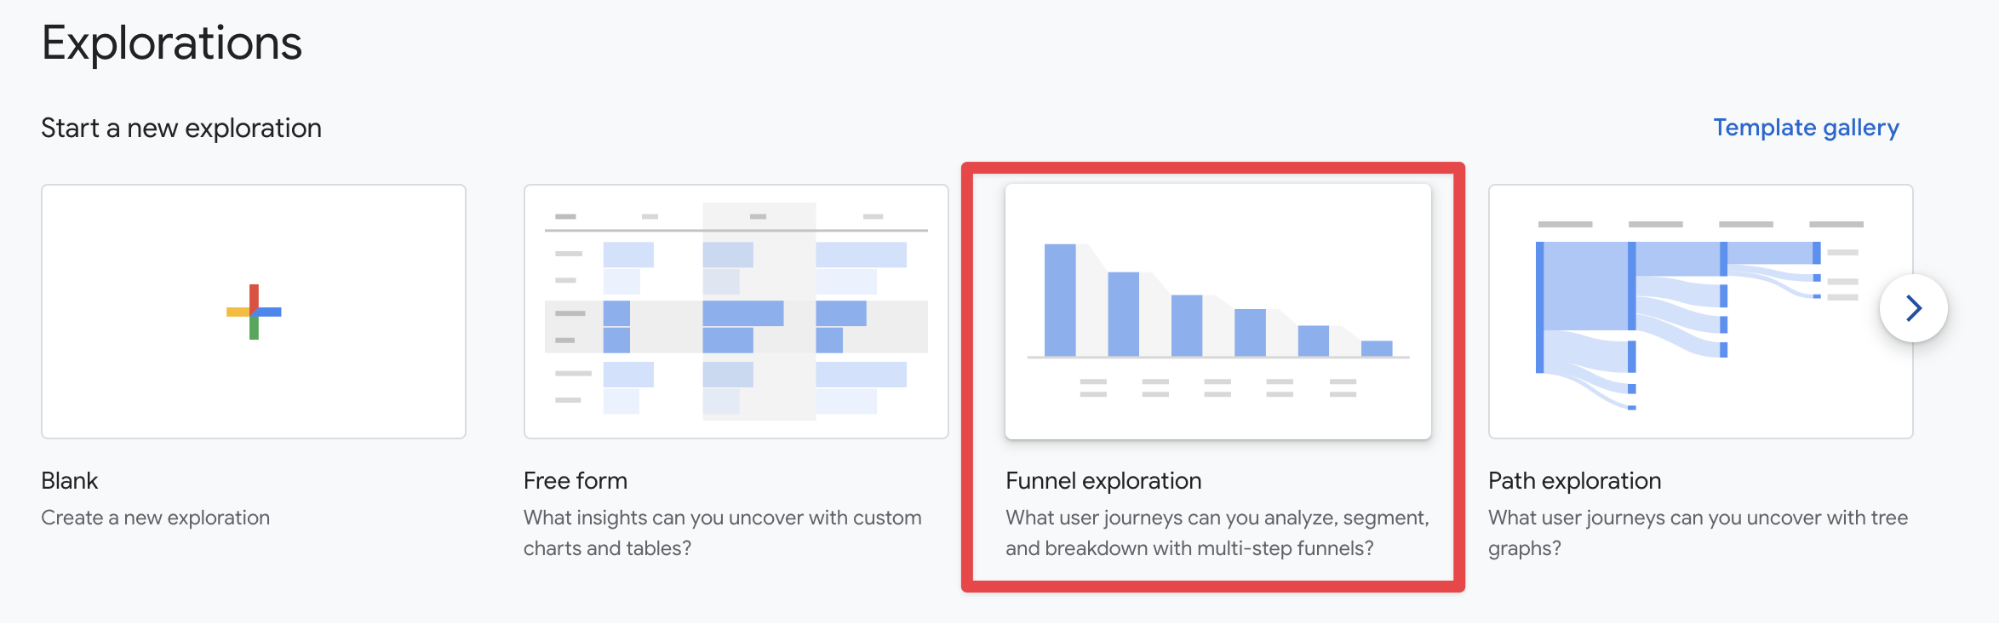
Multichannel funnel reports in UA are now done using the new Funnel exploration in GA4.
Visualize how users move through your website and app across multiple channels. How do visitors behave when they want to purchase a product? Where are they dropping off?
This report helps you answer these questions when trying to analyze a customer journey or identify opportunities for improvement.
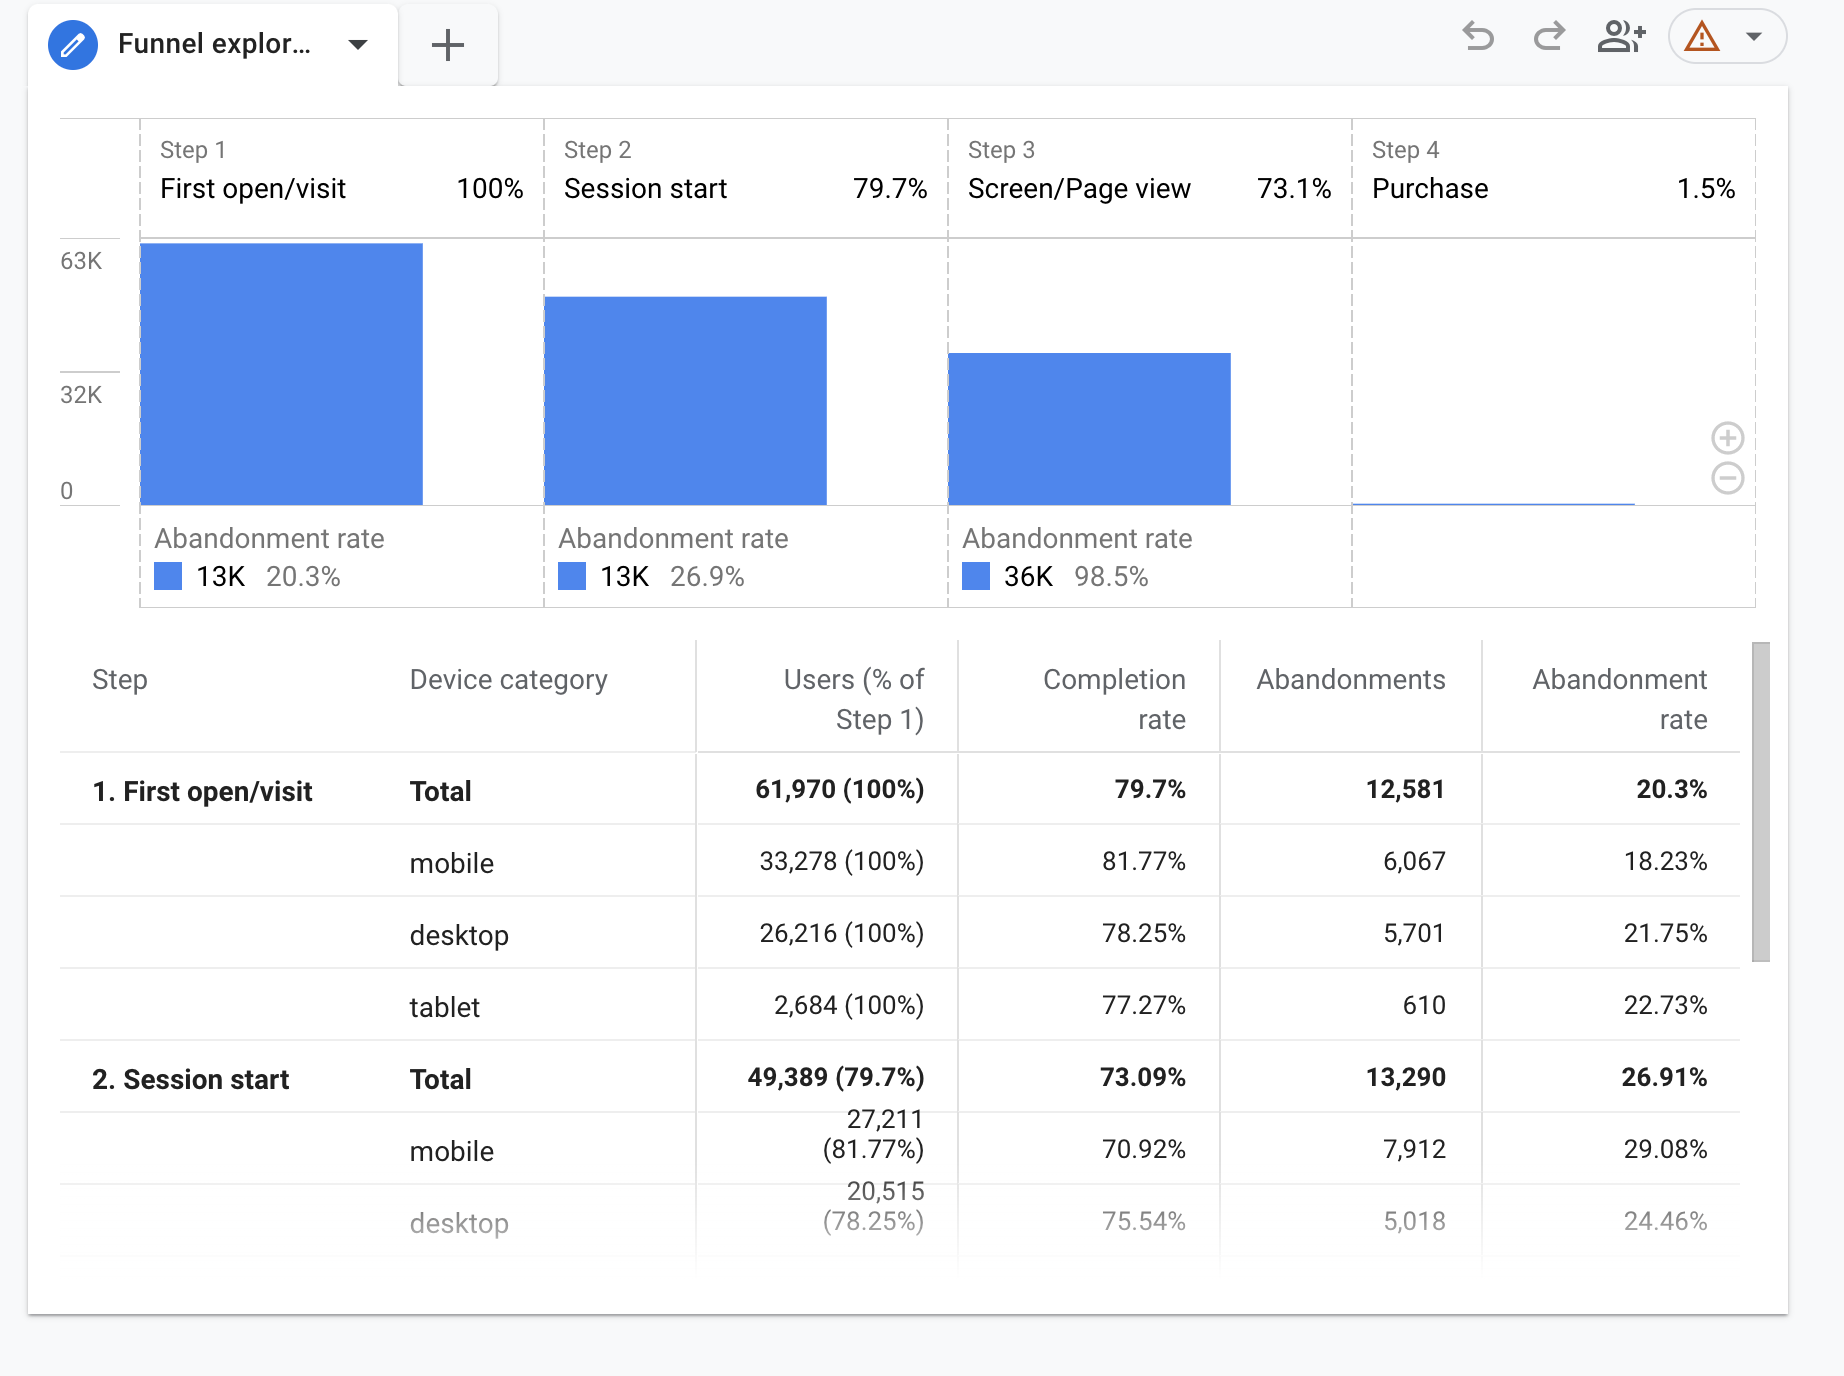
Funnel exploration report in GA4
How to customize reports in GA4
GA4 is a potent tool, and with admin permissions, you can customize reports to tailor them to your business needs.
What you can do:
- Change, remove or reorder metrics and charts
- Configure a filter to the report to help people who view the report to see a filtered version of the data
- Create a summary card to summarize info about a metric
Check out GA4’s step-by-step guide to customizing reports here.
5 essential GA4 reporting KPIs and metrics
Total users
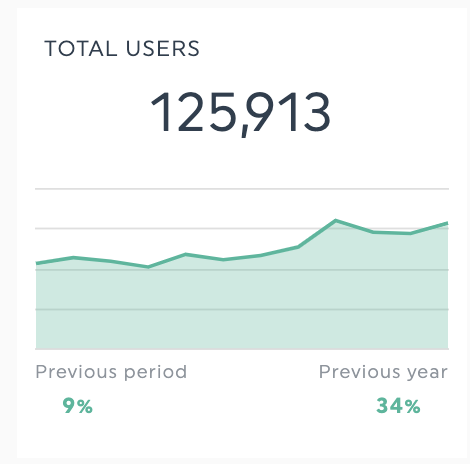
Total users in GA4 count the unique users who have logged an event under the Engagement report in GA4. Use this as a comparative metric to compare against Active Users (new in GA4) or Total Revenue (when reviewing your e-commerce store’s web analytics.
Pageviews
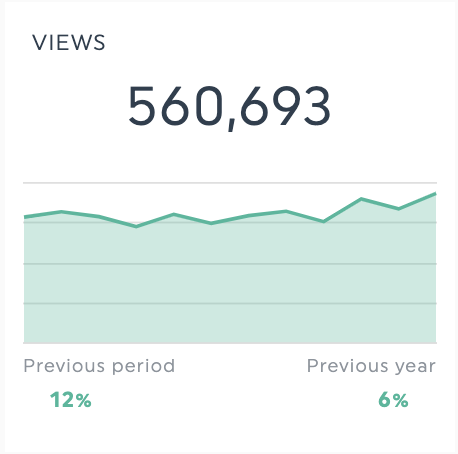
This measures how often people load a page of your website on their browsers. Page views are valuable for doing metric-to-metric comparisons as part of the Pages and Screens report in GA4.
For example:
- A landing page with a comparatively low conversion rate against a high page view count might indicate an issue
- Comparing page view count across demographic data or device data helps gather audience insights
- Tracking channel-specific page views over a date range can help monitor marketing campaign effectiveness
Conversions
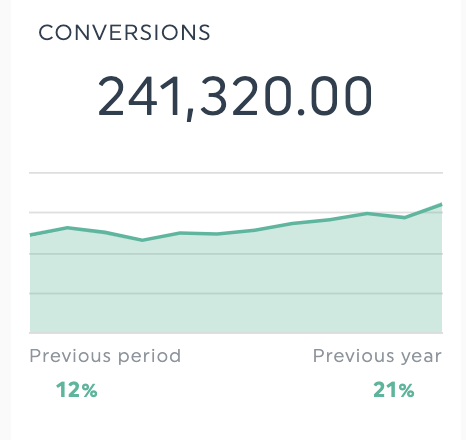
Conversions in GA4 show you how often a user triggered an event valuable to your business on your webpage.
For example, e-commerce shops might show add-to-cart or purchases as conversion behavior, whereas marketers might indicate a completed free trial form to be a conversion.
Event count
Event count reflects how often an event triggers on your website or app.
Remember, events in GA4 refers to specific actions like:
- Submitting a form for a conreferion call
- Clicking a button on a website to access a research study
- Playing a video describing your company’s story
By tracking events, you can gain insights into what your visitors and users find engaging and uncover opportunities for improvement if you’re looking to drive more conversions and engagement.
Average engagement time
When do users actively use your site or app? GA4 records engagement time as the time spent with either your:
- Webpage in focus (websites opened in a tab and not looked at don’t record engagement time
- Mobile app screen in the foreground (mobile apps running in the background don’t record engagement time)
There is a big difference between the way GA4 calculates engagement versus Universal Analytics, which didn't take focus into account and heavily inflated UA engagement metrics. In GA4, engagement time will be even more helpful in tracking top-performing pages and make content or user experience optimization decisions.
Elevate your GA4 reporting with DashThis
GA4 report template
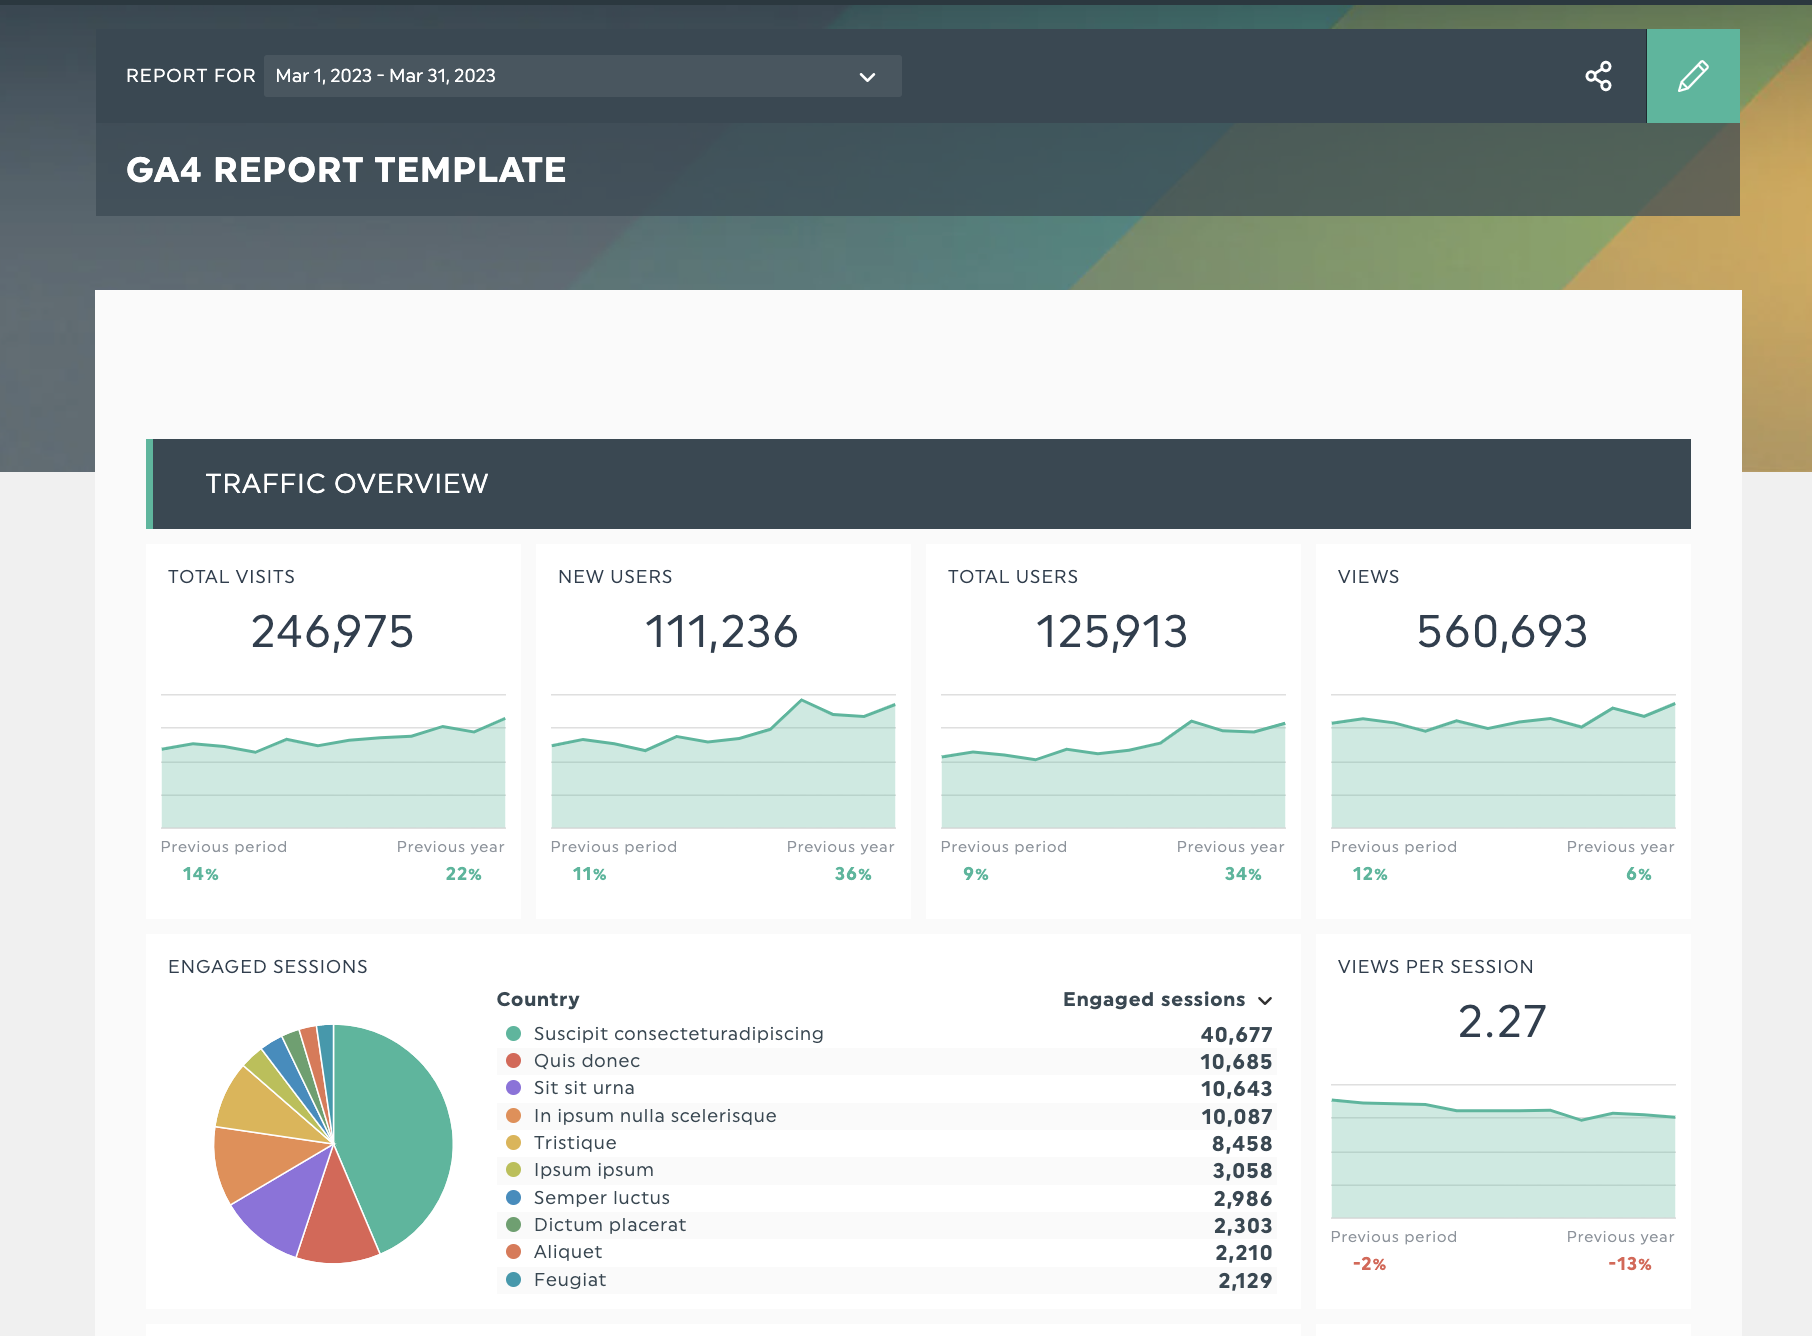
Get this Google Analytics 4 report with your own data!
GA4 introduces a ton of new metrics and analytical capabilities. Use a reporting platform like DashThis to help you gather these key metrics in a custom report to make it easy for your clients to understand. That’s why we’ve created a GA4 report template with the essential metrics included to help you save time on client reports.
Besides, GA4 data alone only gives you a piece of the analytical puzzle. Combine your GA4 data with your Google Ads data, SEO campaign reporting and social media metrics for a complete picture of all your marketing efforts, helping you show the impact and value your agency creates for your clients. DashThis integrates with 34+ digital marketing tools on the market, making it easy to have all your data in one platform.
Here’s how to do it with DashThis in 3 easy steps:
- Sign up for your 15-day free trial of DashThis
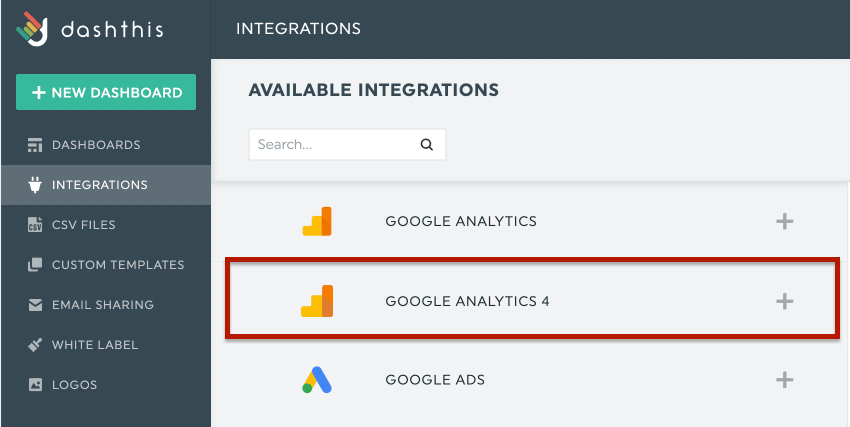
- Connect GA4 and your favorite marketing tools - here’s where to find our GA4 integration
- Select your metrics from DashThis’ preset widgets and DashThis will grab the relevant web analytics data
- Drag and drop the metrics as you desire to create a cohesive look in your report. Feel free to add/remove metrics, switch chart types around and customize your report as you see fit.
Sign up for your free 15-day trial of DashThis today.
Make the leap to GA4 reporting easy
We’re excited about GA4 and what it means to bring a more human touch to digital analytics. Its switch to a reporting style that better adapts to the complex, multi-channel journeys of web users and customers today bodes well for marketers in a constantly evolving digital landscape.
Tracking and reporting on GA4 data doesn’t need to be tough. Make the leap to GA4 reports easy with DashThis.

Start tracking your GA4 metrics
Read More

Don’t miss out!
Follow us on social media to stay tuned!
Automate your reports!
Bring all your marketing data into one automated report.
Try dashthis for free