TL;DR
- PPC reporting brings paid ad data from every channel into one place so you can prove performance and spot waste.
- The eight metrics most reports need are click-through rate, impressions, conversion rate, quality score, cost per click, return on ad spend, ad position, and keyword performance.
- Automated PPC reporting tools remove manual data pulls and let you schedule reports to send themselves.
- Free PPC report templates give you a proven structure so you can launch in minutes, not hours.
Your boss just asked you to send weekly reports for your highest-spend clients. You are new to the job, you are staring at three ad platforms, and you have questions.
- Do you really need to track this many metrics?
- Can you show every paid channel in one place without updating spreadsheets by hand?
- And if a tool is the answer, which one actually saves time?
This guide answers all of it. You will learn what PPC reporting is, the eight metrics worth tracking, how to build a report step by step, how often to send it, and where to grab free templates so you are not starting from a blank page.
What is PPC reporting?
PPC reporting is the process of collecting, organizing, and presenting pay-per-click advertising data, such as clicks, conversions, cost, and return on ad spend, so you can measure campaign performance and make decisions.
A PPC report pulls metrics from platforms like Google Ads, Microsoft Bing Ads, Facebook Ads, and LinkedIn Ads into a single view, usually a dashboard, that you share with clients or stakeholders.
In short: it is how you turn raw paid search and paid social data into a story about what is working, what is not, and what you will do next.
Why does PPC reporting matter?
Paid advertising is the fastest way to spend a lot of money with very little to show for it if you are not watching the numbers. Regular reporting is what keeps spend accountable. Here is why it earns a place in your weekly routine.
It keeps clients in the loop (and builds trust)
A lack of transparency is one of the biggest reasons clients leave agencies. Sharing a clear report on a regular cadence shows you are actively working toward their goals, and it gives you a built-in moment to explain your strategy. If cost per acquisition climbs, you can show it, explain how it affects profit, and lay out your plan to bring it down before the client has to ask. For more on this, see why client reporting matters.
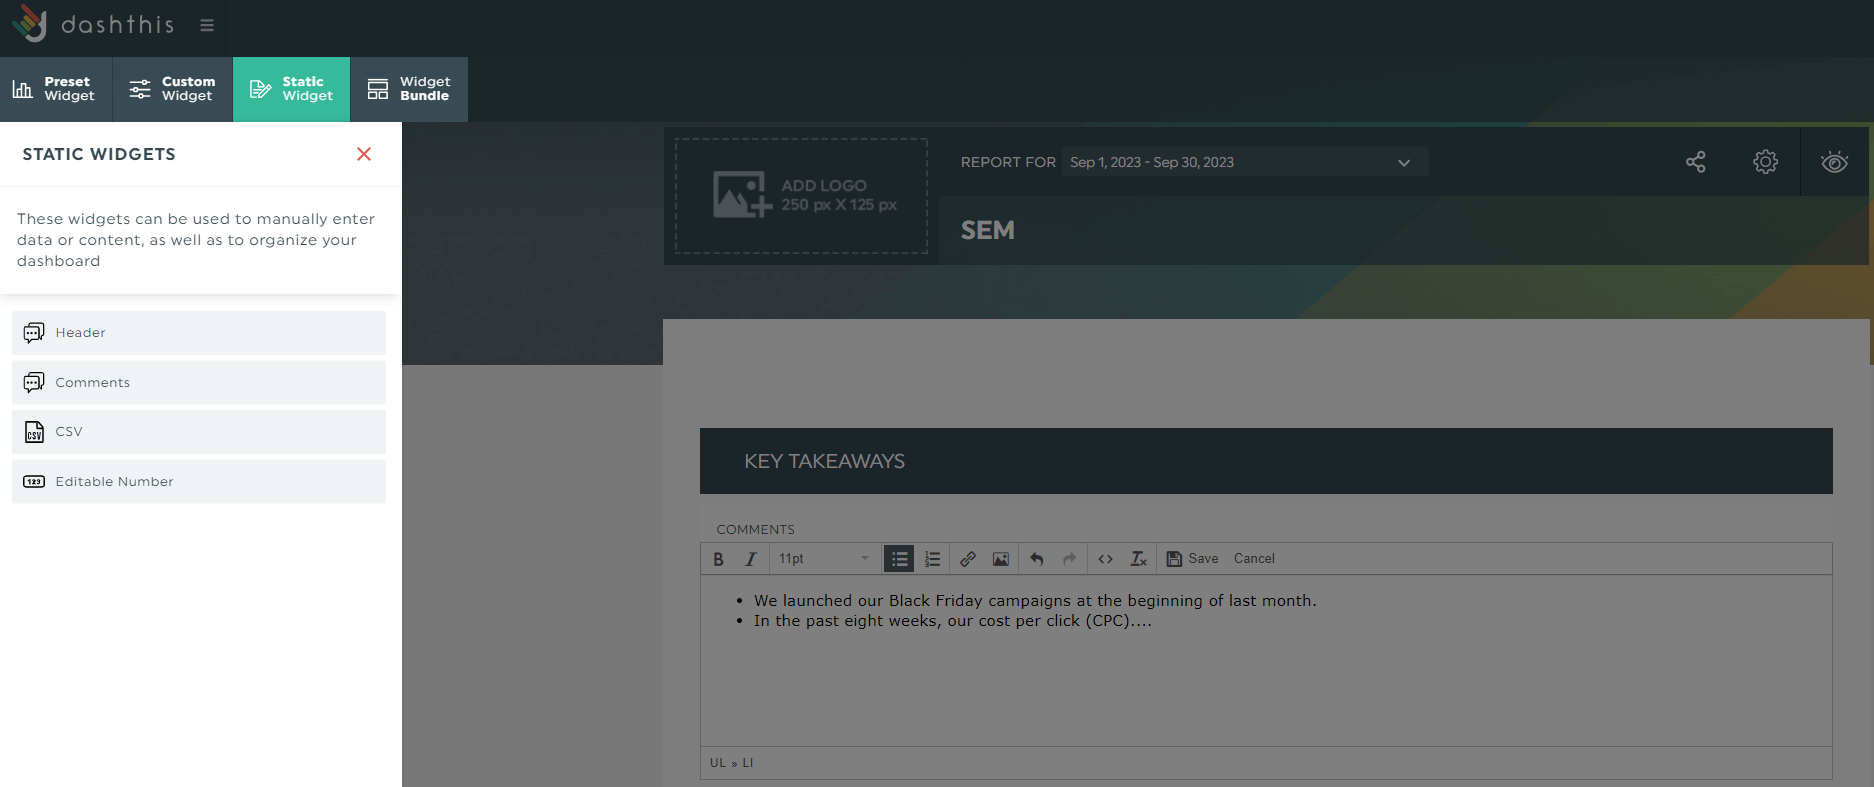
You can easily explain your strategies on a PPC reporting software like DashThis.
Click Static Widgets > Comments to add a comment box within the PPC report. Share what you’ve learned in bullet points and drag and drop the box to the top.
It replaces gut feeling with data
Plenty of teams still make decisions on instinct, and instinct does not scale. A good report turns guesswork into evidence.
- Which channels bring in quality leads?
- Which landing pages need work?
- Should the next awareness push go to one platform or another?
Your PPC metrics already hold the answer. You just need them in one place where the pattern is obvious.
It shows you your real ROI
If you are bidding in a crowded market where everyone is trying to outspend each other, the last thing you want is to keep funding a strategy that is not paying off.
When a dashboard stacks ad spend against revenue, a weak return jumps out immediately and tells you to reallocate budget. Without reporting, you would not know when to adjust.
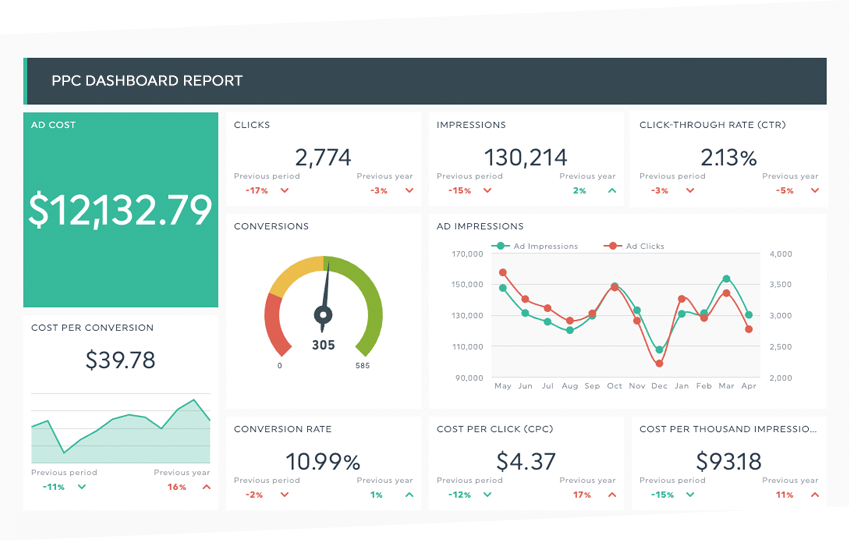
What metrics should a PPC report include?
Measuring the right KPIs and PPC metrics moves your campaign goal forward.
But which metrics should you focus on when there are dozens of them?
While it’s impossible to personally recommend the best PPC metrics without knowing your goal, we learned a comprehensively good PPC report tends to include the following.
| Metric |
What it measures |
Quick formula |
| Click-through rate (CTR) |
Share of viewers who click your ad |
Clicks ÷ Impressions |
| Impressions |
How many times your ad was shown |
Total ad displays |
| Conversion rate (CVR) |
Share of visitors who complete an action |
Conversions ÷ Visitors |
| Quality score |
Google's 1–10 rating of ad and landing-page quality |
Diagnostic, set by Google |
| Cost per click (CPC) |
What you pay for each click |
Spend ÷ Clicks |
| Return on ad spend (ROAS) |
Revenue earned per ad dollar |
Revenue ÷ Ad spend |
| Ad position metrics |
Where your ad shows vs. organic results |
Impression (Abs. Top) % and Impression (Top) % |
| Keyword performance |
How individual keywords and ad groups perform |
Status, CTR, and quality score by keyword |
Click-through rate
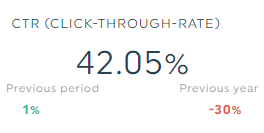
Click-through rate (CTR) is the percentage of clicks your ad receives from all users who see it.
Improve your messaging to bump up this metric. When ActiveCampaign swapped to educational ads instead of the standard promotional ads on LinkedIn, it achieved a 5-10% CTR.
Impressions
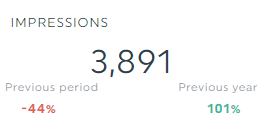
Impressions are the number of times an ad is shown. Measure this metric to gauge your potential ad reach.
Conversion rate
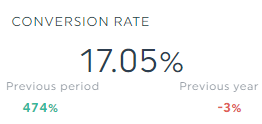
Conversion rate (CVR) is the percentage of searchers who completed an action measured against the total number of visitors.
There are multiple ways to increase this metric, like retargeting. Impactable, a B2B LinkedIn ads agency, increased its conversion rate by 10% in only six months after narrowing down its audience to specific segments (e.g., seniority level, industry).
Quality score
Quality Score is a diagnostic tool that stacks up your ad quality against other advertisers on a scale from 1 to 10.
A healthy ads performance sits between 7 and 10.
Cost per click (CPC)
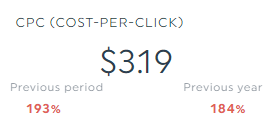
Cost per click (CPC) is the price you pay for each ad click.
This metric is often confused with cost per conversion, which tracks the amount you pay for each completed action (e.g., completed a demo form). Another relevant metric is cost per acquisition (CPA), which tracks the cost for each acquired customer.
Return on ad spend
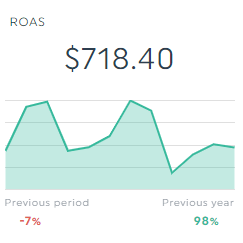
Return on ad spend (ROAS), a popular metric in eCommerce, tracks the revenue you get back for each dollar spent on advertising.
Ad position
Ad position is a defunct metric replaced by two new metrics:
- Impression (Absolute Top) % - percentage of impressions for your first ad above the organic search results
- Impression (Top) % - percentage of impressions for your ad anywhere above the organic search results
Track these two metrics to get a clearer picture of your ad position as a whole.
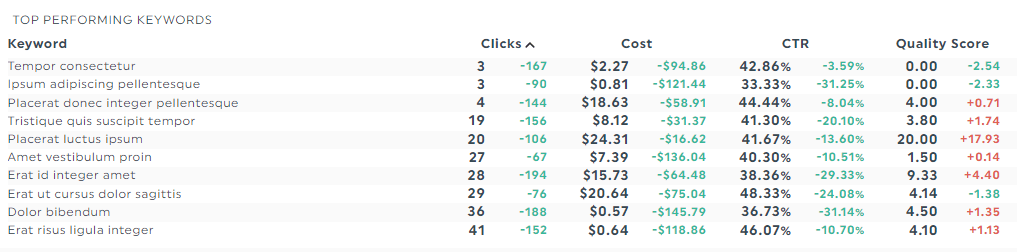
Keyword performance
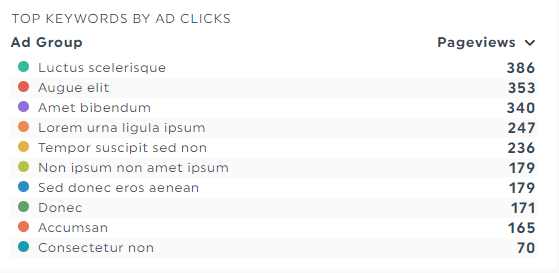
Keyword performance isn’t exactly a standalone metric.
Rather, it's a snapshot on Google Ads that shows keyword status, click-through rate, and quality score.
What are the different types of PPC reports?
Not every report serves the same purpose. The four most common are:
- Performance report: the weekly or monthly standard covering the core metrics above across all live campaigns.
- PPC client report: a clean, often white-label version focused on outcomes and the story behind them, built for a non-technical audience.
- PPC audit report: a one-time deep dive into account structure, wasted spend, and quick wins, usually run before taking on a new account.
- Cross-channel report: one view that combines Google Ads, Microsoft Bing Ads, and paid social so you can compare channels fairly.
Most teams run a recurring performance or client report and layer in an audit when they inherit an account.
How do you create a PPC report?
You can build a report by hand in a spreadsheet, but it is slow and breaks every time a platform changes its export. A faster path is an automated PPC reporting tool that connects to your ad accounts and refreshes the data for you. Here is the process with DashThis, the easiest reporting tool to get started with.
-
Pick a template
Start from one of 40+ free report templates instead of a blank canvas. A ready-made PPC report template gives you a proven layout in seconds.
-
Connect your ad accounts
DashThis offers 30+ integrations, including Google Ads, Google Analytics, Facebook Ads, and Microsoft Bing Ads, so your data flows in automatically. You can also pull in Google Analytics reports for the on-site side of the funnel.
-
Select your metrics
Choose your PPC metrics from Preset Widgets and they appear on the canvas. Drag and drop to group related metrics. To show the ROI of a campaign, for example, place CTR, CPC, and cost per acquisition next to each other.
-
Add context
Drop in a comment box to explain wins, losses, and next steps so the report tells a story rather than just listing numbers. If you want a deeper framework, see how to create the perfect KPI report.
-
Share or schedule it
Open Sharing Options, choose Share by Email, set your frequency, and the report sends itself on your schedule. No more manual updates.
The whole thing takes a few minutes, and once it is built you save it as a custom report and reuse it forever. Looking for layout ideas? Browse these data visualization dashboard examples.
How often should you send PPC reports?
Match the cadence to spend and to how fast the account changes. As a rule of thumb:
- Weekly: high-spend accounts, active tests, or new campaigns that need close monitoring. See our take on weekly reports.
- Bi-weekly: steady accounts where you want a regular check-in without the noise of daily swings.
- Monthly: the default for client-facing summaries and budget reviews.
Whatever you choose, keep it consistent. A predictable rhythm is part of what builds client trust.
Free PPC report templates
Google Ads PPC report template
Uncover your top-performing marketing campaigns across App, Display, Performance Max, etc. with this PPC ads dashboard.

Grab this PPC advertising report with your own data!
All-in-one advertising campaign report template
Running a PPC marketing strategy across Facebook, Google, and LinkedIn for a B2B client? This complete advertising dashboard got you covered.
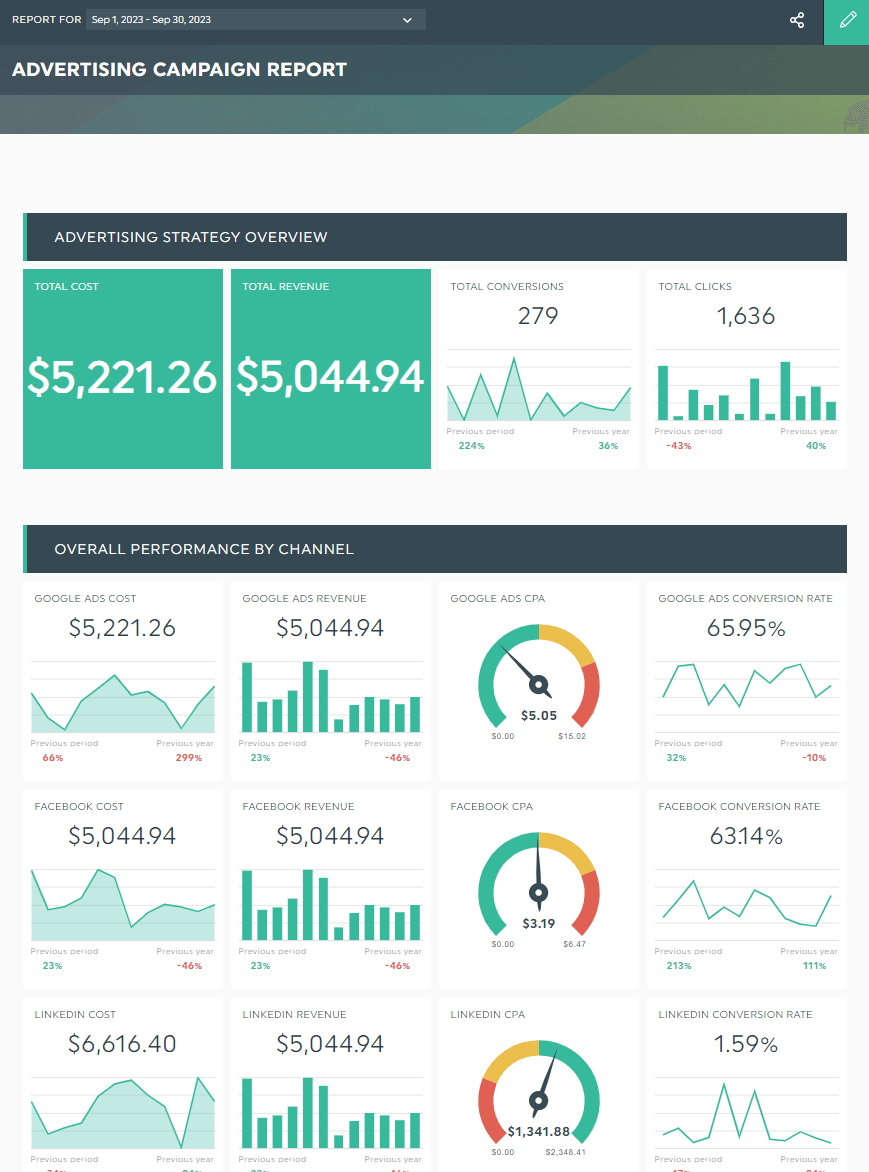
Grab this advertising campaign report with your own data!
Digital marketing report template
Inbound and outbound marketing channels work in tandem. Track your SEO efforts and PPC campaigns in one place using this free dashboard.
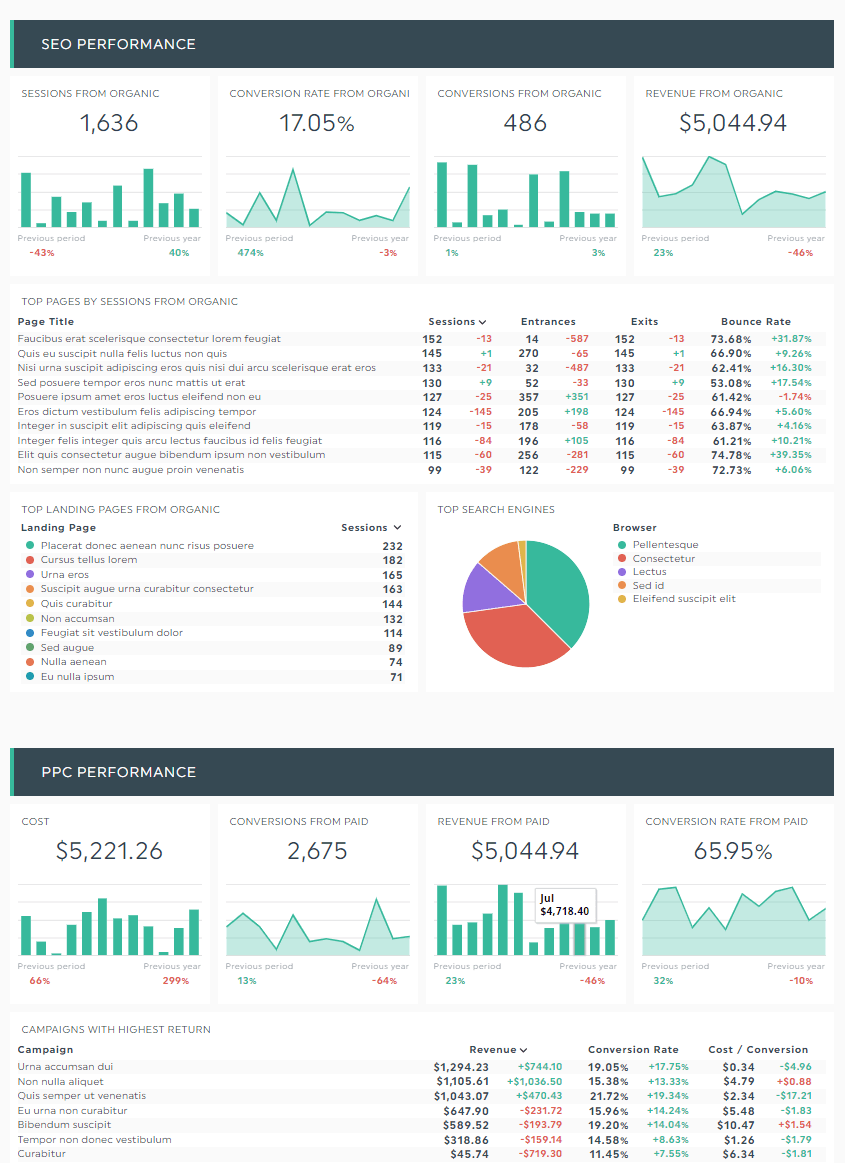
Grab this digital marketing report with your own data!
Common PPC reporting mistakes to avoid
- Reporting vanity metrics. Impressions and clicks feel good but mean little without conversions and ROAS attached.
- No context. Numbers without a short narrative leave clients guessing. Always explain the "so what."
- Inconsistent timing. Skipping weeks erodes trust faster than a bad week of results.
- Manual data pulls. They eat hours and invite copy-paste errors. Automate the data so you spend your time on analysis.
- One metric, one channel. Judging the whole account on a single platform or KPI hides the real story.
Frequently asked questions
What is PPC reporting?
PPC reporting is the process of collecting and presenting pay-per-click data, such as clicks, conversions, cost, and ROAS, from platforms like Google Ads and Facebook Ads into one view so you can measure performance and make decisions.
What metrics should be in a PPC report?
The core set is click-through rate, impressions, conversion rate, quality score, cost per click, return on ad spend, ad position metrics, and keyword performance. Add channel-specific metrics based on your campaign goal.
What is the best PPC reporting tool?
The best tool connects to all your ad platforms, automates data collection, and lets you schedule reports. DashThis does this with 30+ integrations and 40+ templates, which is why it is a popular pick for agencies and in-house teams.
Are there free PPC reporting tools?
Yes. Many platforms offer free or trial tiers, and DashThis offers a free 15-day trial plus 40+ free report templates so you can build and send a full PPC report before paying anything.
How often should I send a PPC report?
Weekly for high-spend or fast-changing accounts, monthly for client summaries and budget reviews. The most important thing is to keep the cadence consistent.
What is a PPC audit report?
A PPC audit report is a one-time, in-depth review of an ad account that flags wasted spend, structural issues, and quick wins. Agencies often run one before taking over a new account.
Automate your PPC reporting today
By tracking the right PPC metrics, you gain a step closer to hitting your goals while keeping your ad dollars down.
This guide recommends the eight most commonly used metrics in PPC ads today. Use them as a starting point, along with a reporting tool to automate the process.
DashThis is the easiest reporting tool. With over 30 integrations, it automatically gathers your entire PPC data across multiple ad platforms into one beautiful report. Pricing starts at $44/month when billed annually. Sign up for your free 15-day trial on DashThis today.
 The Team at DashThis
DashThis is the power behind thousands of reporting dashboards created by and delivered for agencies and digital marketers every month.


