How to Improve UX Design by Looking at Google Analytics Metrics

Any first-time marketer will agree with this:
Google Analytics is a rabbit hole of data, and it can get absurdly overwhelming trying to track your entire funnel with a gazillion metrics all over the place.
Let’s stop this once and for all.
In this guide, you’ll learn the most important metrics to measure your marketing efforts on GA and how to track them as quickly (and painlessly) as possible.
- What are Google Analytics Metrics?
- How to Track Google Analytics Metrics?
- Top Google Analytics Metrics to Track
- - Pageviews
- - Average Session Duration
- - Bounce Rate
- - Unique vs. Returning Visitors
- - Traffic Sources
- - Top Pages
- - Conversion Rate
- - Cost per Acquisition
- Automate it!
What are Google Analytics Metrics?
Google Analytics metrics are data points that track your website performance and optimize your overall digital marketing strategy.
You can measure your entire funnel on Google Analytics.
For example, an ecommerce marketer might analyze the user data (i.e., demographics, mobile devices used) to segment audiences for a remarketing campaign (awareness) or build a reverse goal path funnel to reverse engineer hidden sales opportunities (conversion).
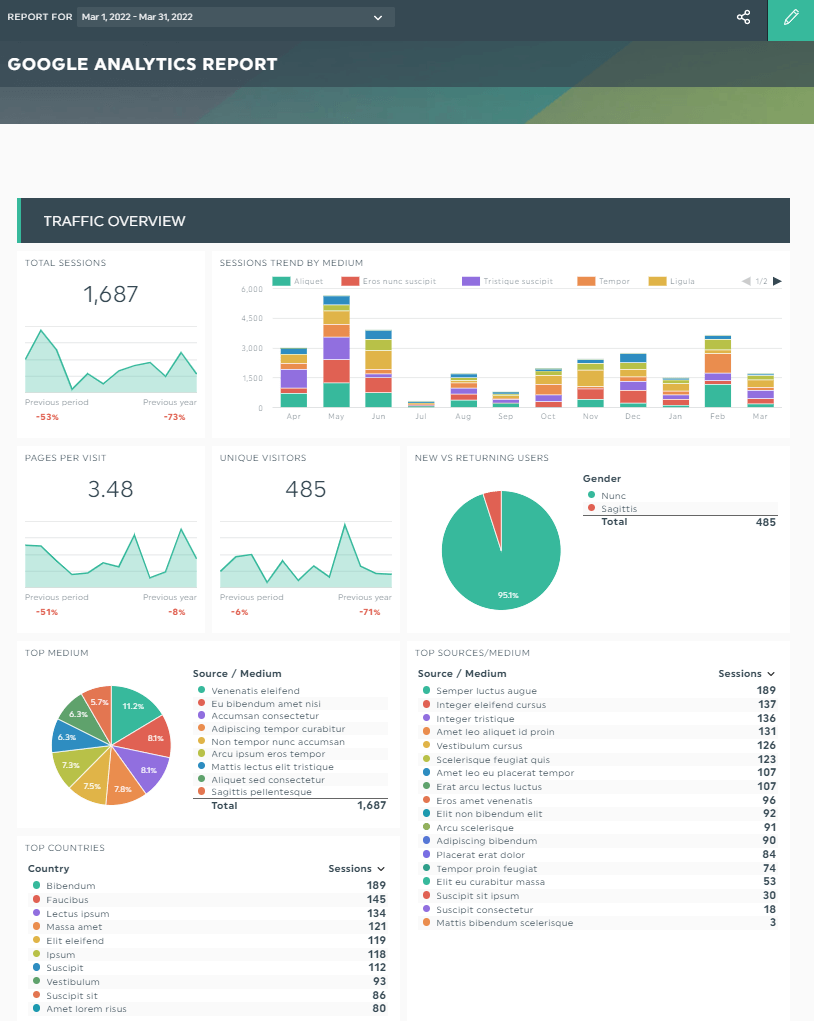
Here’s an SEO report to show you what we mean. Note how the dashboard below gathers metrics from different sources (Google Analytics, search engine, SEO tool) and turns them into eye-catching graphics for every stage in the marketing funnel.
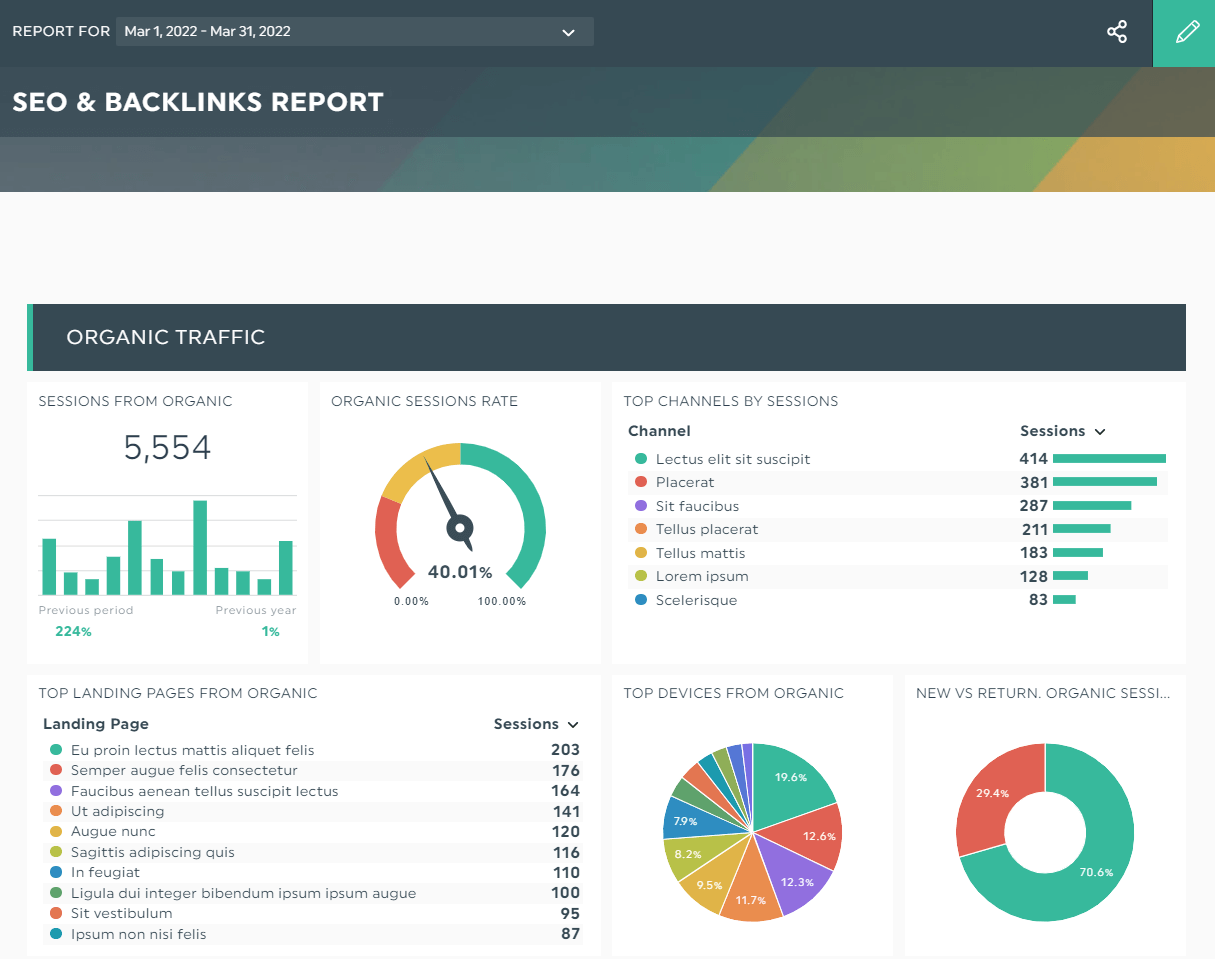
Grab this SEO report with your own data!
This SEO report comes in handy if you want to improve your SEO strategy without any guesswork.
Using the landing pages' steady flow of organic traffic above as an example, you might set or increase your monthly ad spend for the best-performing page to attract more leads.
How to Track Google Analytics Metrics?
With the sheer number of metrics on Google Analytics, it’s challenging to keep track of your marketing campaign and website traffic accurately.
And that’s just for one site! Imagine tracking these data sets across multiple channels for dozens of clients. As if maintaining the no.1 spot on organic search wasn’t hard enough…
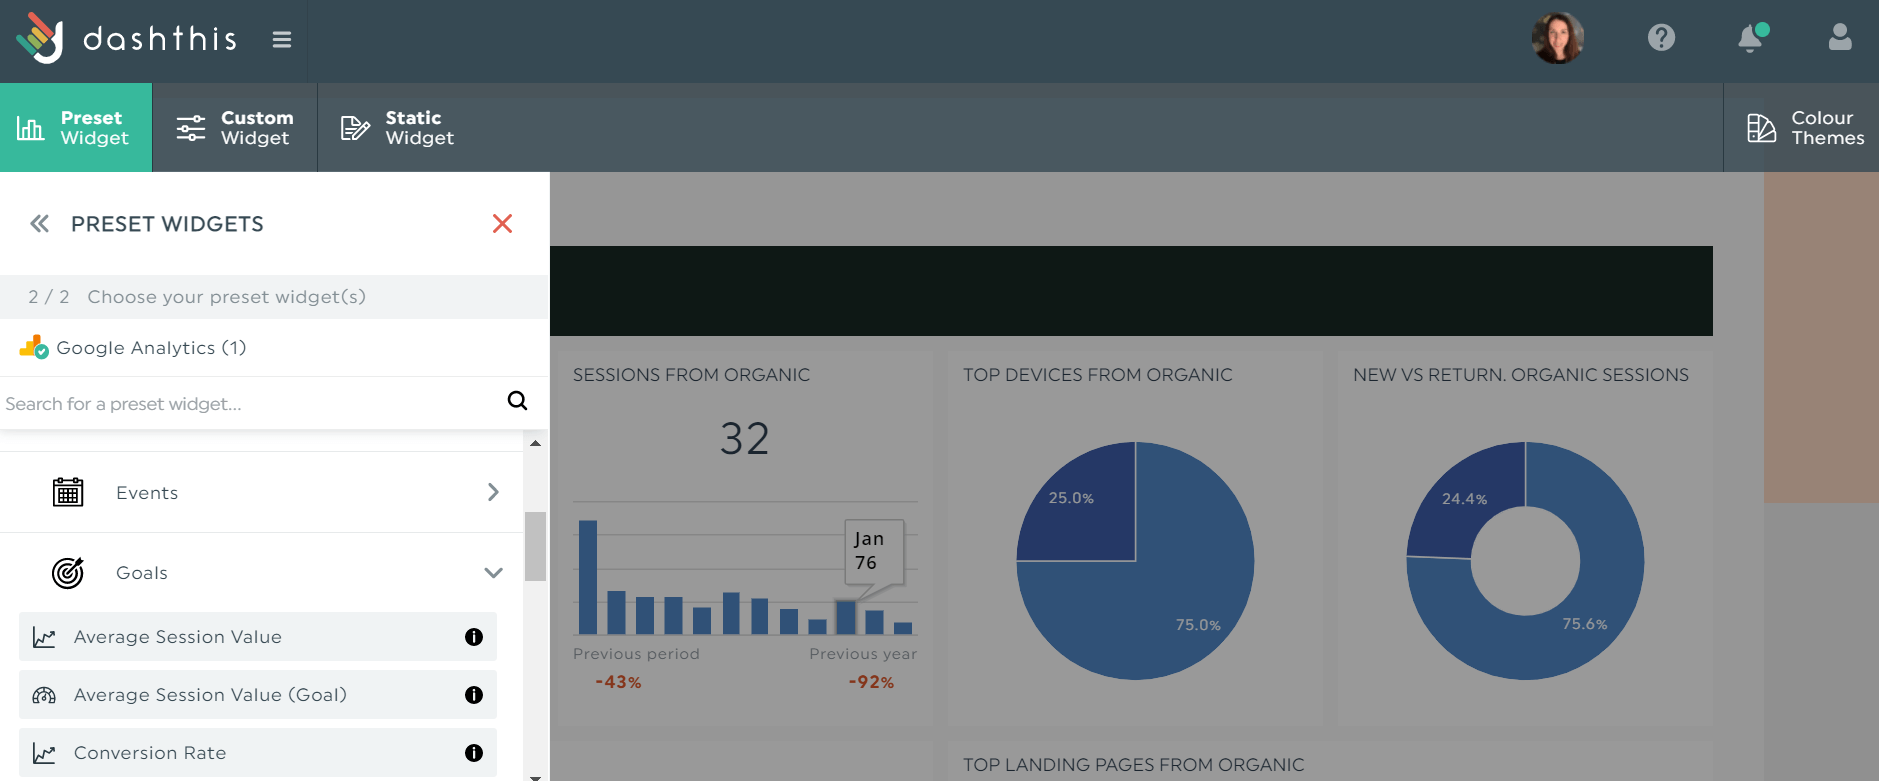
Automated reporting tools like DashThis are useful in this situation. DashThis removes the hassle of jumping through multiple hoops to gather essential data. To get started right away:
- Connect your Google Analytics account
- Select your metrics from Preset Widgets
- Drag and drop the Google Analytics metrics as you desire
All metrics on analytics reports are fully customizable on DashThis. Not only can you drag and drop them to your desired location, but you can also edit the way your data is displayed and merge them with other metrics for more context.
It’s also possible to create multi-channel reports. Need to create an attractive SEO + social media + email marketing dashboard? You can whip one up with a few quick clicks on DashThis.
Pricing starts at $39/month. Grab your free 15-day trial of DashThis to automate your reporting for Google Analytics and other marketing channels today.
Top Google Analytics Metrics to Track
Pageviews
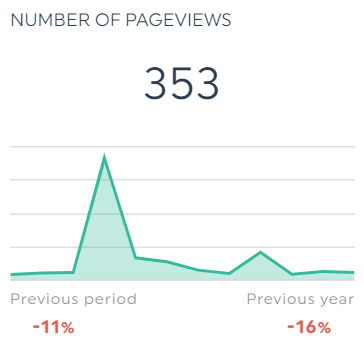
Pageviews refers to the total number of page views (including multiple views of individual pages). Measure this Google Analytics metric to assess how engaging your site content is.
Average Session Duration
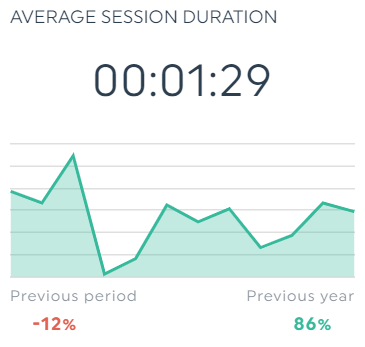
Avg session duration measures the average length of sessions on a website.
Similarly, this metric helps gauge if your content strikes a chord with readers. Average session duration is frequently confused with average time on page, which measures the average amount of time users spend on single-page sessions.
Bounce Rate
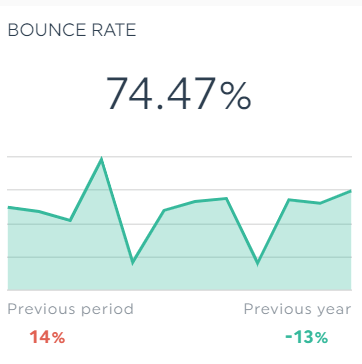
Bounce rate refers to the percentage of web visitors who left the first page of your site without taking any action (note: not to be confused with exit rate, which refers to the percentage of visitors who left the last page [a.k.a. exit pages] of the site).
Watch out for high bounce rates and low conversions. It usually indicates poor user experience, a disconnect between your content and the searcher’s intent, slow loading, etc.
Unique vs. Returning Visitors
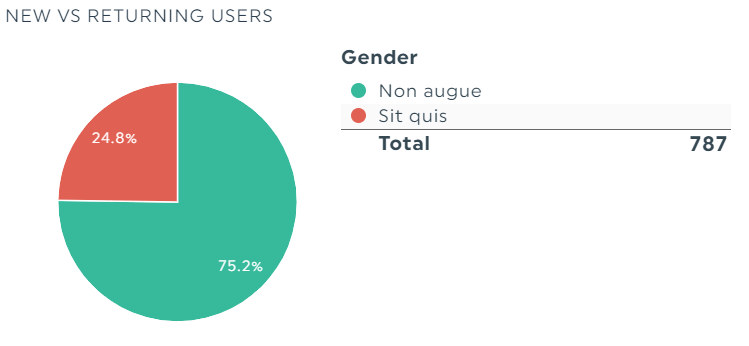
Unique visitors refer to new users on your site, whereas returning visitors (a.k.a. returning users) are folks who’ve visited your site.
Ensure that there’s a healthy balance between your new vs returning users. Low returning visitors could signal your content needs work.
The unique vs returning visitors is an easily skewed metric. For starters, Google Analytics treats returning users as new ones when they view your site in incognito mode!
If you suspect this is happening on a client’s site, add a note to provide more context. Hover to the metric and click Add Note.
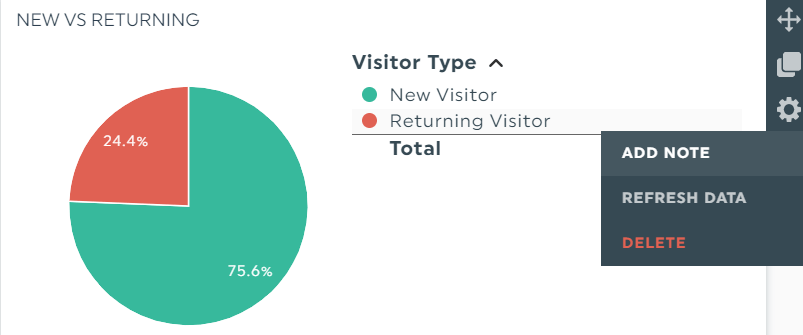
An editor will appear on the right side of the dashboard. Write your note and click Save.
The next time the client or project manager views the report, they’ll see an orange tab on the top-right corner of the widget. Your note will appear on the right of their screen when clicked.
Traffic Sources
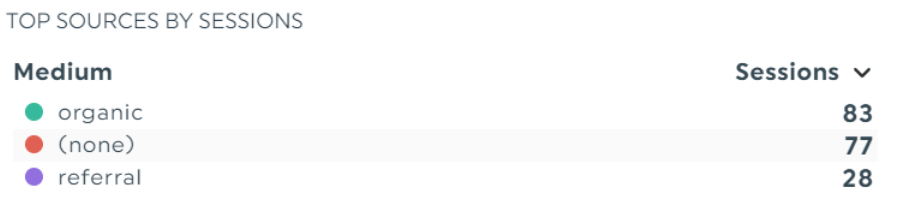
Traffic sources refers to the marketing channels responsible for driving traffic to your site. It’s usually categorized under direct, referral, or search engine.
If you want to pool your resources on the top-performing channels, this is the metric to look at.
Top Pages
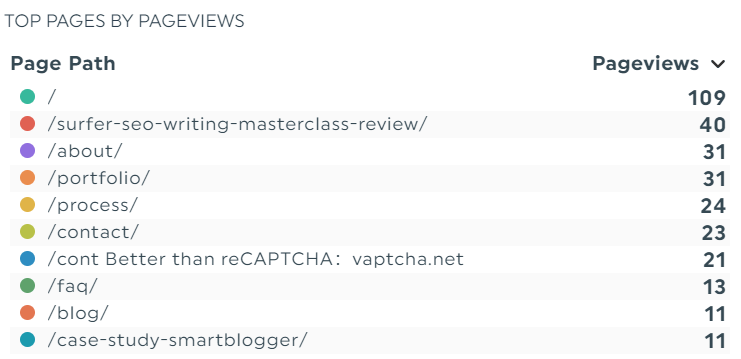
Top pages refers to your most viewed pages.
This metric is useful for measuring user engagement for all pages and deciding which web page you want to invest in further (e.g., build more backlinks so you can bump up ranking).
Conversion Rate
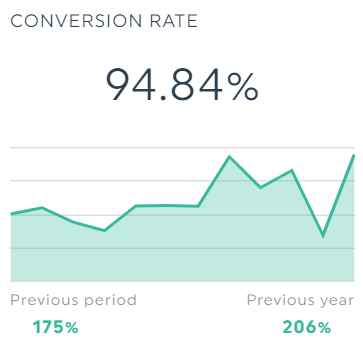
Conversion rate refers to the percentage of website visitors who completed an action (e.g., number of downloads for a lead magnet).
It’s similar to goal conversion rate, except that the latter is calculated as the number of goal conversions divided by the number of sessions.
Cost per Acquisition
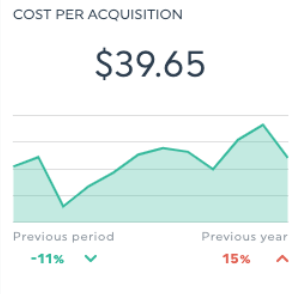
Cost per acquisition (CPA) refers to the total cost spent to acquire a customer. This metric is used to determine ROI and is often used to track paid search campaigns like Bing and Google Ads.
Together, these eight metrics make up a digestible Google Analytics report brimming with actionable insights.
Grab this Google Analytics report with your own data!
Share your recommendations if you want clients to extract more value from your report. Click Static Widget > Comments.

DashThis autosaves your comments.
To boost visibility, change its position with drag-and-drop or include a header right on top of the comment box (click Static Widget > Header).
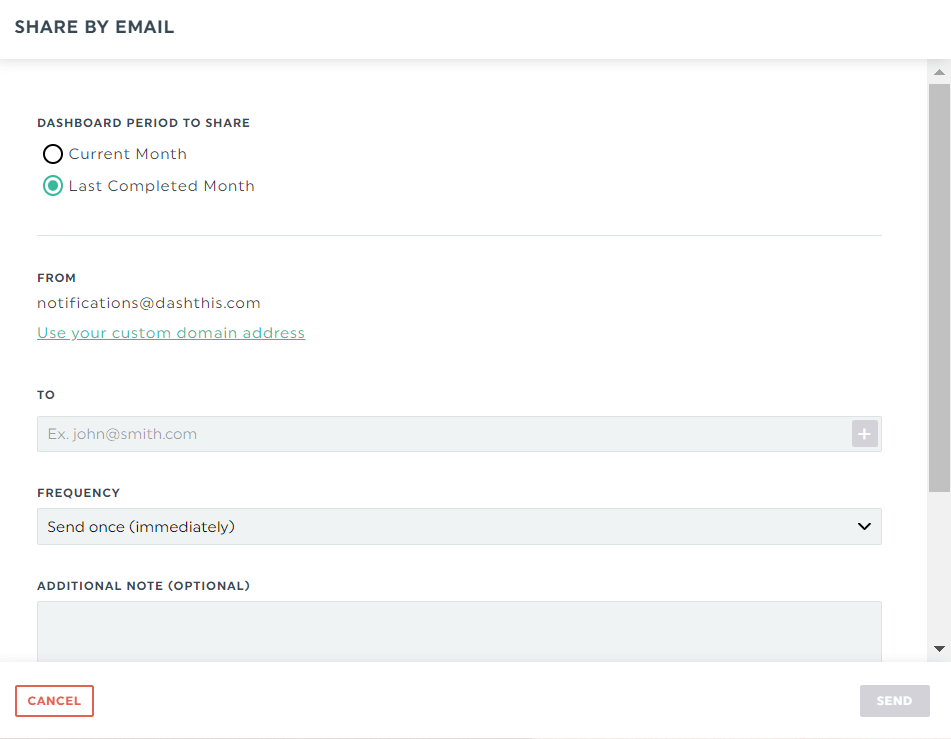
Once you’re done, click Sharing Options > Share by Email. Select the dashboard period, desired frequency, and the client’s email address. Click Send.
DashThis will automatically schedule and send the report according to your desired time frame. You can also download the report as a PDF or share an URL link for clients to view them online in real-time.
Automate it!
These Google Analytics metrics are a no-brainer for tracking your digital marketing strategies.
Now that you know which metrics to focus on, do it in seconds with an automated tool. DashThis gathers all your data in a single report, schedules it, and shares it with clients in one place. Try it for free. It’s yours for 15 days.
Updated on April 2022. This article was originally written by Al Gomez, a digital marketing consultant at Dlinkers and Sagad. With more than twelve years of digital marketing experience in search engine optimization, paid search and email marketing, he has contributed to a variety of online publications including Moz, Semrush and Wordtracker.
Ready to track all your Google Analytics UX metrics in one easy-to-use report?

Track all your Google Analytics metrics in one automated reporting tool.
Read More

Don’t miss out!
Follow us on social media to stay tuned!
Automate your reports!
Bring all your marketing data into one automated report.
Try dashthis for free