Marketing Insights: The Ultimate Guide for 2026 (Best Practices and How To)

TLDR: Marketing insights are actionable conclusions drawn from analyzing marketing data. They explain why something happened and what to do next, turning raw numbers into decisions. For example, noticing that your repeat buyers also browse a second product category is data. Concluding that you should bundle those products and promote the bundle to repeat customers is a marketing insight.
Observations alone will not move the needle. Your insights will.
They are the strategic realizations, usually earned through hours of analysis, that help you win in the market while competitors are still staring at dashboards.
This guide covers what marketing insights are, how they differ from data and analysis, the main types, real examples, a simple framework for turning insights into action, and how AI is changing the way marketers find them in 2026. We will also show how to pull all your marketing data into one place with DashThis so the insights are easier to spot.
What are marketing insights?
A marketing insight is a valuable, previously unrealised conclusion extracted from marketing data that points to a clear action. It is the bridge between knowing what happened and knowing what to do about it.
The simplest way to remember the difference:
- Data answers "What happened?"
- Analysis answers "Why did it happen?"
- Insight answers "What should we do about it?"
Data vs. analysis vs. insights: what's the difference?
Marketing data is the raw figures you track over a period: clicks, sessions, opens, spend, revenue. Analysis is the work of finding patterns and causes in that data. An insight is the strategic conclusion you reach, plus the action it justifies.
Here is how the three connect, using an oat milk store as a walkthrough.
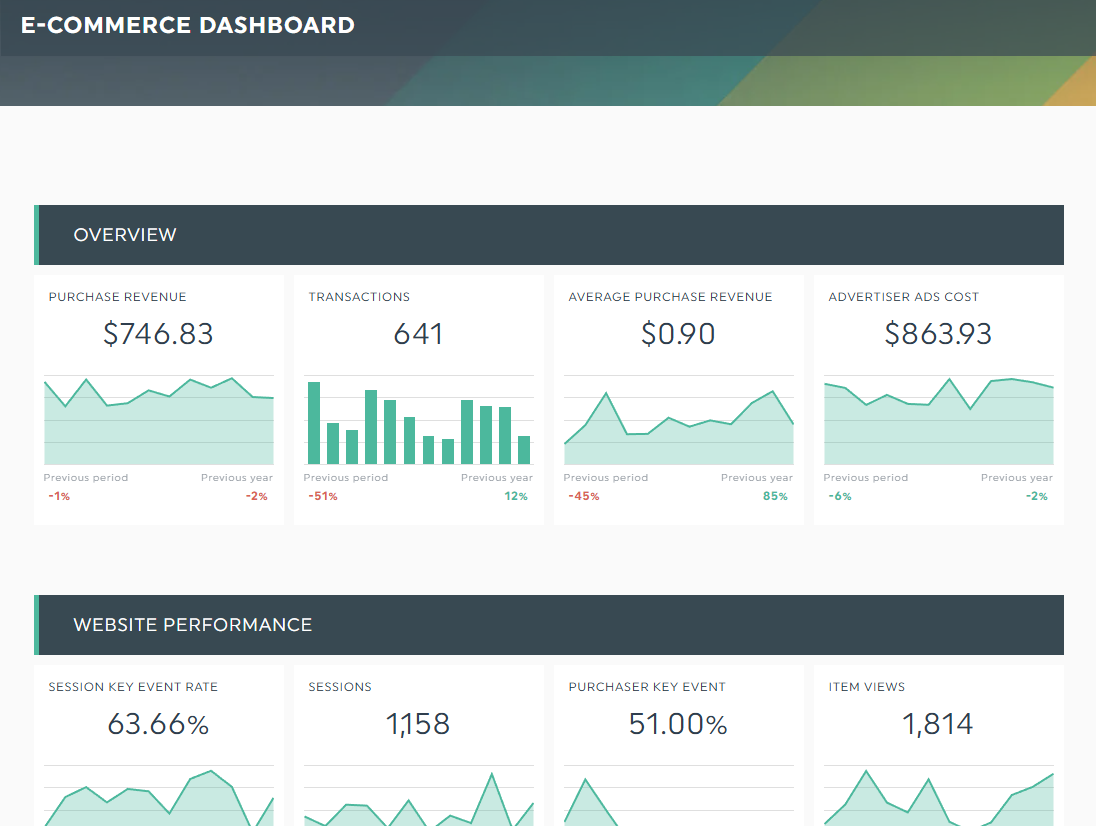
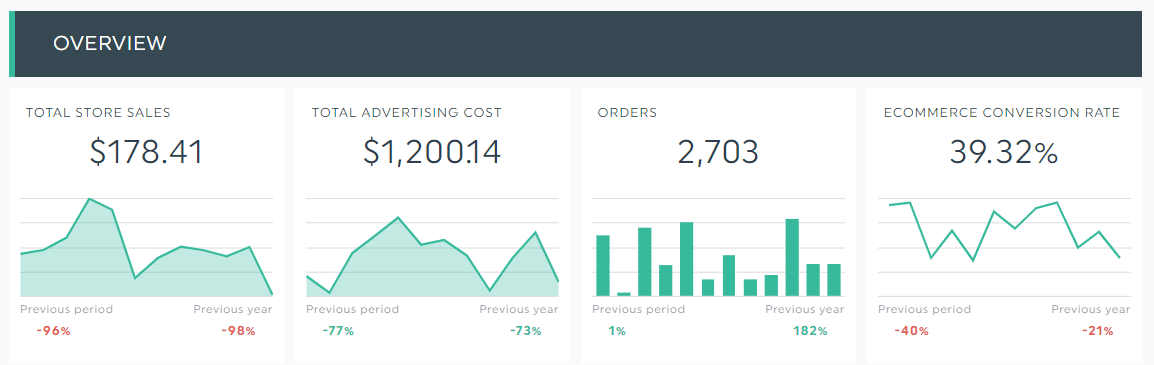
Imagine you run an oat milk ecommerce store. The year is closing and you want to spend the rest of your budget to increase sales next quarter. You pull all your store data into a single report covering sales, orders, and on-site visitor behaviour
During analysis you dig into quantitative data (sales, orders, visitor activity) and qualitative data (customer feedback). You make an observation: your high-value customers want more than oat milk.
Digging further, you find the insight: your best customers are prone to brand switching and buy different milks for different occasions, for example cow's milk for morning cereal, high-protein milk for post-workout shakes, and almond milk for decaf coffee. So instead of a spray-and-pray campaign aimed at everyone, you partner with complementary milk brands and run co-marketing campaigns to your most profitable segment next quarter.
That is the whole point. The insight told you which touchpoints to improve and which customers to focus on, all from one thorough analysis.
The main types of marketing insights
Most marketing insights fall into one of six types. Knowing the type helps you decide which data to gather and which team should act on it.
| Customer insights | What your audience needs, prefers, and does, drawn from behaviour, surveys, and feedback. Example: repeat buyers churn after their third order, so you build a loyalty offer at order three. |
|---|---|
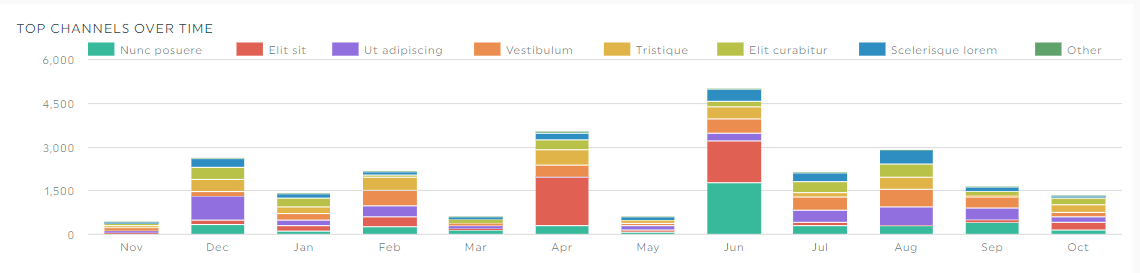
| Campaign and channel performance insights | Which campaigns, channels, and creative actually drive results. Example: LinkedIn ads cost more per click but convert at a far lower cost per lead than Meta, so you shift budget. |
| Market and competitor insights | Shifts in demand, pricing, and competitor moves. Example: search demand for a feature is rising before competitors have a page for it, so you publish first. |
| Product insights | How marketing connects to what people actually use and buy. Example: trial users who use one specific feature convert at a much higher rate, so you lead onboarding with it. |
| Channel and content insights | What format, topic, and timing resonate. Example: how-to content drives sign-ups while listicles drive only traffic, so you rebalance the calendar. |
| Predictive insights | What is likely to happen next, based on trends and modelling. Example: a forecast shows next quarter's pipeline falling short, so you front-load demand generation now. |
Why marketing insights matter
Raw data on its own is noise. Turned into insights, it does four things for a marketing team.
- Drives better decisions: Every strategic move comes down to making an informed decision and executing it. Data-backed customer insights take the guesswork out of which decision to make.
- Surfaces trends early: The fastest company in a market tends to win. Acting on insights before a trend peaks is how you get a head start on competitors.
- Reveals what sets you apart: Insights from market research and regular reporting uncover the differentiators that competitors miss.
- Creates accountability: Generating useful insights takes effort. Setting KPIs and tracking them in shared reports keeps the team honest about whether the insights led to results.
Top KPIs and Metrics to Track Before Drawing Marketing Insights
You cannot draw a reliable insight from a metric you are not tracking. These are the core metrics by area, grouped so you can build a report around them.
Social media engagement

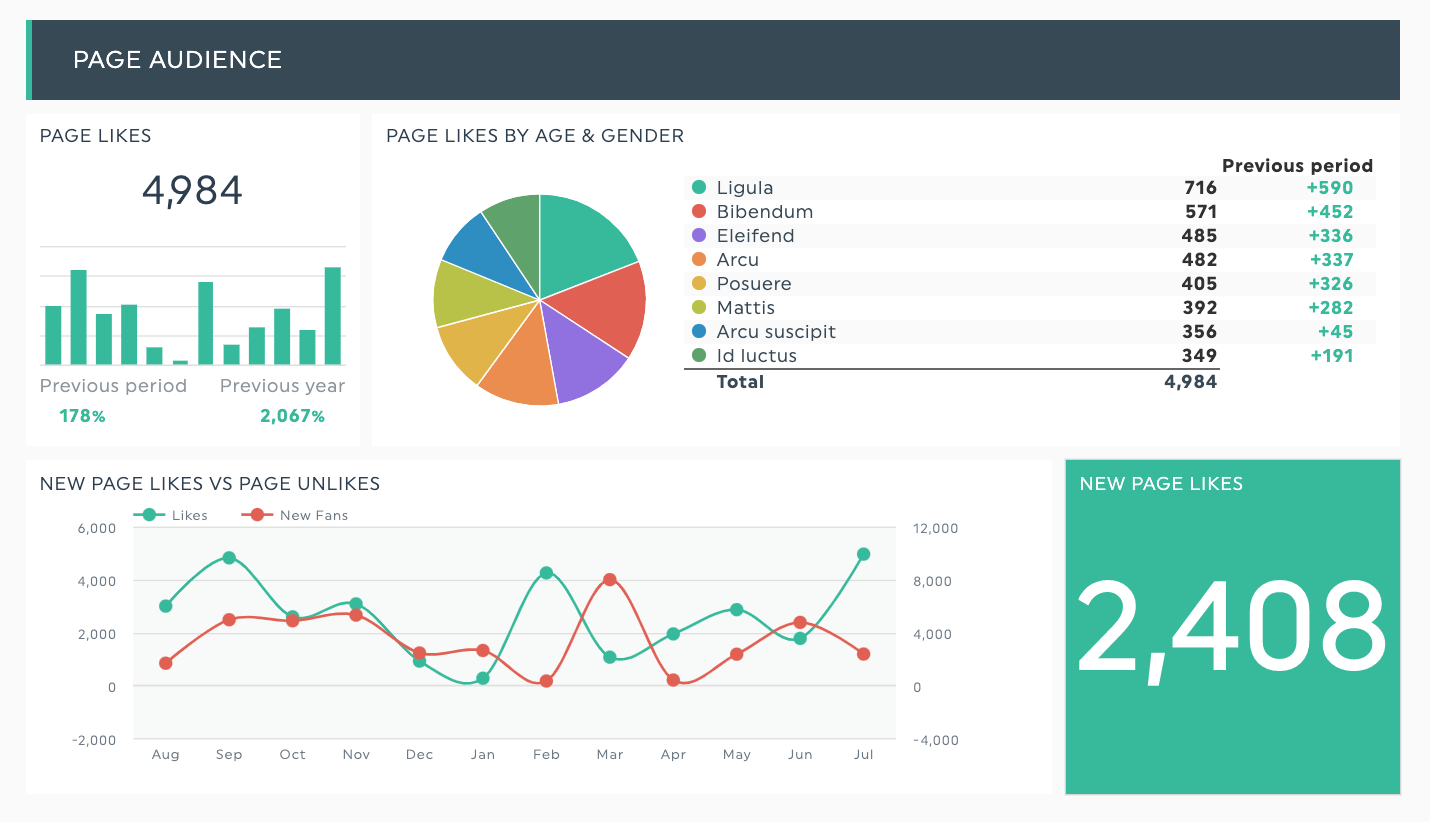
Whether you use social media to understand customer needs, engage them, or reach loyalty and customer satisfaction, these popular metrics help you gauge the impact of your efforts.
Start measuring them to find your optimal posting time, identify the top-performing post, and track how each post across different channels contributes to web traffic, leads, and revenue.
Common KPIs: reduction in cost per acquisition from paid social; increase in app installs from a campaign; reduction in cost per brand lift.
Common metrics: reach, impressions, click-through rate, engagement rate, cost per acquisition.
Website traffic and user behavior
Your visitors’ interaction with your website tells you a lot of things, from the content that resonates the most to the products that capture their attention.
Measure these metrics to learn more about customer behavior towards online purchases (e.g., track if messaging is working).
Common KPIs: click-through rate from homepage to demo; number of demo sign-ups; increase in MQL to SQL conversion.
Common metrics: organic traffic, page views, pages per session, bounce rate, traffic sources.
Email marketing performance

Email marketing may boast a high ROI, but that doesn't mean you should constantly poke into customers’ inboxes—especially when 49% of consumers say they receive too many emails from brands.
Take cues from the email metrics below. It'll indicate if customers want to hear from you…or not.
Common KPIs: sales from welcome emails; conversions from sponsored emails; click-through rate from win-back email to product page.
Common metrics: deliverability rate, open rate, click-through rate, unsubscribes, list growth rate.
SEO & keyword performance
SEO is a long-term strategy.
Companies that continue to invest in content during a downturn will steadily climb the SERPs and stay ahead of competition.
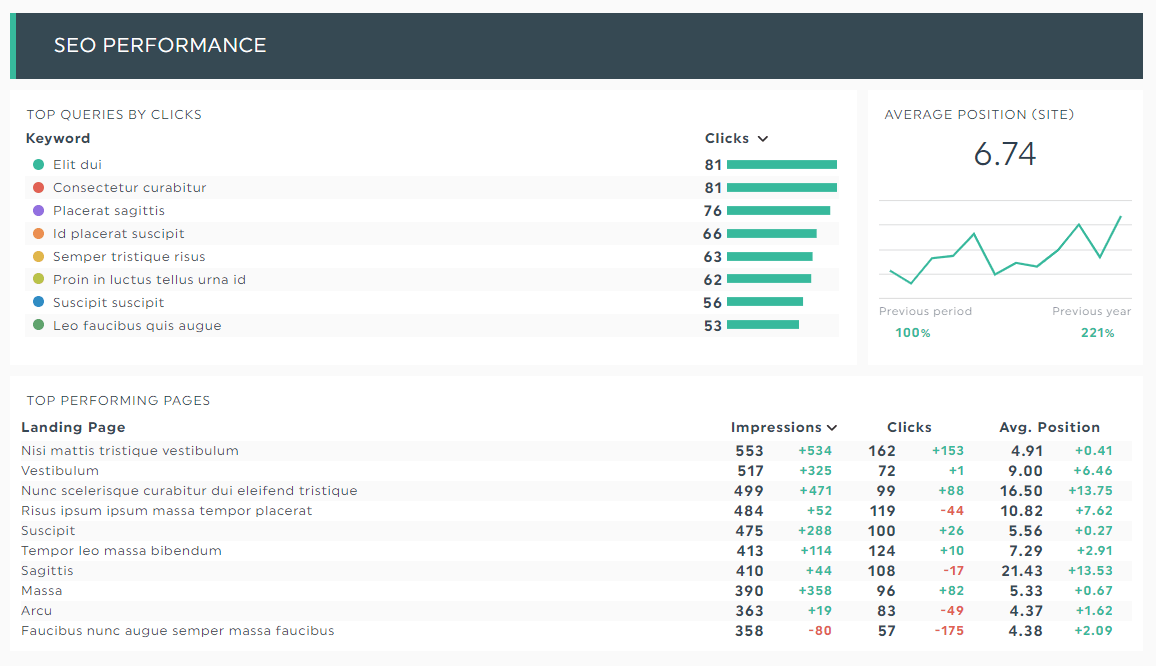
Track if you're making the most of your content budget with these SEO metrics.
Common KPIs: increase in leads after content optimisation; number of high-intent keywords in the top five; revenue from a product-led post.
Common metrics: organic traffic, domain rating, backlinks, average keyword position, keyword rankings.
Conversions
Your marketing strategy is pointless if it doesn't generate conversions—be it acquiring new leads or paying customers. These revenue-driven metrics show if your business offering is aligned with the target market.
Common KPIs: monthly new leads; trial-to-paid users; deals won.
Common metrics: conversion rate, return on ad spend, leads generated, cost per acquisition, revenue attribution.
How to turn marketing insights into action (a 6-step framework)
Insights are only worth the action they trigger. Use this repeatable loop.
-
1Collect
the right data across every channel that matters, not just the easy ones.
-
2Centralise
it in one place so you can compare channels side by side instead of switching tabs
-
3Analyse
for patterns, outliers, and changes over time.
-
4Interpret
the why behind the pattern, and write it as one plain sentence.
-
5Act
by choosing a single, specific next step tied to the insight.
-
6Measure
the result, then feed it back into the next cycle.
How AI is changing marketing insights in 2026
The biggest shift in the last two years is that finding insights no longer has to start from a blank dashboard. AI now handles a large part of the heavy lifting in four ways.
- Pattern surfacing: AI scans across channels and flags correlations a human might miss, so analysis starts from candidates rather than scratch.
- Anomaly detection: it spots spikes and drops as they happen, instead of at the end-of-month review.
- Natural-language querying: you can ask a question in plain English and get an answer with the chart attached, which lowers the barrier for non-analysts.
- Plain-language summaries: AI drafts the "why" in readable sentences you can refine, which speeds up reporting to clients and stakeholders.
One caution: AI can be confidently wrong. Always check the underlying numbers and the logic before you act on an AI-generated insight, especially when budget or strategy depends on it. The goal is AI-assisted insight, with a human making the final call.
DashThis builds this in with its AI reporting tool, which helps summarise your reports and surface what changed, while keeping the raw data one click away so you can verify it.
How to streamline insights reporting with DashThis
DashThis is the easiest reporting tool.
It automatically grabs your entire marketing data across multiple online channels into one beautiful report.
Here's how you can get started:
- Pick a premade report from 40+ templates.
- Connect your marketing tools to DashThis.
- Choose your metrics from the Preset Widgets, then drag and drop them into place.

From there you can customise the report to match your client's branding, and add a comments box to write your insights right inside the report instead of in a separate email. Click Static Widget > Comments to add your insights in bullet points.
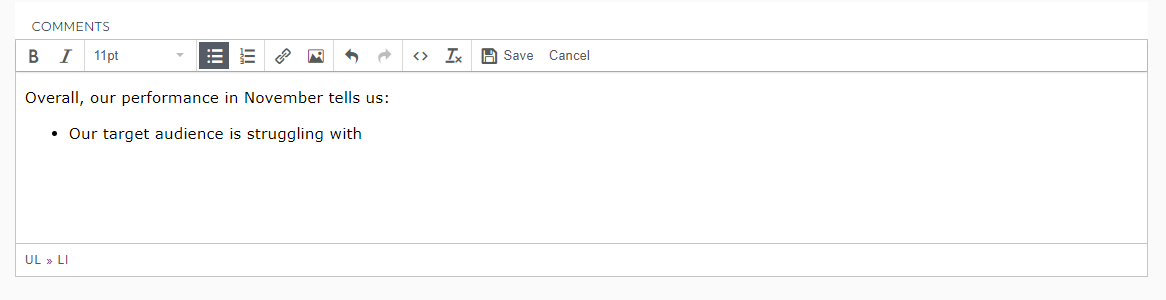
Click Save.
Once you’re done, share the report with clients.
Hover to the Sharing Options icon on the top right and click Share by Email. Set the dashboard period and frequency, along with the client’s email address.
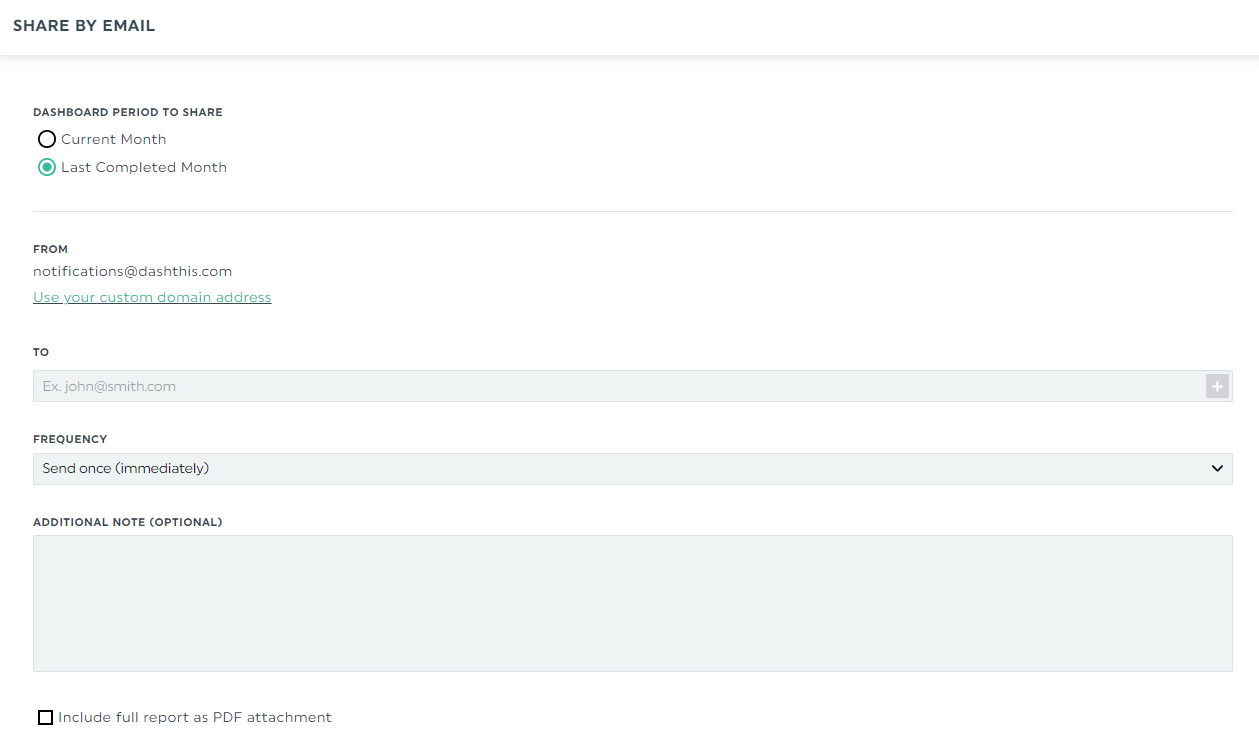
From here, clients can view your insights and their marketing performance in the same place in real-time.
Digital marketing report template
Combine every inbound and outbound channel in one view to see whether your digital marketing is actually driving acquisitions and conversions.
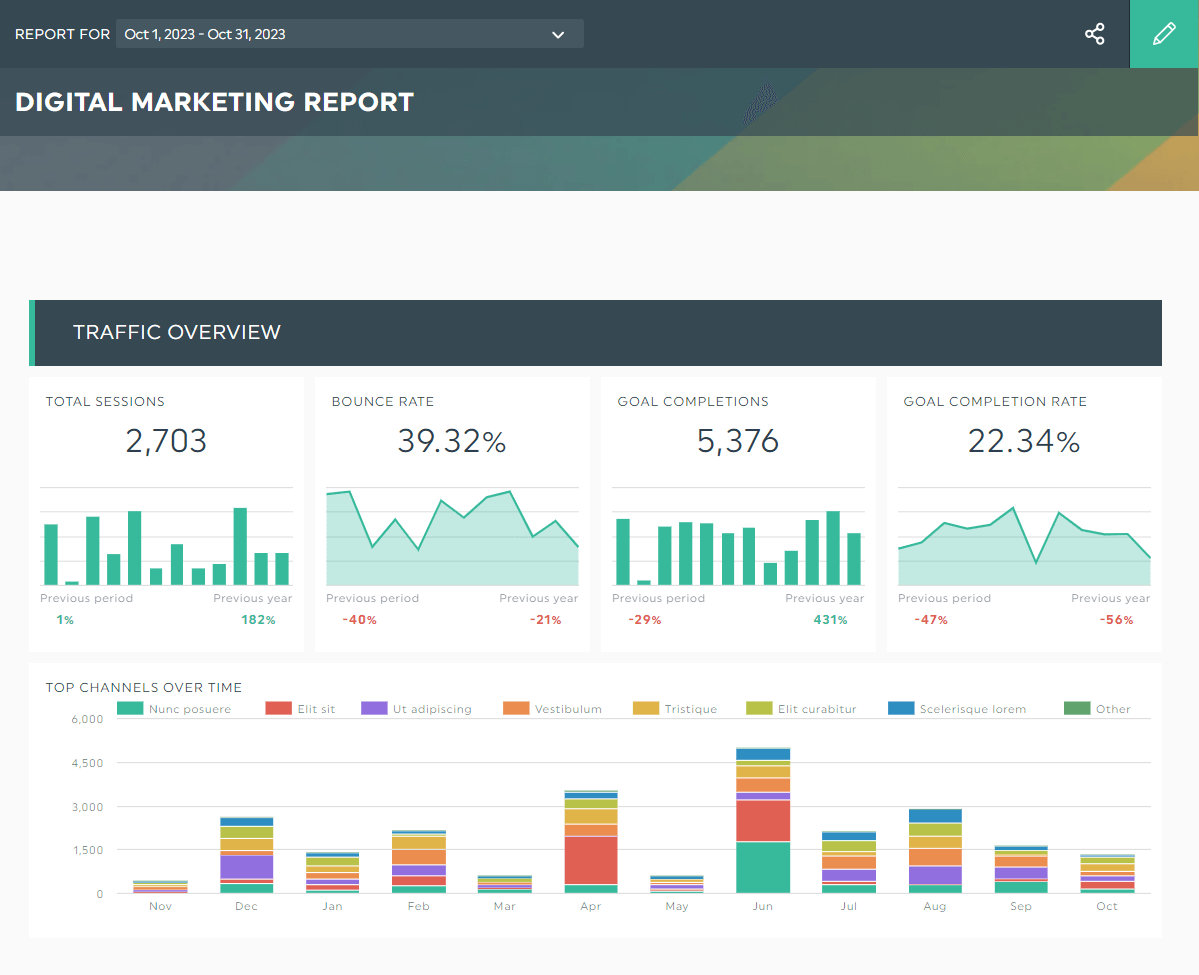
Grab this digital marketing insights template with your own data!
Key takeaways
- A marketing insight is a conclusion drawn from data that points to a specific action; data is what happened, an insight is what to do next.
- The main types are customer, campaign and channel performance, market and competitor, product, and predictive insights.
- A good insight is specific, tied to a number, and names one next action.
- Turn insights into action with a simple loop: collect, centralise, analyse, interpret, act, measure.
- In 2026, AI can surface and summarise insights fast, but a human should verify before acting.
- Centralising your data in one report (for example with DashThis) is what makes insights easy to spot in the first place.
Automate Your Marketing Insights Reporting Today!
Observations alone won't move the needle forward.
To drive strategic change across the company, you need to actively track data, draw insights on your best customers today, and lay out the next steps.
The challenge now lies in integrating all your marketing channels into one place.
Gather your entire marketing data into one beautiful report with DashThis. By having all data at a single glance, you can quickly analyze your overall marketing performance and draw unique insights to give your company a competitive edge.
DashThis is the easiest reporting tool. Pricing starts at $44 per month when billed annually. Start your free 15-day trial to make sense of your data today.

Read More

Don’t miss out!
Follow us on social media to stay tuned!
Automate your reports!
Bring all your marketing data into one automated report.
Try dashthis for free