Campaign Reports: How to Measure & Share Campaign Results

After switching to an automated reporting tool to create campaign reports for its clients, a digital marketing agency saved over 20 hours of work every month.
And as for the clients?
They found it easier identifying what works and putting new marketing strategies into action with zero guesswork.
It’s a win-win for both parties.
Because not only did the clients prove the ROI of their marketing efforts, but the agency also got the green light to renew the contracts.
You’re in the right place if you want to replicate these outcomes in your campaign reports.
This guide re-introduces some of the most popular marketing campaigns and walks you through how to create a value-packed report with the easiest reporting tool.
- Understanding Different Types of Campaigns
- How to Automatically Measure Campaign Reports with DashThis
- How to Quickly Share Campaign Results with DashThis
- Automate Your Campaign Reports with DashThis Today!
Understanding Different Types of Campaigns
Here are some of the top campaigns you’ll implement in your marketing career.
To give you a better idea, we’ll also share the key performance indicators (KPIs) and metrics often tracked in each campaign.
Social media campaigns
Social media works best for high volume, low margin businesses.
Whether it’s tapping into a larger target audience, gathering customer feedback, or staying on top of mind of repeat customers, social media is the unrivaled victor.
Start tracking your campaign effectiveness with the social media marketing metrics below.
Examples of KPIs:
- Number of leads from X campaign
- % increase of customer lifetime value (CLV)
- % increase of net promoter score (NPS)
Examples of metrics:
- Impressions
- Page views
- Engagement rate
- Reach
- Clicks
- Shares
Email marketing campaigns
Email marketing continues to generate the highest ROI, with an average of $47 in return for every $1 spent.
From user onboarding and cross-selling to promoting a new product and re-engaging disengaged customers, the following metrics help you find the winning email.
Examples of KPIs:
- Number of sales from transactional emails
- % of CTR from welcome email to demo page
- Number of conversions from winback emails
Examples of metrics:
- Deliverability rate
- Number of unsubscribes
- Number of subscribers
- Open rate
- Click-through rate (CTR)
- Conversion rate
- List growth rate
PPC campaigns
Focusing on high-intent keywords eliminates wasted ad spend, as you’re not just driving traffic—you’re making sure it converts.
The advertising campaign metrics below help maximize returns per dollar spent and optimize your overall ad campaign.
Examples of KPIs:
- Number of qualified leads or new customers
- % of reduction in CPA
- % of reduction in CPL
Examples of metrics:
- Click-through rate
- Cost per click (CPC)
- Cost per lead (CPL)
- Cost per acquisition (CPA)
- Conversion rate
- Bounce rate
- Return on investment (ROI)
- Return on ad spend (ROAS)
How to Automatically Measure Campaign Reports with DashThis
DashThis is the easiest campaign reporting tool.
Automatically gather your entire digital marketing data across multiple channels into one beautiful report. DashThis integrates deeply with your favorite platforms, including Google Analytics, Facebook Insights, and MailChimp.
You can either create a standalone report or combine different channels into a single report.
Here’s how it works:
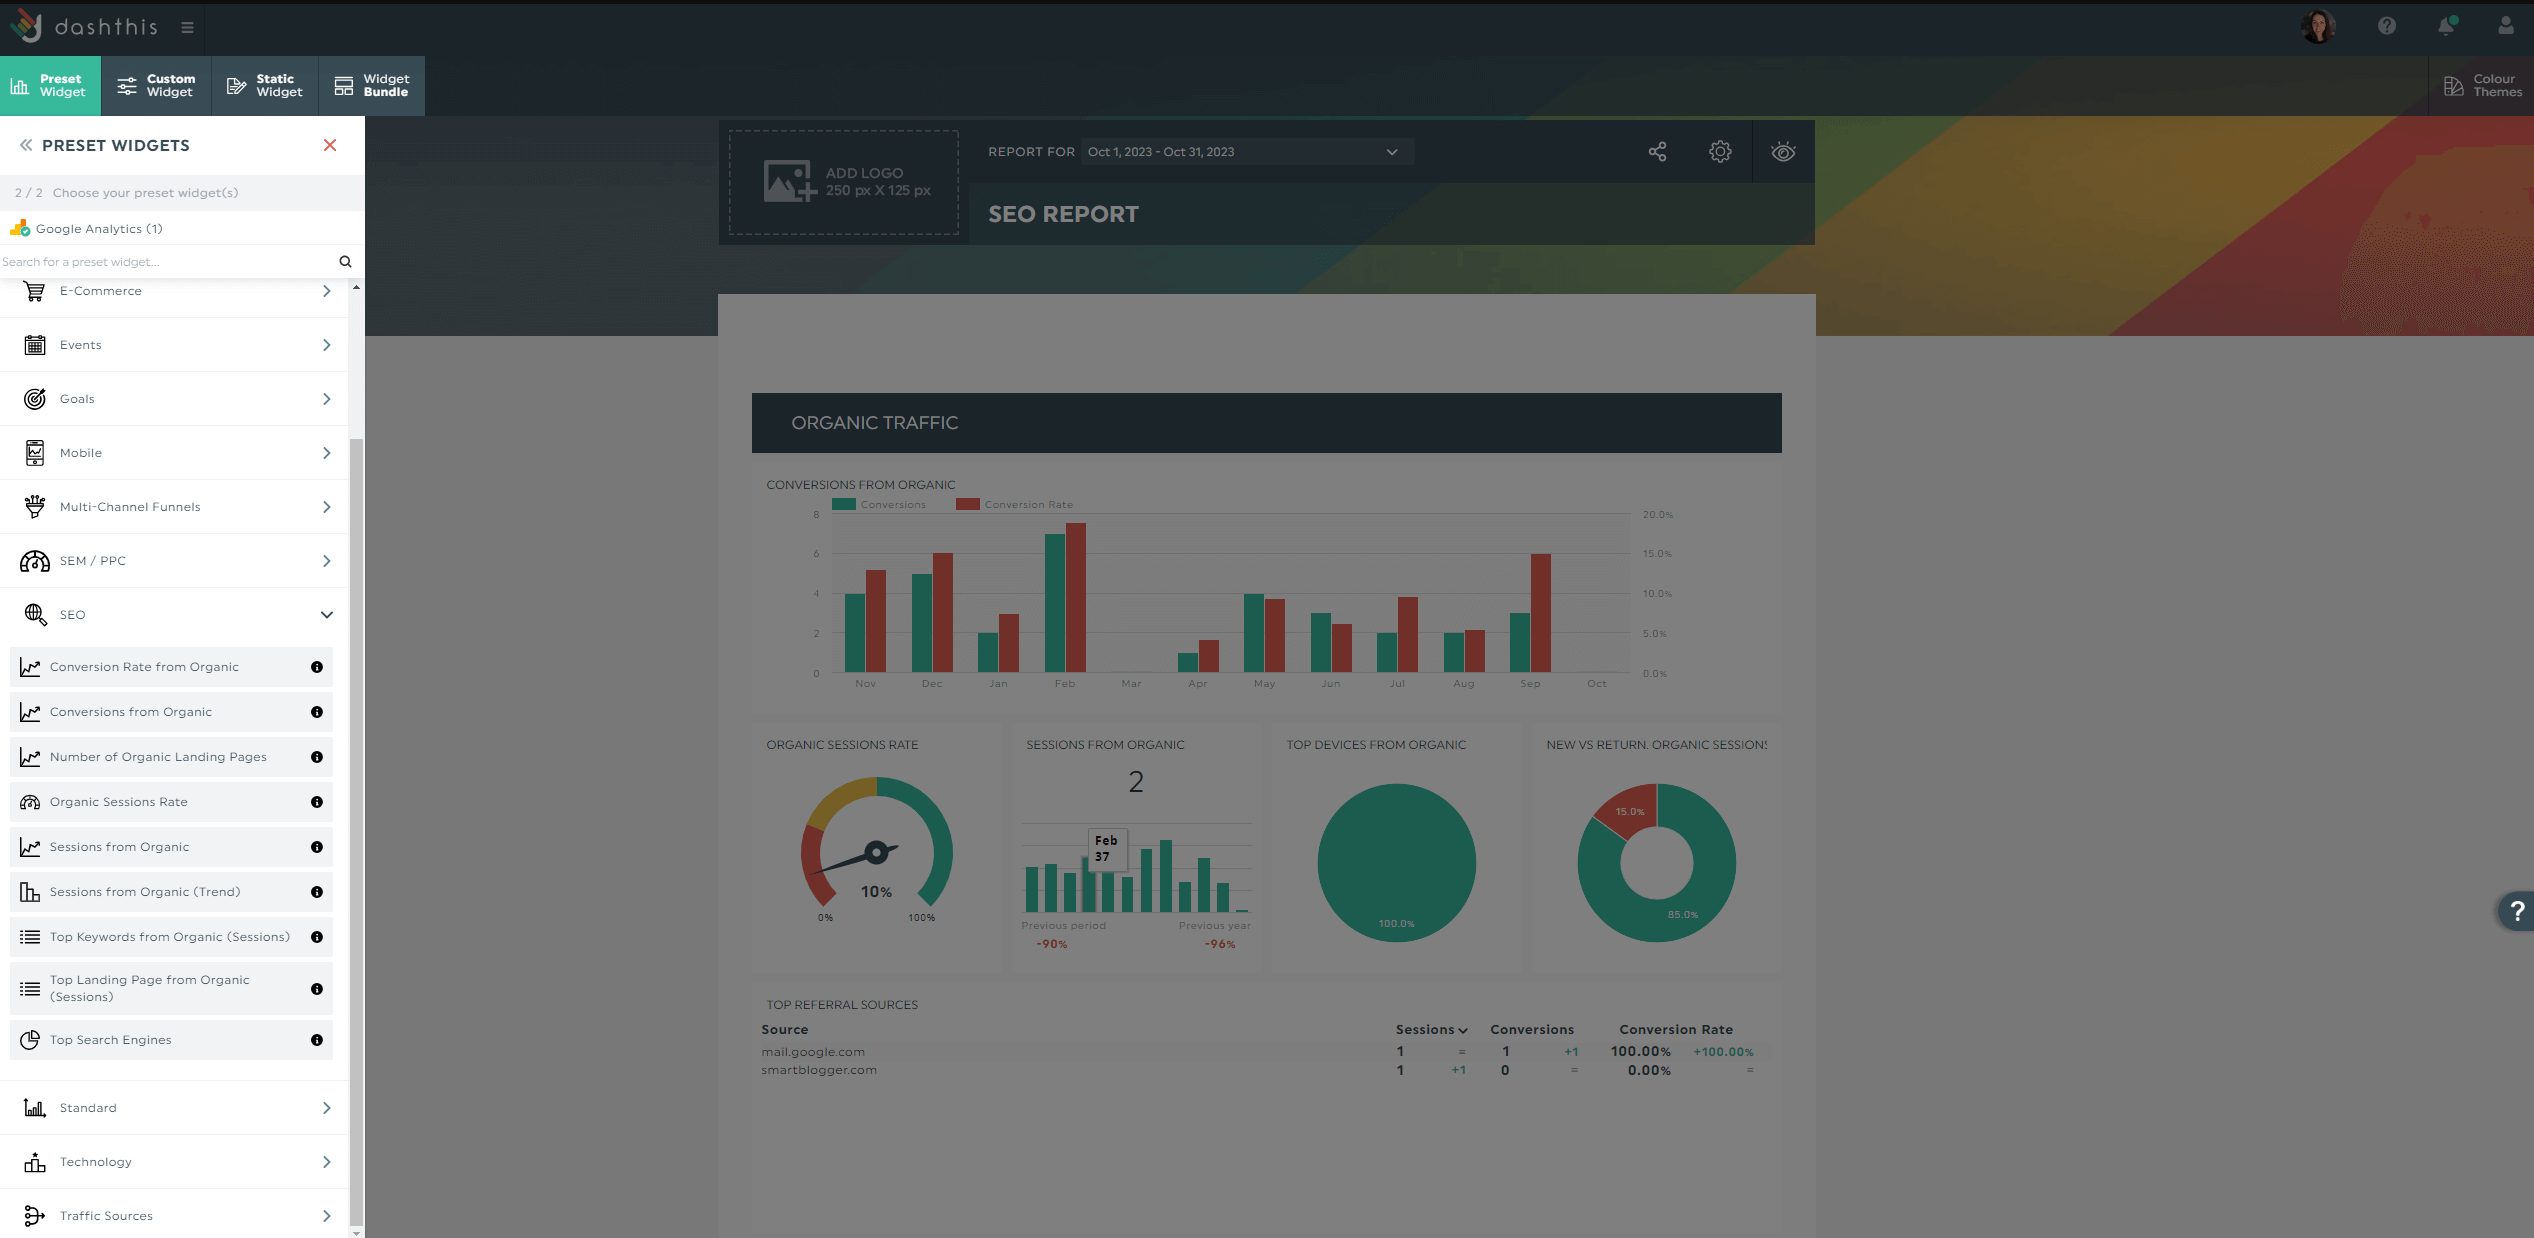
- Select a report from 40+ templates
- Connect your marketing channels with DashThis
- Pick your metrics in Preset Widget
Sit back and wait for the metrics to pop up on the right side of your screen. Drag and drop them to form a cohesive look.
Customize the widgets to illustrate the impact of your campaign performance.
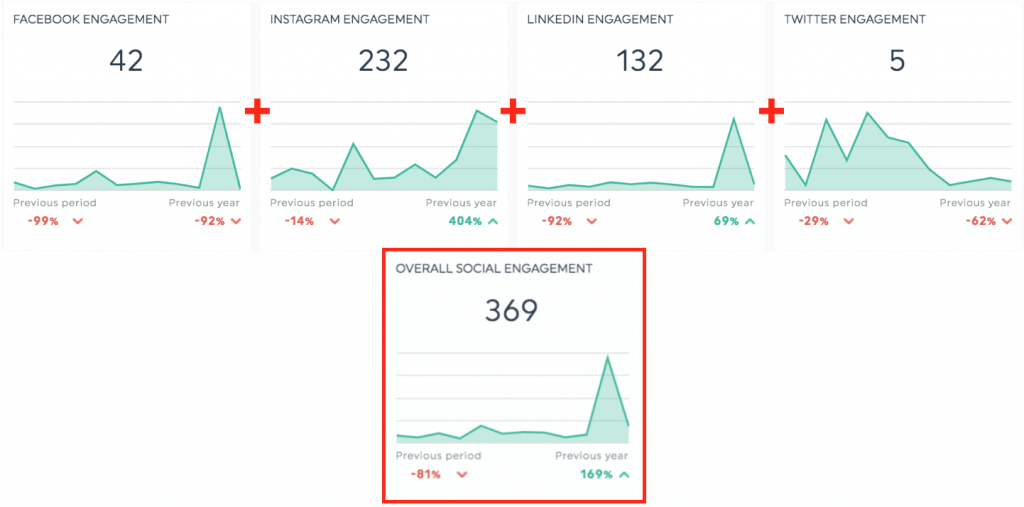
Suppose you want to track the overall engagement across different social media channels into a single widget.
Hover the widget you want to merge and click Edit Widget > Merge Widgets. Select the relevant metric from the dropdown menu and click Save.
Work with clients with little marketing expertise?
Provide more context directly within the report instead of starting a new email thread. It saves clients the hassle of clicking through multiple tabs.
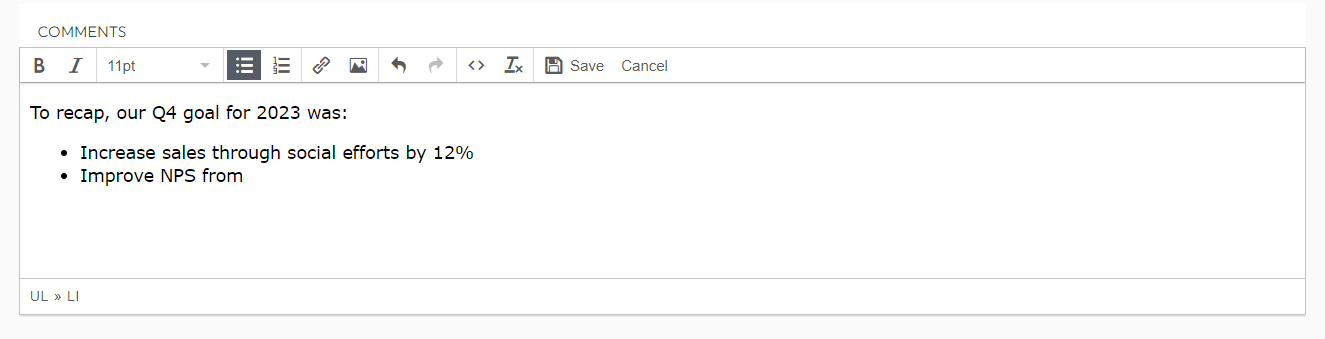
Our comment tool also comes in handy when you want to reiterate your campaign goals.
Click Static Widget > Comments.
Explain your digital marketing campaign goal and click Save.
Highlight the industry’s benchmark or your insights into another comment box. It’ll set the stage for future campaigns.
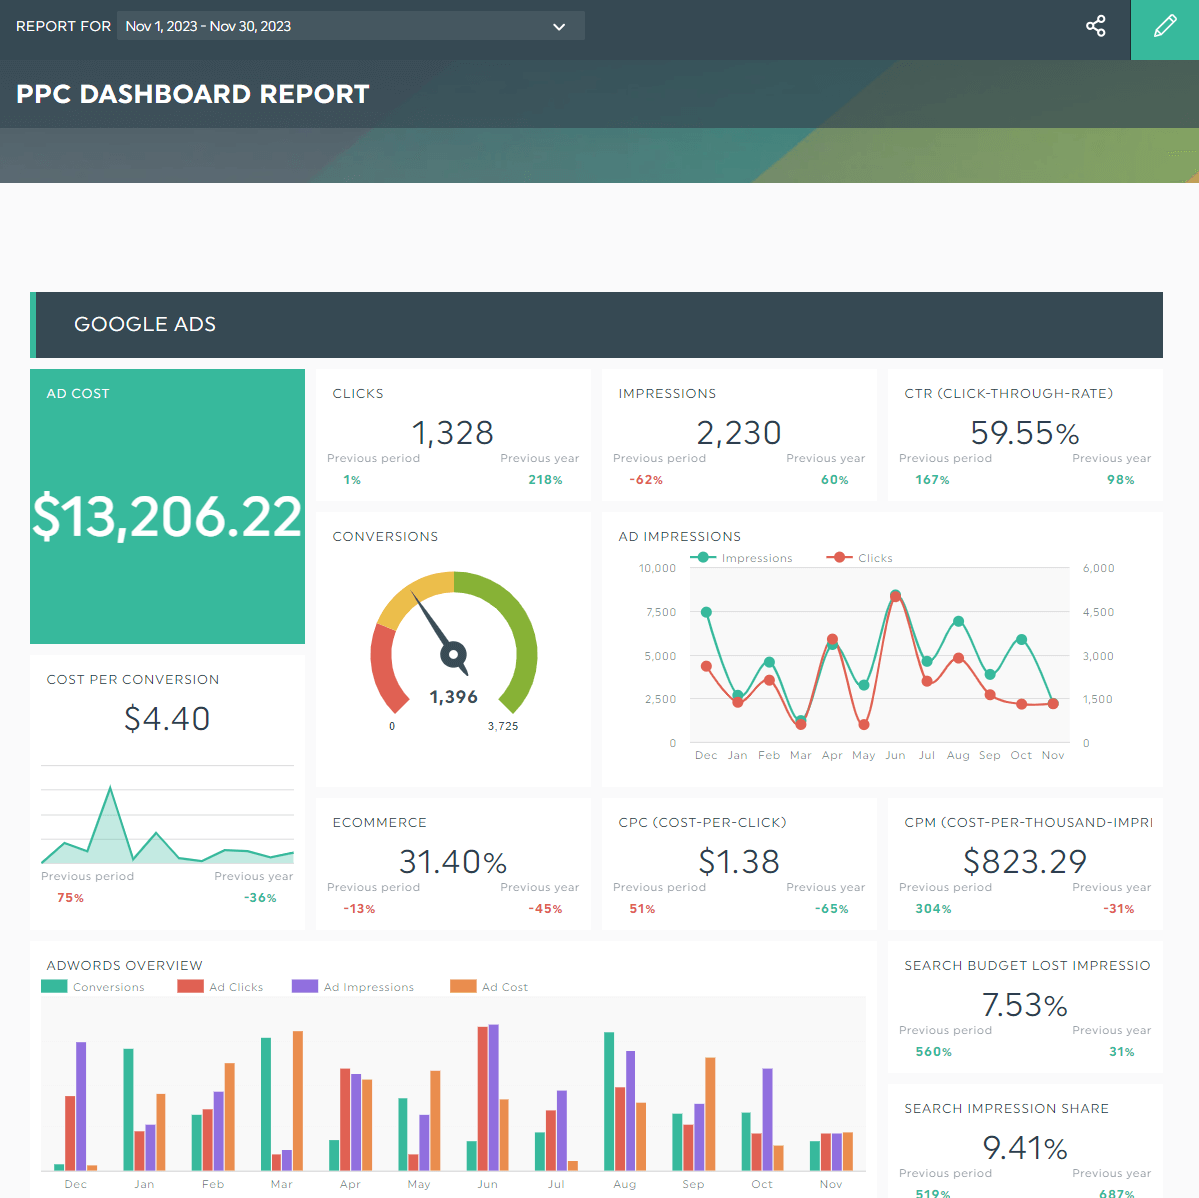
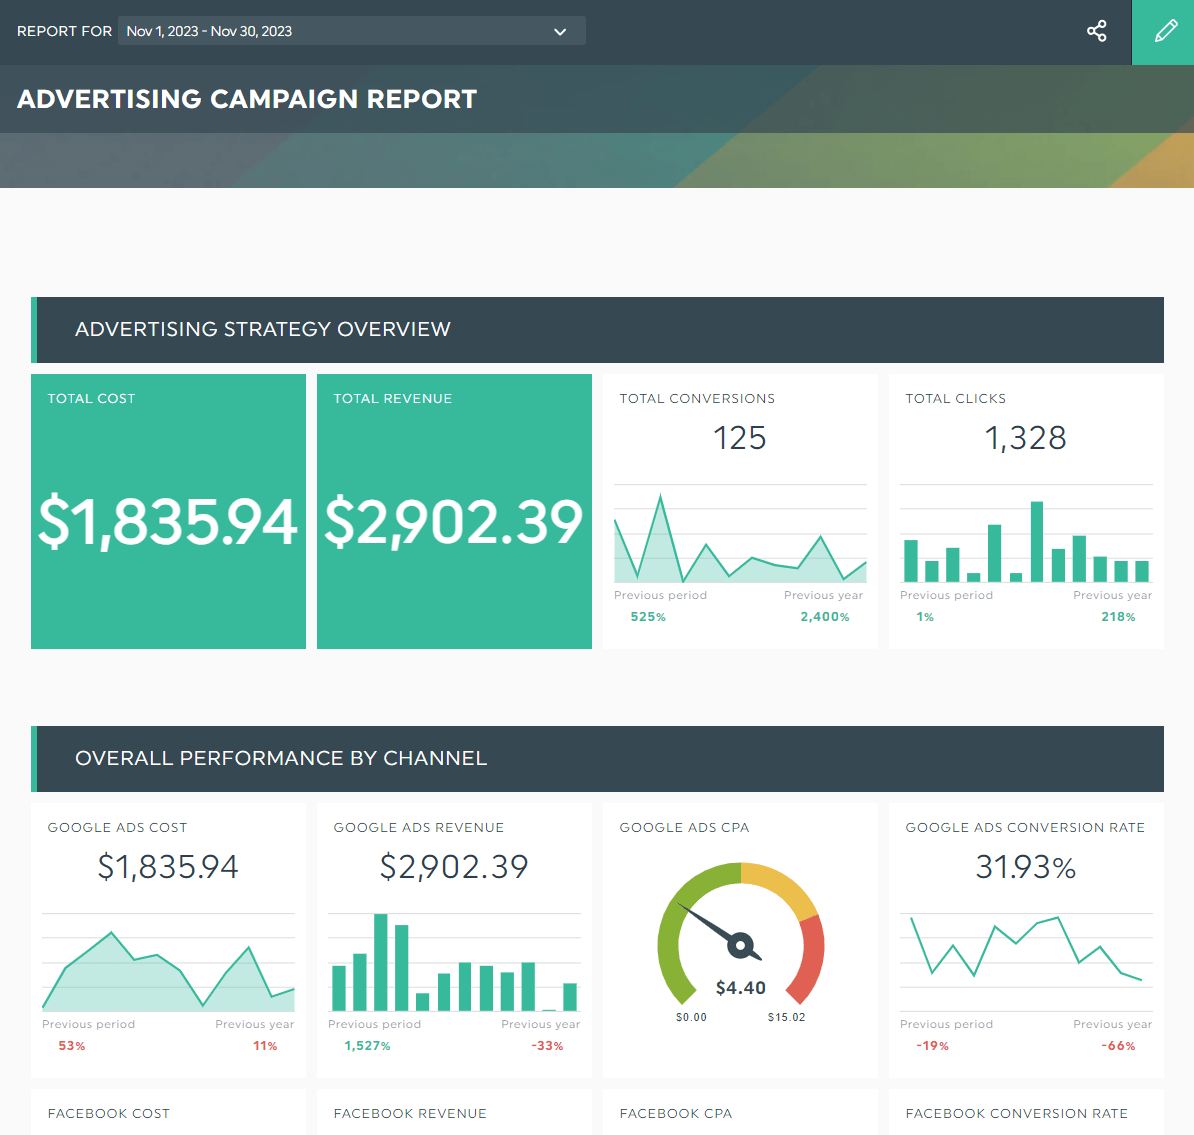
Advertising campaign report template
You want to make the most of your marketing budget when running PPC ads, and this dashboard’s got you covered.
Note how it visualizes the total cost and revenue and breaks down the overall performance by channel.
Use it when you conduct A/B testing, identify your best-performing landing page by website traffic and conversions, and more.
Grab this advertising campaign report with your own data!
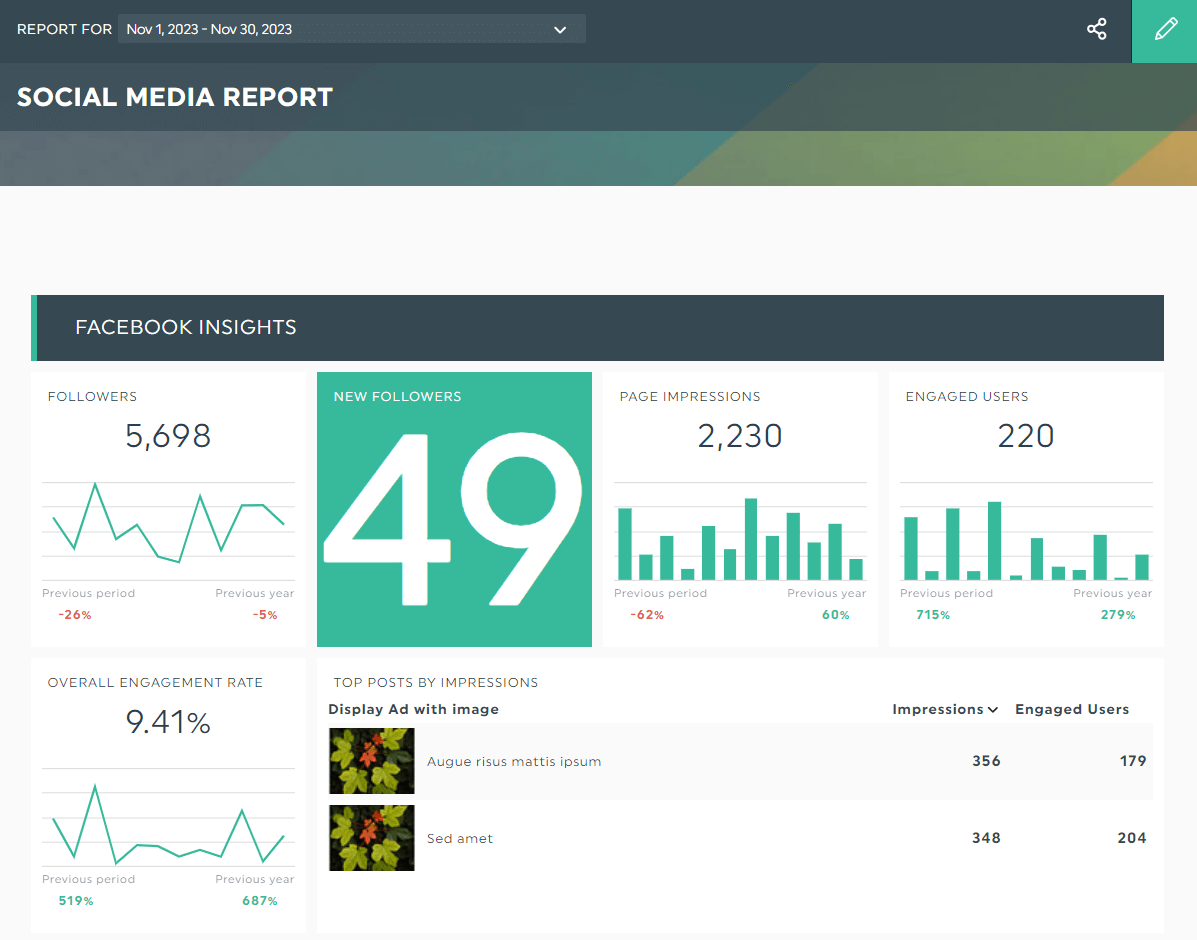
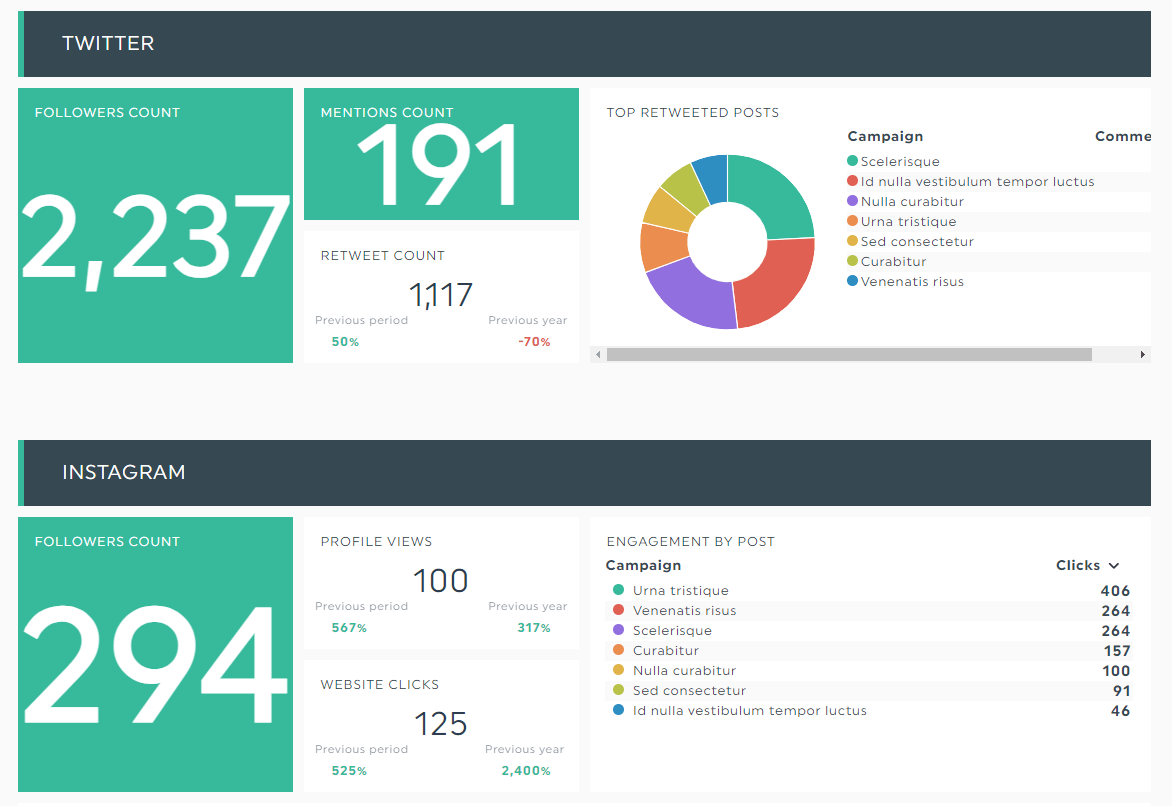
Social media report template
A successful performance marketing strategy correlates with brand awareness, so much so that high awareness brands see an average 13% sales increase at a 10% spend increase.
This dashboard tracks how much engagement you’re generating on individual channels while staying on budget.
Use it to extend your reach, increase online sales, and prove the impact of your social efforts.
Grab this social media report with your own data!
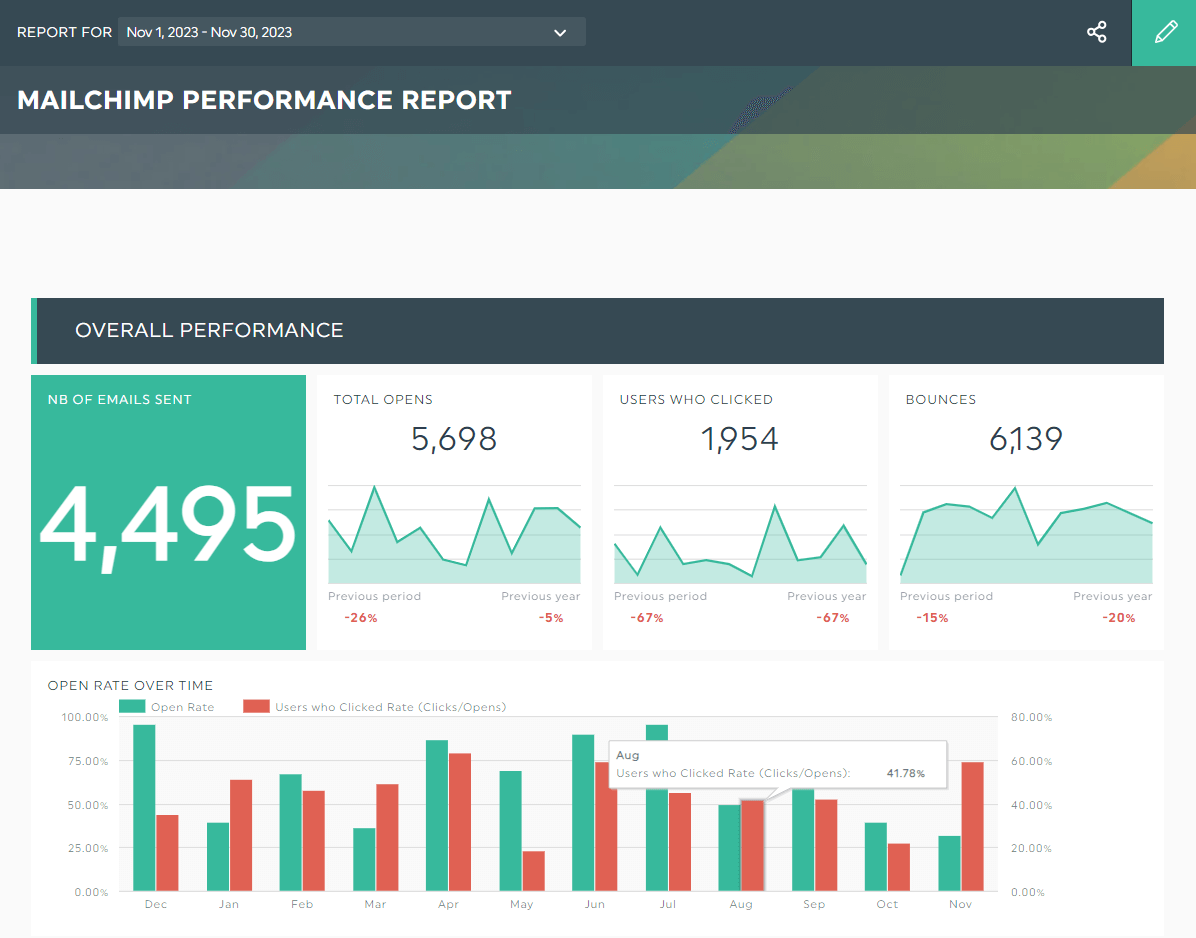
Email report template
Are your product or life cycle emails engaging with subscribers or getting ignored?
This dashboard compares email campaigns across different email marketing platforms, digging deeper into the metrics that matter.
Use it to find the winning subject line, email design, or CTA button.
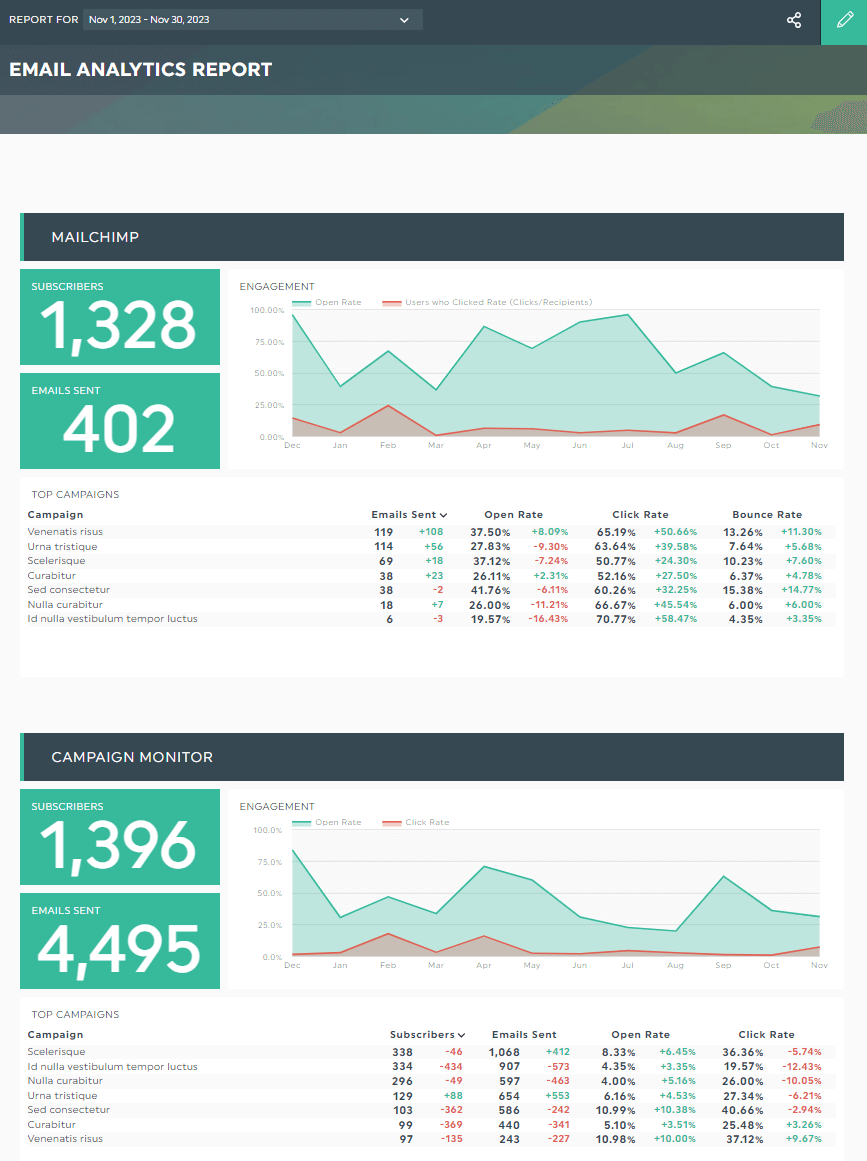
Grab this email report with your own data!
How to Quickly Share Campaign Results with DashThis
There are three ways to share your marketing success on DashThis.
Click the Sharing options icon at the top header to access them.
(i) URL link
Best for: Team communication channels like Slack and Microsoft Teams
With this link, anyone can view the report in real-time.
(ii) Automatic email
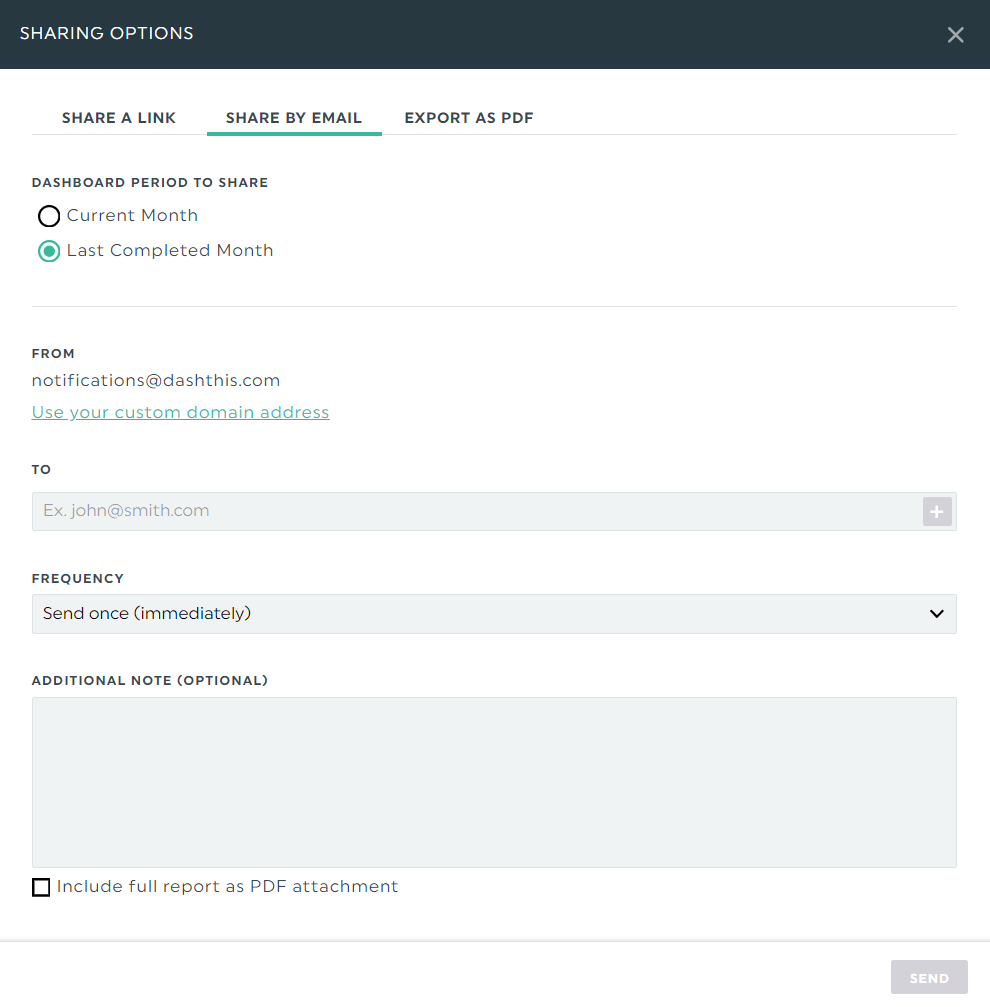
Best for: Automate sharing via email dispatch
Pick the time frame for the dashboard period, select your preferred frequency, and recap the client’s specific goal in the additional note.
Likewise, anyone can view the report in real-time.
This “set it and forget” mode streamlines reporting and gains back hours of your time.
(iii) PDF
Best for: In-person meetings
Export your report as a PDF, print in multiple copies, and hand them out to the client and marketing team during monthly or deliverables meetings.
And while you’re at it, present the report on the big screen as you explain the results and share the next move.
You can also automatically attach the PDF report to your dispatched emails.
Automate Your Campaign Reports with DashThis Today!
Campaign reports provide valuable data into your marketing performance—like the last-click attribution that led to a conversion.
Automatically gather your entire campaign data into one beautiful report with DashThis. By having all data at a single glance, you can quickly analyze your results and draw actionable insights to ensure campaign success.
DashThis is the easiest reporting tool. Pricing starts at $44 per month when billed annually. Start your free 15-day trial to streamline your campaign reporting today.

Ready to track your campaign reports?
Read More

Don’t miss out!
Follow us on social media to stay tuned!
Automate your reports!
Bring all your marketing data into one automated report.
Try dashthis for free