8+ Campaign Metrics To Measure The Success Of Your Marketing Campaigns

On April 23, 1985, The Coca-Cola Company made marketing history for the wrong reasons. However, they saved themselves by listening to their campaign metrics.
To regain the lead against its competitors, Coca-Cola changed the formula for its famous soft drink. Branded New Coke, taste tests showed people preferred the new formula. What could go wrong?

However, they underestimated how changing the taste would affect their target audience's intangible but important bond with Coca-Cola.
Calls flooded in. The Coca‑Cola Company received 1,500 calls daily on its consumer hotline, compared with 400 a day before the taste change. People started hoarding the ‘old’ Coke - getting depressed over losing their favorite soft drink. Protests groups sprung into action.
Coca-Cola had enough data to know this campaign was a mistake. In July 1985, they announced a return to the ‘old’ Coca-Cola, and the rest is history.
—
Coca-Cola’s story is a lesson on how tracking campaign metrics helped save the company from one of the biggest blunders in marketing history.
Likewise, monitoring campaign metrics can help you understand where to divert your marketing efforts. We’ll show you how to create a campaign key performance indicator (KPI) dashboard and campaign KPI examples to ensure you’re measuring the right actions.
- What are campaign metrics
- How to choose campaign metrics to track
- The 8 most important metrics to determine campaign success
- How to track your campaign metrics with DashThis
- Automate your campaign KPI reporting
What are campaign metrics?
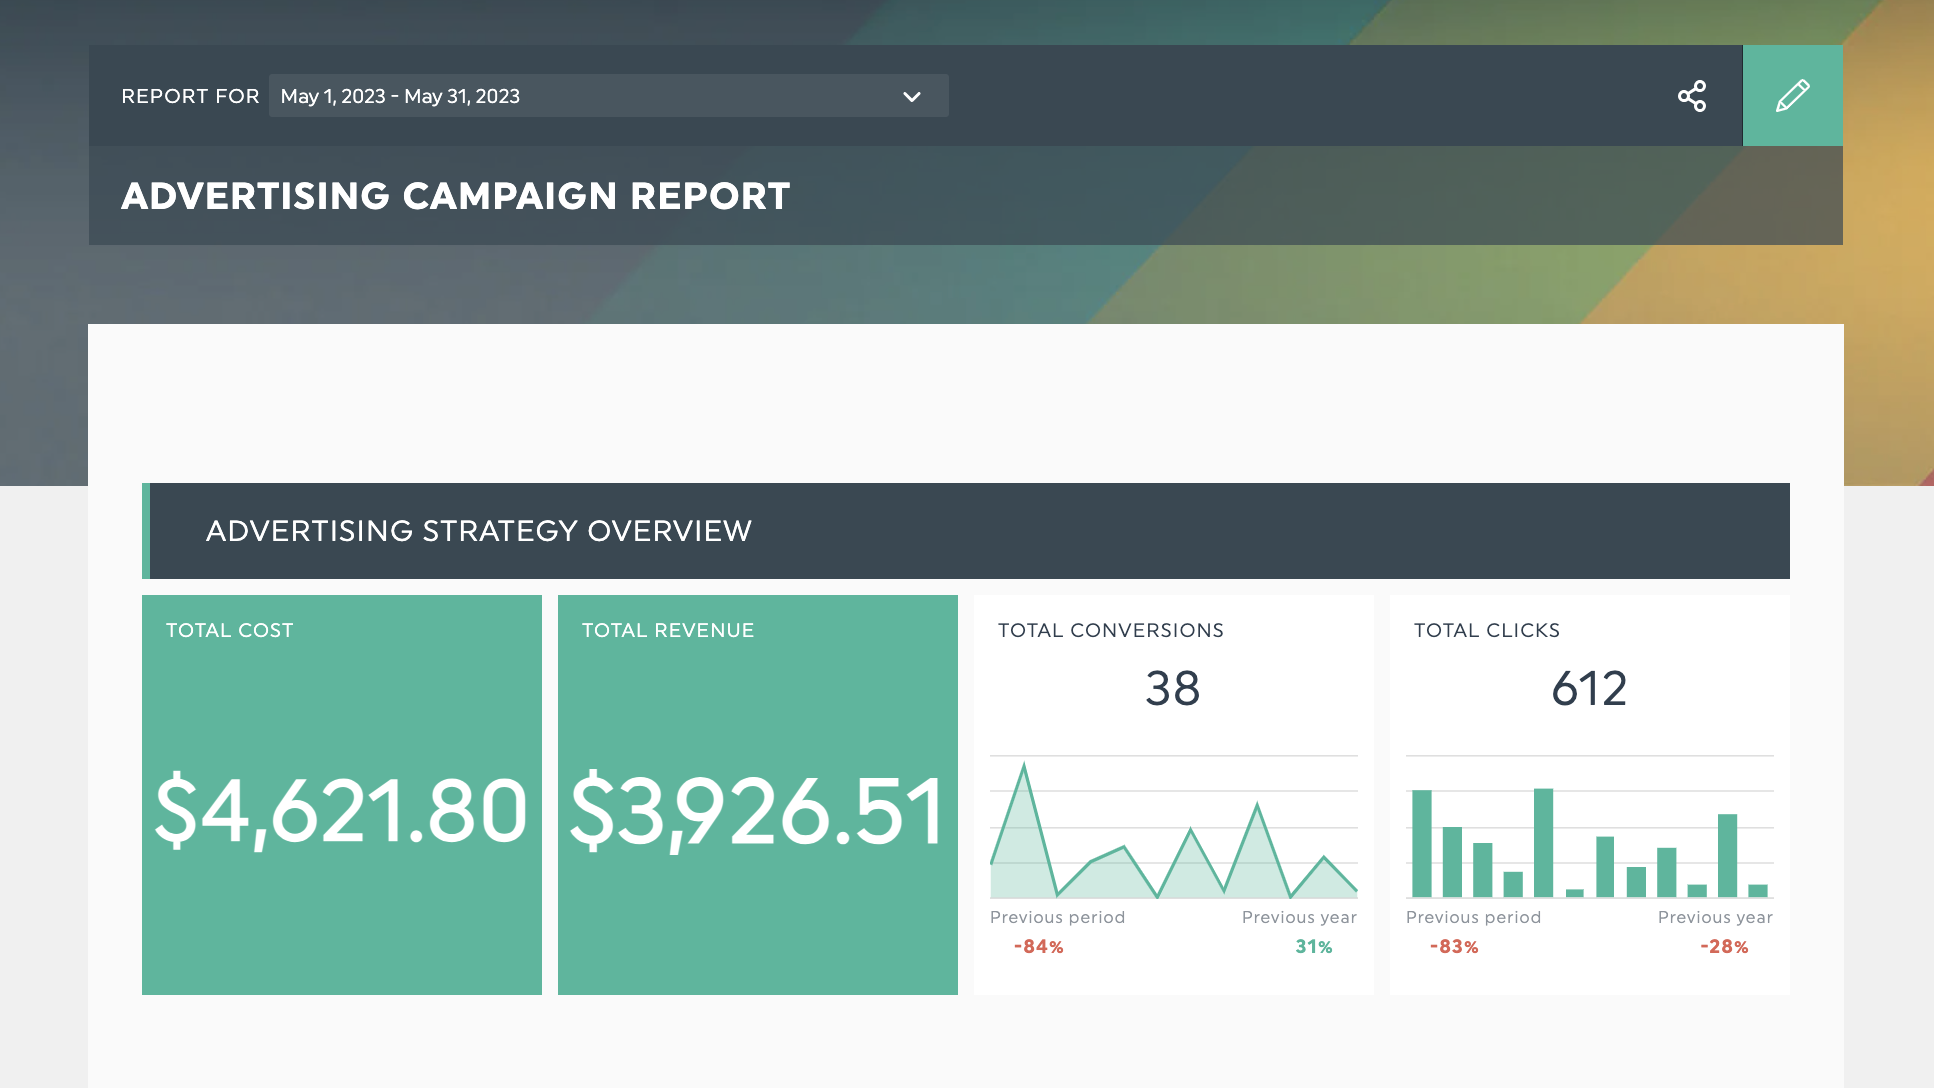
Get this advertising campaign reporting template with your own data!
Campaign metrics are specific marketing metrics used to determine whether a campaign works. These digital marketing metrics help your client understand they should invest more money in a campaign.
For example, you might use these metrics when developing a summer sale email campaign.
- Number of people who clicked on call-to-action (CTA) clicks
- Email open rate
- Referrals from email marketing
- Number of unsubscribed
How to choose campaign metrics to track
While metrics depend on your industry benchmarks and specific marketing goals, we’ve got a step-by-step process to show how to choose the right metrics to track the effectiveness of your campaign.
Step 1: What’s the goal of your campaign?
Naturally, setting goals as part of your marketing strategy provides direction and a target to align your marketing team. Marketers who set goals are 377% more likely to be successful than those who don’t.
For example, you’ve noticed your brand has dropped in search rankings over the last six months.
Organic traffic is one of your primary methods of lead generation and new customers, so you put together a search engine optimization (SEO) and content marketing campaign strategy to improve brand awareness and turn organic website traffic into marketing qualified leads (MQLs)
Don't stop there once you’ve got an idea of your goal!
Use the SMART goal or Objective and Key Results (OKR) method to make it more specific.
How a goal can look like using these methods:
SMART:
Double the total number of leads from organic traffic over the next 12 months by refreshing five targeted blog posts per month.
OKR objective:
Double the number of leads from organic traffic for our company’s key search terms:
Key results:
- Rank on the top 10 positions on target high volume, high intent keywords
- Refresh five existing blog posts
- Build 3 high-quality backlinks to each updated article
Your action step:
Use the OKR or SMART goal-setting method to get specific on your campaign goals
Step 2: What do you need to know?
So you've defined your marketing goals, and now you want to measure progress toward them and quantify the impact of your campaign.
Metrics chosen should answer two questions:
- Can we measure how this campaign helps us meet our business goal?
- Are we on track to meet these goals?
So if you’ve got a business goal of meeting an annual recurring revenue of $1 million, your marketing campaign goal can be to generate 25 inbound marketing leads per month in the next six months.
Metrics to measure progress:
- Landing page conversion rate
- Keyword rankings
- Email click-through rate
Your action step:
Consider metrics to measure campaign progress
Helpful resources:
- 100+ KPI examples to help you find your most important metrics
- Our report template library with the most popular KPIs for different campaign types
Step 3: Organize it all nicely in a report
Now that you've got your metrics and goals, it's time to turn information into insights.
At its core, reports are a communication tool. So here’s your opportunity to help your client or team:
- Understand the latest status of your campaign
- Get approval for more budget or resources
- Get buy-in from senior stakeholders by highlighting how your campaign helps the business' bottom line.
And while Excel spreadsheets might work for reporting, they take time to assemble. Plus, they’re not the most intuitive to look at.
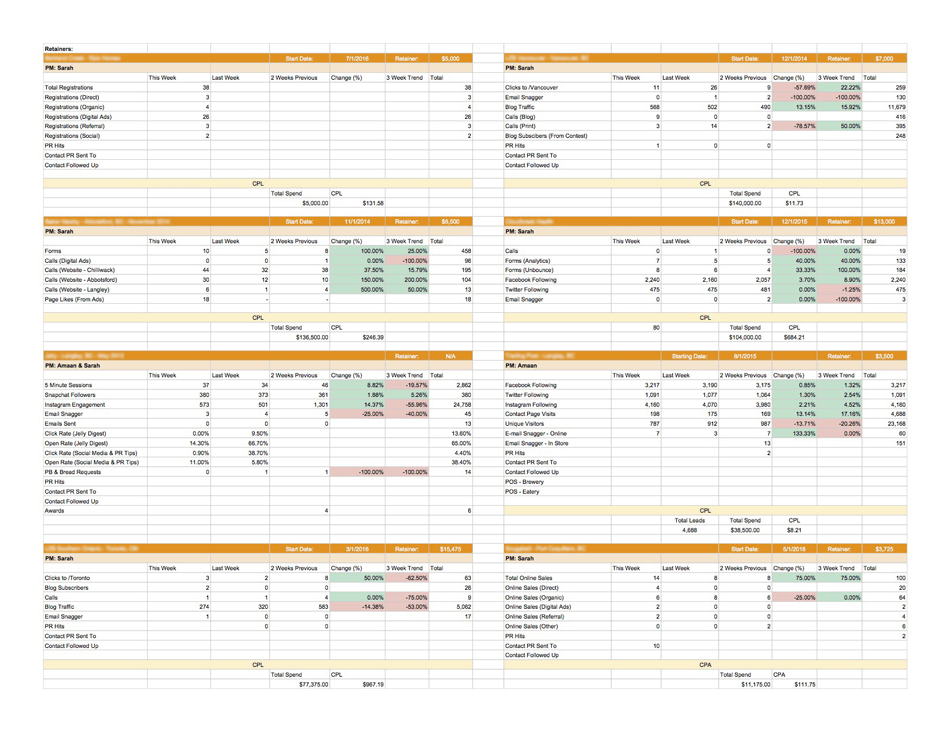
Before marketing agency Jelly Marketing used DashThis they were creating client reports with Microsoft Excel.
Reporting tools like DashThis can help with these steps! Fine-tuning your reporting process and creating visual dashboards can clarify your campaign reports to your client.
Ask our customer Jelly Marketing, who saved over 20 hours of work per month on reporting alone.
Your action step:
Give DashThis’s reporting software a try! We have a 15-day free trial for you to try out our features, perfect for your following two weekly campaign reports.
The 8 most important metrics to determine campaign success
1. Number of impressions
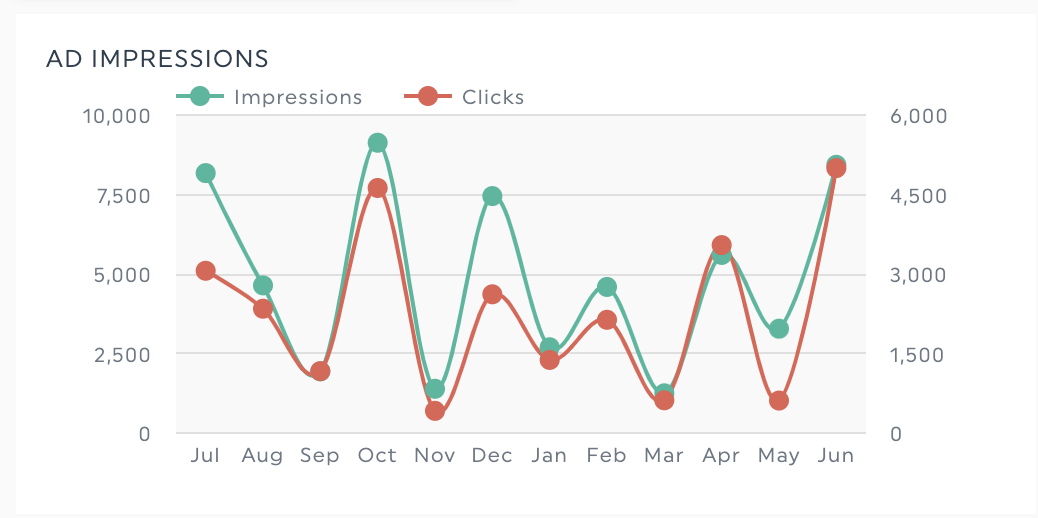
Impressions are the number of times your ads are shown to people and measure how much attention your campaigns get.
Best for:
- Tracking the effectiveness of a brand campaign
- Verifying if your pay-per-click campaigns are working.
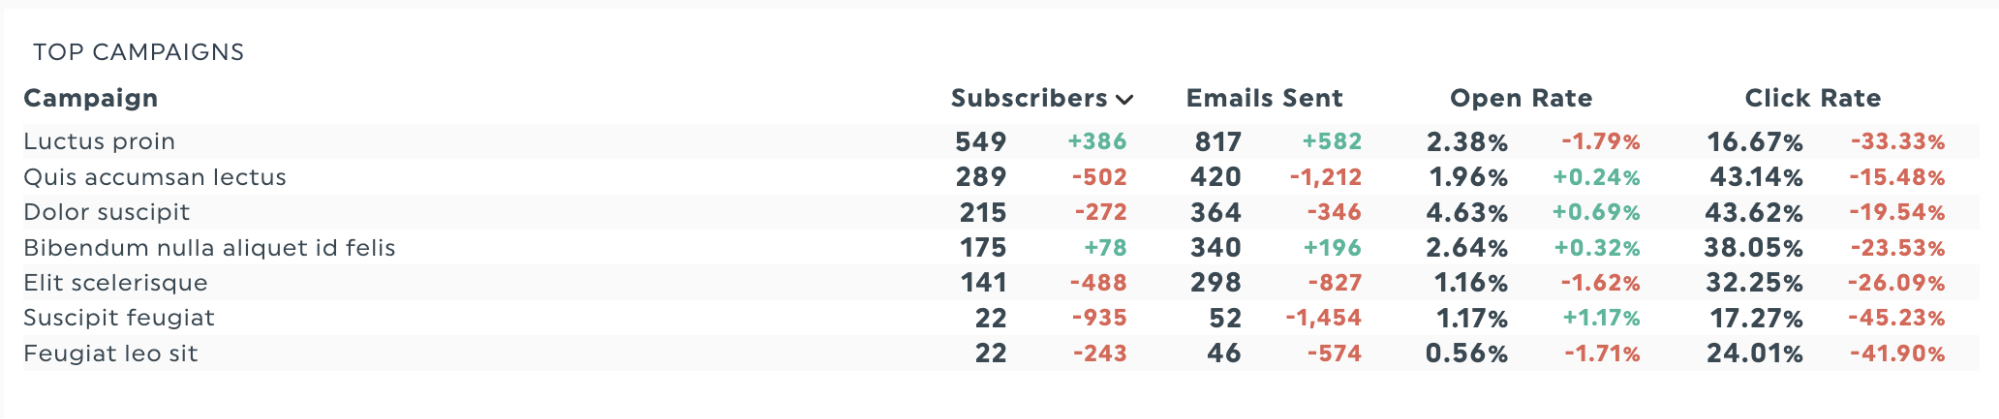
2. Number of clicks / click through rate (CTR)
Clicks and clickthrough rates are essential for email marketing and PPC campaigns as they track how relevant your campaigns are to the people who see them.
Best for:
- Answering if your copy and targeting resonate with your target audience
- Identify A/B testing opportunities for email and PPC campaigns
3. Cost per click
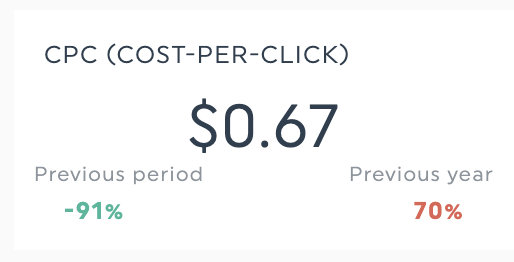
While marketing budgets are projected to grow in 2023, advertising costs can increase quickly. Monitor your cost-per-click, cost-per-conversion, and overall campaign spending to identify cost-effective keywords and campaigns.
Best for:
- Identifying cost-effective keywords for your PPC campaigns.
- Projecting your CPC or advertising budget for budget approval
4. Conversion rate
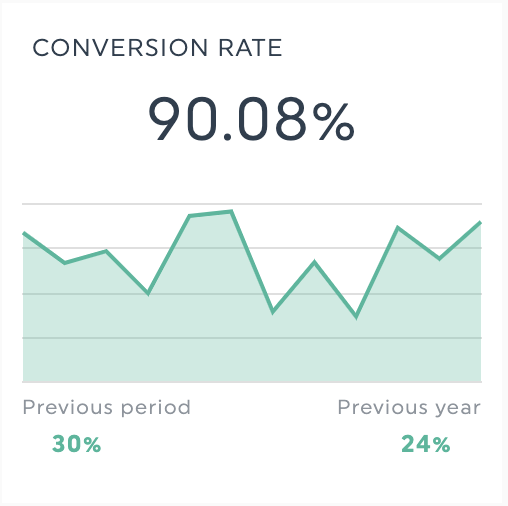
Most campaign reports will include conversion rate metrics because it's one of the metrics that most impact business results, whether it's a purchase, a form, or a free trial signup. For instance, an organization might measure its website conversion rate. This way, they can see how well their website converts visitors into buyers.
Best for:
- Linking campaign activity to tangible business results
- Identifying advertising campaigns to focus on or optimize further
5. Cost per acquisition (CPA)
Cost per acquisition answers how much you spend to gain something that isn’t a paying customer yet. Think leads, free trial conversion, or landing page signups.
Note: Cost per acquisition and customer acquisition cost (CAC) are similar metrics that measure different things.
- Customer acquisition cost refers to your overall cost of getting a customer across all marketing channels
- Cost per acquisition can be calculated separately for each marketing channel to understand where to allocate your marketing budget.
Best for:
- Planning your marketing budget to understand what campaigns to invest in and how much to spend to get a paying customer
- Tracking cost efficiency of different marketing channels
6. Return on ad spend (ROAS)
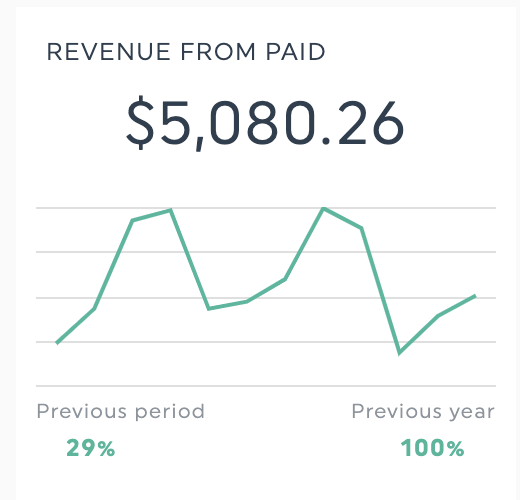
Return on ad spend tracks how much you’ve earned in sales and leads against total campaign costs.
Have this metric in your report if you’re presenting to budget-conscious stakeholders like your executive team or evaluating which marketing channel is most efficient at generating results. Track ROAS against metrics like cost per lead or customer lifetime value to get a complete picture of your pipeline.
Best for:
- Determining campaign cost efficiency
- A/B testing different ad campaigns
7. Customer lifetime value (CLV)
How much revenue does a customer create for your business over their lifetime?
That’s where measuring customer lifetime value comes in.
Here’s how to calculate CLV:
- Find your average order value (AOV). Try tracking 1-3 months of your AOV for starters
- Calculate the average number of transactions over your measured time period
- Determine how long a customer sticks with your business.
To make the data even more helpful, segment your CLV data! Try these segments:
- Customer size
- Location
- Tier (loyalty program vs. standard)
- Which marketing channel they converted from
Best for:
- Identifying the acquisition channels or strategies that bring in high-value customers
- Finding gaps in your customer journey to encourage customer activity
8. Quality Score
Running PPC campaigns on Google Ads or Facebook Ads?
Monitor your Quality Score (or Quality Ranking on Facebook Ads) as it affects your campaign’s cost per click and how often your ads will show for your target keywords.
Best for:
- People who want to know how your PPC campaigns are doing
- Improving the return on investment (ROI) of your PPC campaigns
How to track your campaign metrics with DashThis
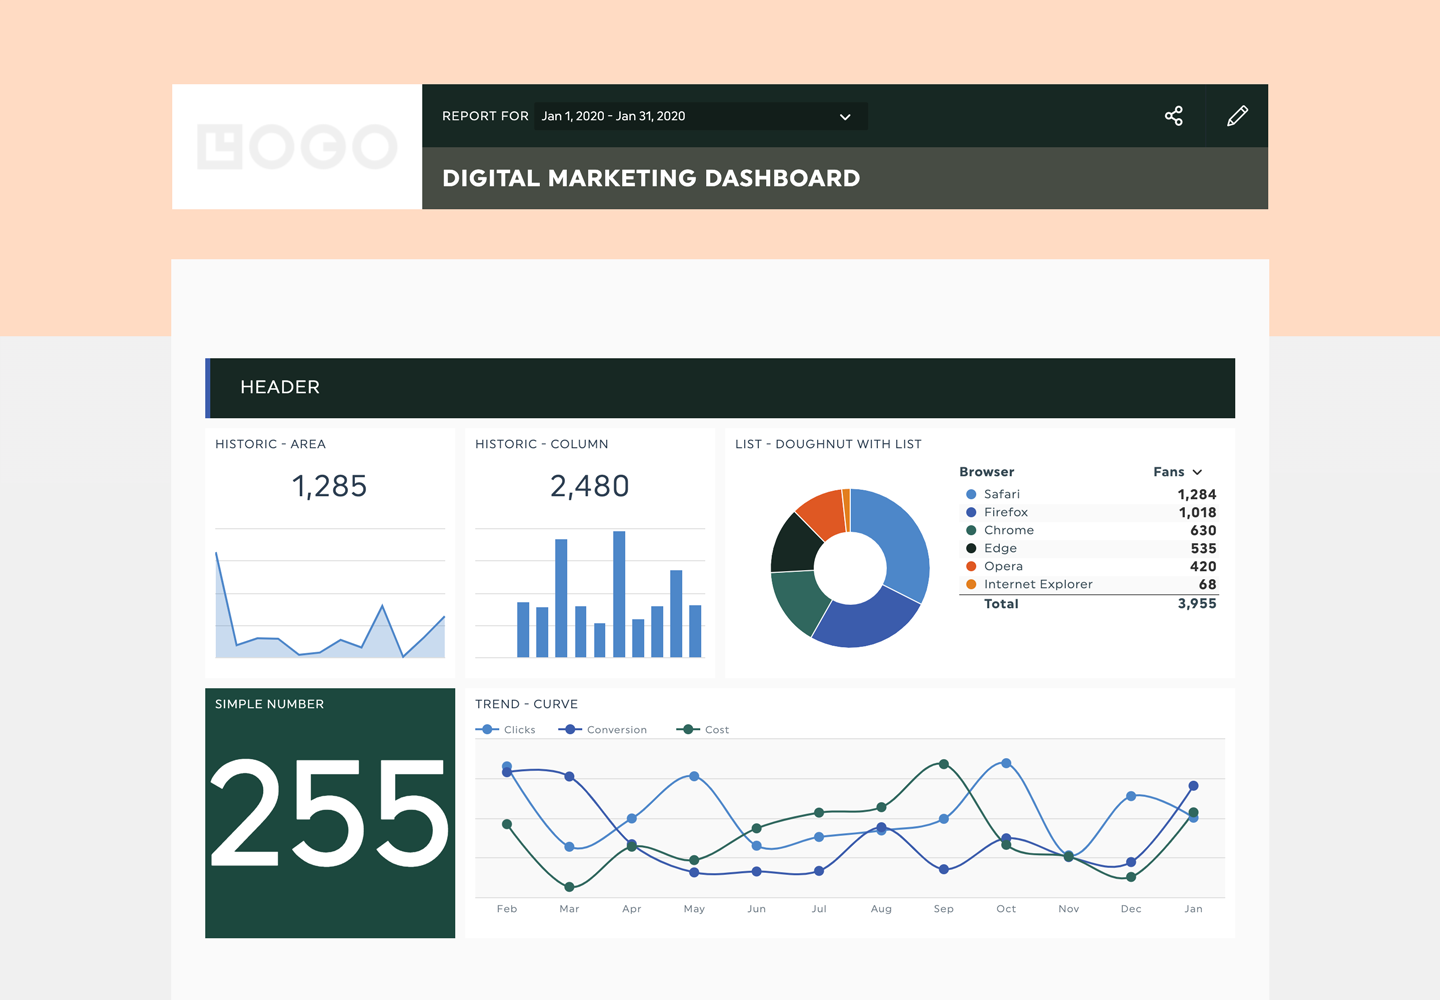
Get your campaign KPIs into a report with your own domain and branding with DashThis’s white-labeled reports.
- Sign up for a 15-day free trial with DashThis
- Create your campaign dashboard from scratch or save time with our campaign reporting template below
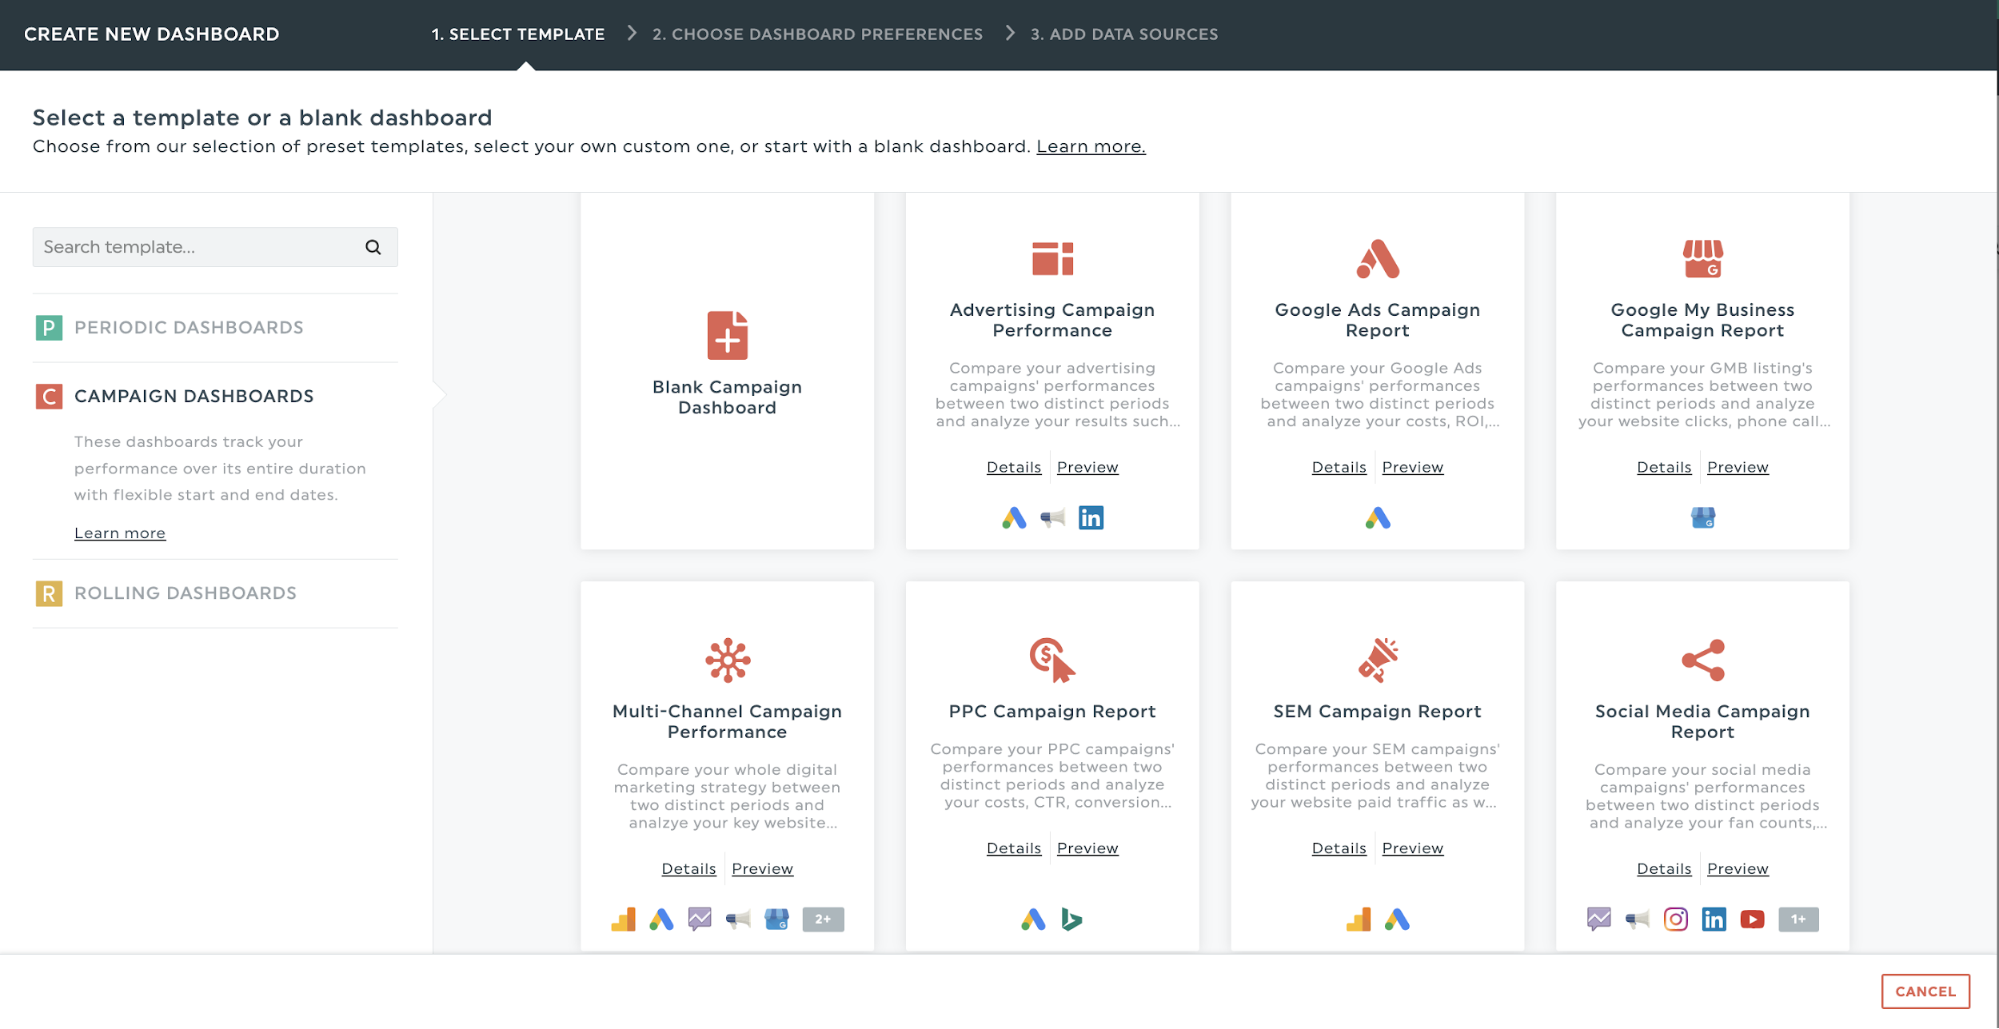
- Give your dashboard a name and define a timeframe for your campaign
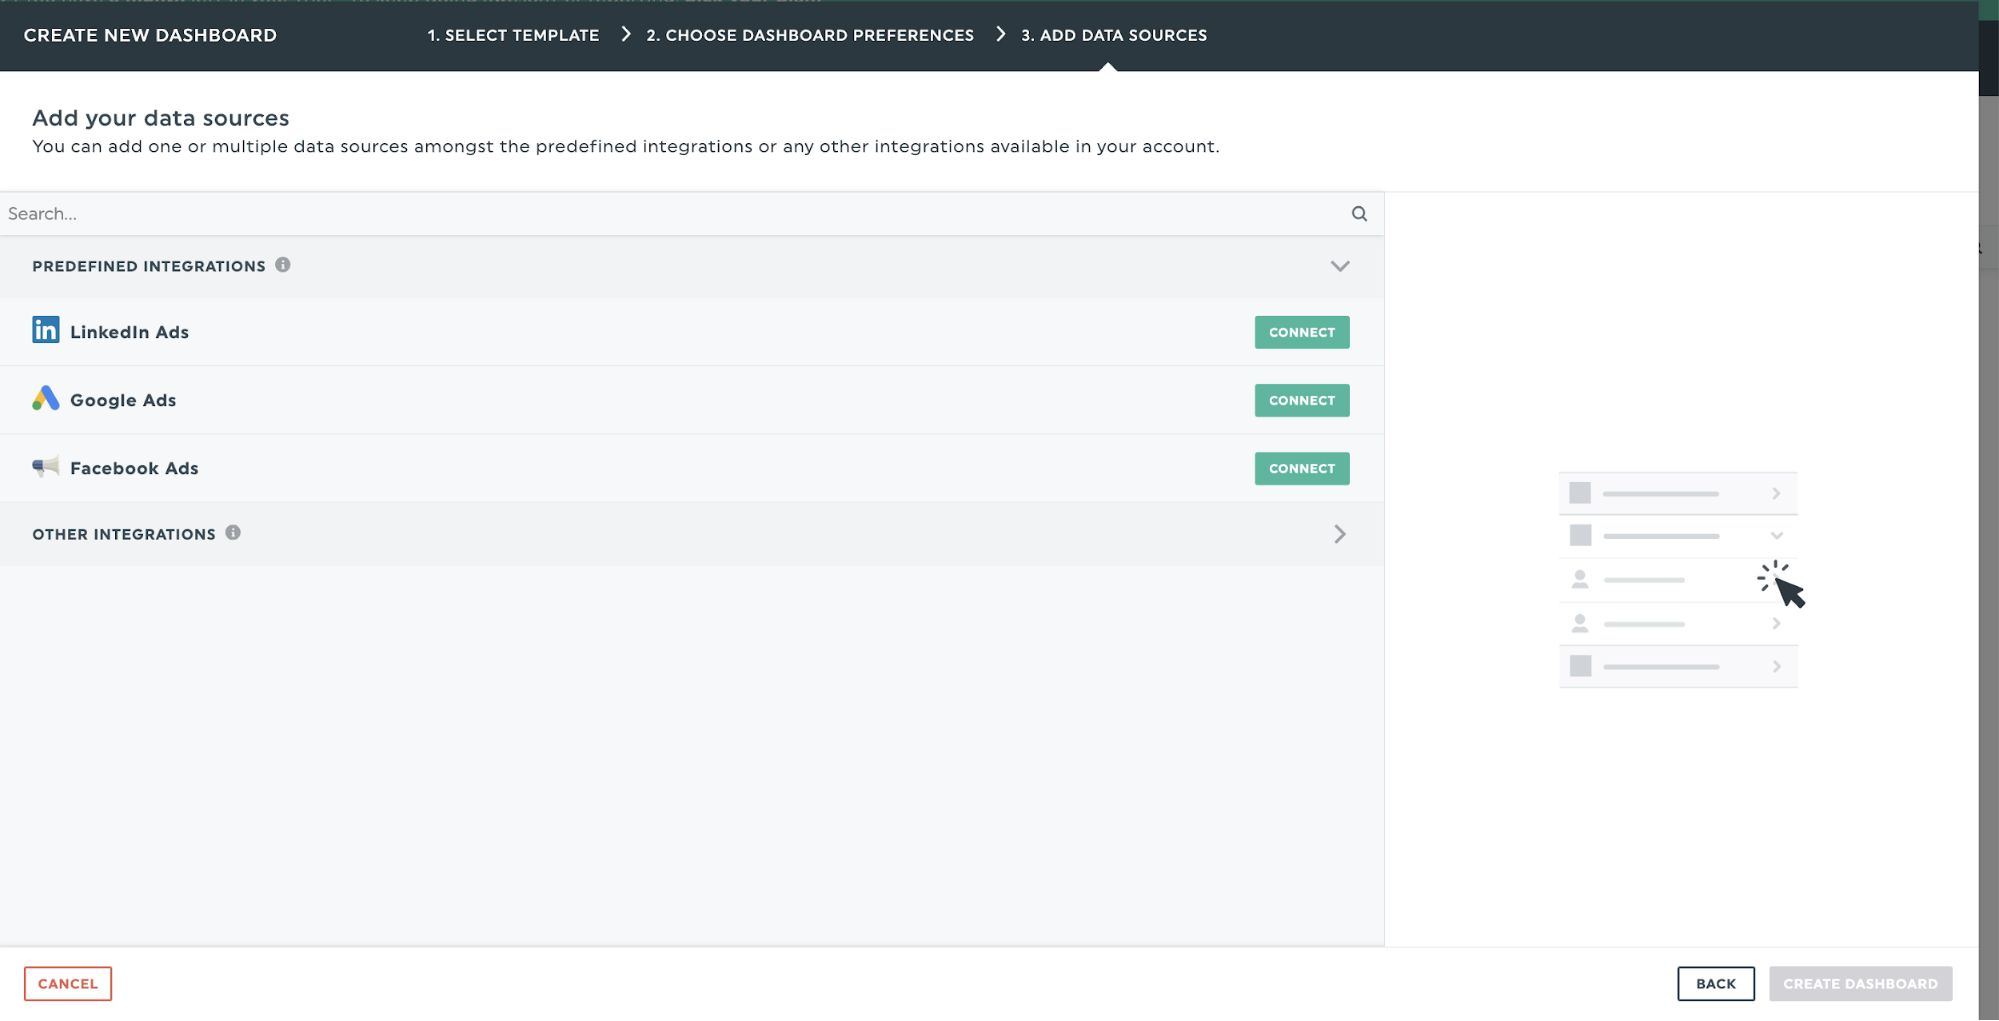
- Connect your favorite marketing and web analytics tools with DashThis’s 34+ integrations, including Google Analytics, Google Ads and LinkedIn
- Customize your metrics and headers to fit your needs
Campaign performance report template
Get this advertising campaign reporting template with your own data!
Gather all your campaign performance data into one easy-to-read report, whether email campaigns, Facebook ads, or social media engagement rate data.
Here’s what you get with our campaign report template:
- A performance overview in real-time to get critical bottom-line KPIs like revenue and cost figures - perfect for presentations to executive teams
- Channel-specific performance metrics to review which campaigns are pulling in the most results
- Campaign and ad-level performance reports to guide tactical optimization decisions
Automate your campaign KPI reporting
Quality campaign reports take time to assemble, structure for maximum impact, and analyze.
That’s where automation tools like DashThis help save you valuable time on reporting - time that compounds the more clients you have. Rather than manually assembling reports, your time is better spent brainstorming ideas or refining strategies for your clients.

Track your most crucial campaign metrics with Dashthis
Read More

Don’t miss out!
Follow us on social media to stay tuned!
Automate your reports!
Bring all your marketing data into one automated report.
Try dashthis for free